

Abstract
Aims
We aim to evaluate if the myelin pathology observed in epilepsy‐associated focal cortical dysplasia type 2B (FCD2B) and—histologically indistinguishable—cortical tubers of tuberous sclerosis complex (TSC) is primarily related to the underlying malformation or constitutes a secondary phenomenon due to the toxic microenvironment created by epileptic seizures. We also aim to investigate the possible beneficial effect of the mTOR pathway regulator everolimus on white matter pathology.
Methods
Primary mixed glial cell cultures derived from epilepsy surgery specimens of one TSC and seven FCD2B patients were grown on polycaprolactone fibre matrices and analysed using immunofluorescence and electron microscopy. Unaffected white matter from three age‐matched epilepsy patients with mild malformations of cortical development (mMCD) and one with FCD3D served as controls. Additionally, TSC2 knock‐out was performed using an oligodendroglial cell line. Myelination capacities of nanofibre grown cells in an inflammatory environment after mTOR‐inhibitor treatment with everolimus were further investigated.
Results
Reduced oligodendroglial turnover, directly related to a lower myelin content was found in the patients' primary cells. In our culture model of myelination dynamics, primary cells grown under ‘inflammatory condition’ showed decreased myelination, that was repaired by treatment with everolimus.
Conclusions
Results obtained in patient‐derived primary oligodendroglial and TSC2 knock‐out cells suggest that maturation of oligodendroglia and production of a proper myelin sheath seem to be impaired as a result of mTOR pathway disturbance. Hence, oligodendroglial pathology may reflect a more direct effect of the abnormal genetic programme rather than to be an inactive bystander of chronic epilepsy.
Keywords: focal cortical dysplasia 2B, myelination, nanofibres, oligodendrocyte, tuberous sclerosis complex
Results obtained in patient‐derived primary oligodendroglial and TSC2 knock‐out cells indicate a higher number of oligodendroglial precursor cells, yet a decline in myelin. Interestingly, everolimus repaired myelin formation and normalized proliferative activity.

Abbreviations
- AEDs
antiepileptic drugs
- ASD
autism spectrum disorder
- Cas9
CRISPR associated protein 9
- CNPase
2′,3′‐cyclic nucleotide‐3′‐phosphodiesterase
- CNS
central nervous system
- CRISPR
clustered regularly interspaced short repeats
- DMEM
Dulbecco's modified Eagle's medium
- DNAse I
deoxyribonuclease 1
- EM
electron microscopy
- EV
everolimus
- FCD2B
focal cortical dysplasia type 2 B
- FCS
fetal calf serum
- GFAP
glial fibrillary acidic protein
- HOG
human oligodendroglioma
- HOG‐ko
HOG TSC2 knock‐out
- HOG‐wt
HOG wild‐type
- ID
intellectual disability
- IL‐1β
interleukin‐1 beta
- IOD
integral optical density
- iPSC
induced pluripotent stem cell
- IQ
intelligence quotient
- KO
knock‐out
- Map 2
microtubule‐associated protein 2
- MBP
myelin basic protein
- MCD
malformations of cortical development
- MEM
minimum essential media
- mMCD
mild malformation of cortical development
- MRI
magnetic resonance imaging
- mTOR
mammalian target of rapamycin
- NG2
neural/glial antigen 2
- NML
neuronal migration lines
- O4
oligodendrocyte marker 4
- OPCs
oligodendrocyte precursor cells
- PFA
paraformaldehyde
- PLL
poly‐l‐lysine
- PLP
proteolipid protein
- pS6
phosphor S6
- SEGA
subependymal giant cell astrocytoma
- SEN
subependymal nodules
- TAND
TSC‐associated neuropsychiatric disorders
- TSC
tuberous sclerosis complex patients
- WT
wild‐type
1.
Key points
Higher number of oligodendroglial precursor cells in nanofiber cultures of patient‐derived primary oligodendroglial and TSC2 knock‐out cells
Reduced oligodendroglial turn‐over directly related to a decline in myelin
Everolimus repaired myelin formation and normalized proliferative activity
2. INTRODUCTION
The myelin sheath of the brain is an extended plasma membrane consisting of specific proteins and lipids that is concentrically wrapped around axons. It acts as an electrical isolator and contributes to the metabolic support of axons [1, 2]. Oligodendrocytes, the myelin producing cells, originate from oligodendrocyte precursor cells (OPCs), also referred to as NG2 glia in the literature [3]. The cell lineage has to undergo a complex and precisely timed programme that is tightly controlled by a myriad of both intracellular and extracellular factors [4, 5]. Interestingly, the mammalian target of rapamycin (mTOR) signalling pathway is commonly discussed as a key player in oligodendroglial lineage progression and initiation of myelination [5]. Further, a contribution of the mTOR pathway to cytoskeletal reorganisation during oligodendrocyte development and oligodendroglial branching complexity was recently observed [6].
Over the past decade, both neuropathological and genetic characteristics of malformations of cortical development (MCDs) have been increasingly explored. The term ‘mTORpathies’ was recently established for a group of neurological disorders characterised by altered cortical lamination, neuronal morphology and pharmacoresistant epilepsy due to mutations leading to enhanced activation of the mTOR pathway [7, 8]. Tuberous sclerosis complex (TSC), a multisystem disorder caused by mutations in either the TSC1 or TSC2 genes leading to benign tumours in almost all organ systems, is the most studied mTORpathy. TSC‐associated central nervous system (CNS) manifestations include cortical tubers, neuronal migration lines (NML), subependymal nodules (SEN) and subependymal giant cell astrocytoma (SEGA) [9, 10]. Histopathological hallmark features of cortical tubers are loss of normal cortical organisation, limited myelination of the lesional white matter and a multiplicity of abnormal cells, such as dysmorphic neurons and giant cells [11, 12]. Focal cortical dysplasia type 2B (FCD2B) is similar to TSC both morphologically and genetically [13]. While cortical neurons have been characterised as the primary cause of epilepsy, impairment of the fragile process of myelination has emerged as a prominent field of research only over the last years, mostly due to its role in cognitive development [14]. The two mTORpathies described above display depleted white matter within the lesional areas, detectable in both presurgical MRI [15, 16], and resected lesional tissue [17, 18]. Children with TSC/FCD2 frequently suffer not only from epilepsy, but also from a variety of neuro‐psychiatric co‐morbidities, primarily intellectual disability (ID) and/or autism spectrum disorder (ASD) [19, 20, 21]. Since co‐occurrence of epilepsy and ID/ASD was reported in approximately 25%–54% of children with epilepsy, research has focused on the shared biology of these conditions [22, 23]. Not surprisingly, in the context of the related genetic background, growing recognition has been given to underlying white matter abnormalities [15, 16, 24, 25]. Alterations in oligodendrocyte production and axonal myelination have been shown to be involved in the pathophysiology of ASD [26]. New imaging techniques sensitive to white matter have demonstrated that abnormalities in water diffusion in several white matter structures are found within and outside the epileptogenic lesion, demonstrating that epilepsy is not solely a focal disorder, but rather a brain network disease (detailed review see previous study [27]). The white matter has been increasingly recognised to be responsible for neuropsychological/neuropsychiatric comorbid disorders—also recently referred to as TSC‐associated neuropsychiatric disorders (TAND) [28, 29, 30, 31]. However, we do not understand to what extent deficits in oligodendrocyte function contribute to the pathology found in TSC and FCD2B patients. Neuropathological features implicate a link between myelin reduction and a lower number of oligodendrocytes and their precursors in and around cortical lesions of patients with mTORpathies, and different rodent models have further demonstrated that oligodendrocyte‐specific loss of TSC1 resulted in an abnormal myelination [17, 32]. Interestingly, abnormal proliferation and differentiation of OPCs was also observed in the dysplastic cortex of FCD2A patients [33]. Since a specific axonal diameter is essential for efficient myelination of axons, we applied a suitable scaffolding material (polycaprolactone fibre matrices‐nanofibres) to serve as a three‐dimensional microenvironment for collected white matter samples from paediatric patients who underwent epilepsy surgery. We used this model to test the hypothesis that there is a cell autonomous effect of mTOR pathway activation on oligodendrocytes and myelin health [34, 35].
The primary aim of our study was to examine the direct influence of mTOR pathway dysregulation on oligodendrocyte differentiation and myelin formation, and to investigate if hypomyelination may be reversed by application of the mTOR pathway regulator everolimus.
3. MATERIALS AND METHODS
3.1. Patient inclusion criteria
Surgically resected cortical white matter specimens from patients with drug‐resistant epilepsy and MCDs (seven FCD2B, one FCD3D and three mMCD patients), who underwent presurgical evaluation at the Paediatric Epilepsy Center and surgery within the Epilepsy Surgery Program at the Department of Neurosurgery, Medical University Vienna were included in this study. Additionally, primary cells derived from one TSC patient from the neurobiobank Amsterdam UMC, location AMC were included. Reference paraffin sections were screened for the presence of dysmorphic neurons and balloon/giant cells. The absence of these cells was an inclusion criterion for the control cohort. The medical histories of all patients were reviewed and only patients with no mTOR inhibitor treatment (e.g. Afinitor) prior to surgery were included. The patient cohorts were age‐matched for all experiments. The study was performed following to the guidelines of good laboratory practice of the European Commission and informed consent was obtained. The local ethics committee of the Medical University of Vienna gave a positive vote for the study plan (EC978/2009).
3.2. Tissue preparation
The primary mixed glial cell culture was carried out with freshly resected white matter specimens, according to the murine protocol of Mecha et al. [36] Briefly, a 0.5 × 0.2 cm piece of white‐matter was collected after resection. After mincing, the tissue was further homogenised by tituration. Next, enzymatic digestion was performed by applying freshly prepared papain solution (containing DNAse I, l‐cysteine, and papain) for 20 min at 37°C. Afterwards, digestion was inactivated with Dulbecco's modified Eagle's medium (DMEM) plus 10% fetal calf serum (FCS). A single cell suspension was generated by using a glass Pasteur pipette to further disconnect the tissue suspension. Several centrifugation steps were performed to remove cell debris. The cells were transferred into a T25 flask and when cells reached 100% confluence, they were used for myelination assays.
3.3. DNA isolation and sequencing
DNA isolation and sequencing were done with lesional white matter. Reference paraffin sections contained balloon cells in the FCD2B cohort and giant cells in the tissue of the TSC patient. Also, scattered dysmorphic neurons were present in the lesional white matter of FCD2B (n = 7) and TSC (n = 1) patients. Within the reference sections of the control patients, no aberrant cells were present. DNA was back‐extracted from the organic layer remaining after Trizol (Qiagen) isolation; back extraction buffer (10 mM Tris–HCl, pH 7.5; 125 mM NaCl; 10 mM EDTA pH 8.0; 1% SDS; 6 M Urea) was added in a 1:3 ratio in respect to the original trizol volume and homogenised. The mix was incubated for 10 min at room temperature and subsequently spun down for 15 min, 18,000 g at room temperature. The aqueous phase was retrieved and precipitated by adding an equal volume of isopropanol and 1:1000 GlycoBlue (Inivitrogen); the precipitation was performed over night at −80°C. After the precipitation, the solution was spun down for 15 min at 18.000 g at 4°C. The pellets were washed three times with 70% ethanol, air dried and resuspended in nuclease‐free water (Invitrogen). Samples were measured by nanodrop (Thermofisher) prior to sequencing.
Somatic mutation analysis was performed with snap‐frozen brain lesion material. For next‐generation sequencing (NGS), a custom‐made Ion AmpliSeqTM Focal Cortical Dysplasia panel (ThermoFisher Scientific, Waltham, Massachusetts) was used for targeted multi‐gene amplification of: AKT1, AKT3, BRAF, DEPDC5, FGFR1, NPRL2, NPRL3, PIK3CA, PIK3R1, PIK3R2, PTEN, RHEB, RPS6, SCL35A2, TBC1D7, TSC1 and TSC2. The Ion AmpliSeq Library Kit 2.0 was used for libraries, the Ion Chef Instrument for emulsion PCR and template preparation. The Ion Genestudio S5 Prime platform with the Ion 540 Chip was used for sequencing. Five per cent was chosen as background noise to determine the total number of existing non‐synonymous gene mutations per lesion.
3.4. Generation of HOG knock‐out cells
The Human Oligodendroglioma (HOG) Cell Line (#SCC163, Millipore) was used to generate HOG TSC2 knock out cells. TSC2 knock out cells were produced by ProTech at Vienna Biocenter Core Facilities by using Clustered Regularly Interspaced Short Repeats (CRISPR)/CRISPR associated protein 9 (Cas9) system. Additionally, the knock‐out was confirmed via western blot (Figure S1).
3.5. Myelination assays
Myelination properties were observed on polycaprolactone nanofibres (Sigma‐Aldrich, #Z694614‐12EA), serving as neuron‐free three‐dimensional microenvironments. Nanofibre plates were removed from the sterile pouch, placed inside 12‐well plates and 20,000 cells were seeded per well. For performing the standard‐assay, cells were grown on nanofibres for 9 days in standard media containing DMEM with GlutaMax, pyruvate, 10% FCS and 1% penicillin/streptomycin. The IL‐1β‐assay was done to observe oligodendroglial lineage progression and myelination in an inflammatory environment. After 24 h, nanofibre‐grown cells were treated with 30 ng/ml IL‐1β and grown for another 8 days. The everolimus‐assay was applied to investigate a possible influence of everolimus on myelination capacity. After 24 h, cells were treated with 30 ng/ml IL‐1β and incubated at 37°C for another 24 h. Then, cells were further treated with 20 nM everolimus and grown for 7 days on nanofibres (see Figure S2).
3.6. Immunofluorescence
After differentiation for 9 days on nanofibres, immunofluorescent labelling was performed to observe oligodendroglial lineage progression and myelination. In brief, cells were fixed with 4% ice‐cold paraformaldehyde (PFA) for 10 min. Thereafter, the membrane was permeabilized with 0.3% Triton X‐100 for 5 min and blocked with 10% Dako AB‐Diluent for 1 h. Next, primary antibodies were diluted in 10% blocking solution and applied overnight. The following dilutions were used: anti‐CNPase (Millipore, #MAB326, 1:100); anti‐MBP (Millipore, #MAB386, 1:100); anti‐O4 (R&D Systems, #MAB1326, 1:50); anti‐PLP (abcam, #ab28486, 1:500); anti‐NG2 (Milipore, #AB5320, 1:300); anti‐pS6 (Cell Signalling, #4857, 1:1000); anti‐GFAP (Millipore, #MAB3402, 1:800; Dako, #Z0334, 1:3000); anti‐Map 2 (Millipore, #MAB3418, 1:1000). Secondary antibodies (AF488 A‐11029 Thermo Scientific, Cy3 016‐160‐084 Jackson ImmunoResearch) were incubated for 1 h in the dark. Nucleus staining for orientation was done with DAPI solution (300 nM) and then cells were mounted with AquaPolymount (Polysciences, #A759659).
3.7. Western blot
Material from three representative patients was used (1 FCD2B, age 8 years; 1 TSC, age 2 years; mMCD, 5 years). White matter tissue was lysed with RIPA lysis buffer (Upstate, 20‐188) containing phosphatase 2,3 (Sigma‐Aldrich, P5726, P0044) and protease inhibitor cocktail (Sigma‐Aldrich, P8340). After determination of the total protein concentration via Lowry assay, 15 μg of protein was mixed with sample buffer (23 Laemmli sample buffer, BIO‐RAD), loaded on SDS gels (Mini‐Protean TGX Precast Gels; 4%–12%, Bio‐Rad) and run for 90 min at 90 V. Tank blotting was performed with PVDF membranes at 100 V for 60 min. Next, membranes were blocked with 3% milk for 1 h. Primary antibodies anti‐CNPase (Millipore, #MAB326, 1:1000); anti‐MBP (BioSite, #BS188, 1:2000); anti‐PLP (abcam, #ab28486, 1:5000); anti‐NG2 (Millipore, #AB5320, 1:300) were incubated over night at 4°C. Next day, after several washing steps, secondary antibodies (P044701 and P044801, DAKO) were applied for 1 h at room temperature. Membranes were developed with ECL solution (Amersham ECL Prime Western Blotting detection reagent). Chemiluminescence was detected via the BioRad ChemiDoc XRS Quantity One system.
3.8. Preparation of nanofibre cultures and tissue for electron microscopy
For analysis of myelination on polycaprolactone fibres, the mixed glial cell cultures were fixed with 4% PFA for 20 min and put in 0.1 M phosphate buffer for 24 h. Nanofibres were carefully detached from plastic slide and stained with 1% osmium tetroxide for 1 h at 4°C. FCD2B patient tissue was stained with 1% osmium tetroxide for 2 h at 4°C. Subsequently, fibres and tissue were dehydrated in a series of 50%, 70%, 80%, 96% and 100% ethanol. Tissue samples were placed in propylenoxide for 30 min followed by a 50:50 resin/propylenoxide‐mix for 15 min. Nanofibre samples were solely placed in a 50:50 resin/propylenoxide‐mix for 15 min. Samples were placed in fresh resin at 65°C overnight. Ultrathin sections (70 nm) were visualised with a FEI Tecnai T12 Transmission Electron Microscope G2 Spirit Biotwin using Veleta and Xarosa camera Plus integrated software.
3.9. Proliferation assay
A 96‐well plate was coated with poly‐l‐lysine (PLL, Sigma Aldrich, P2636), 2000 cells per well were seeded and grown for 5 days in standard media. For IL‐1β treatment, cells were treated after 24 h with 30 ng/ml IL‐1β. For observation of everolimus on proliferative activity of primary patient and HOG cells, 20 nM everolimus was added after 48 h to IL‐1β treated cells. On day 5, cells were incubated with 15 μL/well of Alamar Blue reagent (Invitrogen, DAL1025) for 3 h at 37°C. Then the absorbance at 570 nm and 600 nm was measured with PowerWave XS2 (BioTek). Standard media served as a blank.
3.10. Microscopy and image analysis
Photomicrographs of 12‐well nanofibre inserts were taken with Zeiss Axio Imager Z1 microscope and Ikaros. & Isis. Software or fluorescence microscope Olympus BX63 and CellSense software. A minimum of six images of every insert were further analysed. Images were imported into Fiji ImageJ software (version 2.0.0). At first, images were equated by defining the right scale (6.15 pixels/μm). For nanofibre cell culture characteristics, the percentage of positive‐staining cells was calculated and divided by the area (% of positive cells/0.1 mm2). This analysis was performed in data shown in Figure 1K–O. For detailed observation of the myelination capacity of cells grown on nanofibres, the colour threshold was determined for each single stain. The percentage of pixels under the threshold was considered as the percent of area positive for the respective marker and used for further analysis; DAPI was excluded. Integral optical density was determined by area (mm2) per cells (area/total cells) and respectively represents the total area of each oligodendroglial linage marker. Calculations were used for results demonstrated in Figures 2B–E, 3B–E, 4C,D, 6B–E and Figure S4.
FIGURE 1.

Cell culture characteristics of patient‐derived primary mixed glial cells and the HOG cell line. 2D‐cell culture of mMCD control (A), FCD2B (B), TSC (C), HOG TSC2 wild‐type (D) and HOG TSC2 knock‐out cells (E) (light microscopy). Scale bar = 6 μm. Representative images of O4 immunolabelling of mMCD control (F), FCD2B (G), TSC (H), HOG TSC2 wild‐type (I) and HOG TSC2 knock‐out (J) cells at day 9 of differentiation on nanofibres. Scale bar = 50 μm. Quantification of the number of cells immunostained for several markers of oligodendrocytes, neurons (Map 2) and astrocytes (GFAP) at day 9 of differentiation of patient‐derived primary mixed glial cells and HOG cells grown on nanofibres (K–O). Mann–Whitney U test was applied for statistical analysis with *p < 0.01. CNPase (green) and pS6 (red) immunolabelling of FCD2B (P); scale bar = 25 μm, TSC (Q); scale bar = 50 μm and HOG TSC2 knock‐out (R); scale bar = 100 μm cells grown on nanofibres. DAPI counterstaining (blue) was used to observe cell nuclei
FIGURE 2.

Decreased myelin in FCD2B and TSC patients. Representative images of immunolabelling of oligodendroglial lineage markers CNPase, PLP, MBP and O4 in control, FCD2B and TSC patient nanofibre cultures (A). DAPI counterstaining (blue) was used to observe cell nuclei. Scale bar = 50 μm. PLP TSC (scale = 20 μm). The integral optical density (IOD) of CNPase (B), PLP (C), MBP (D) and O4 (E) expression observed in patient nanofibre cultures. Dots represent patient (control (n = 4), FCD2B (n = 7) and TSC (n = 1) median of quantification. Mann–Whitney U test was applied for statistical analysis with *p < 0.01 and **p < 0.001
FIGURE 3.
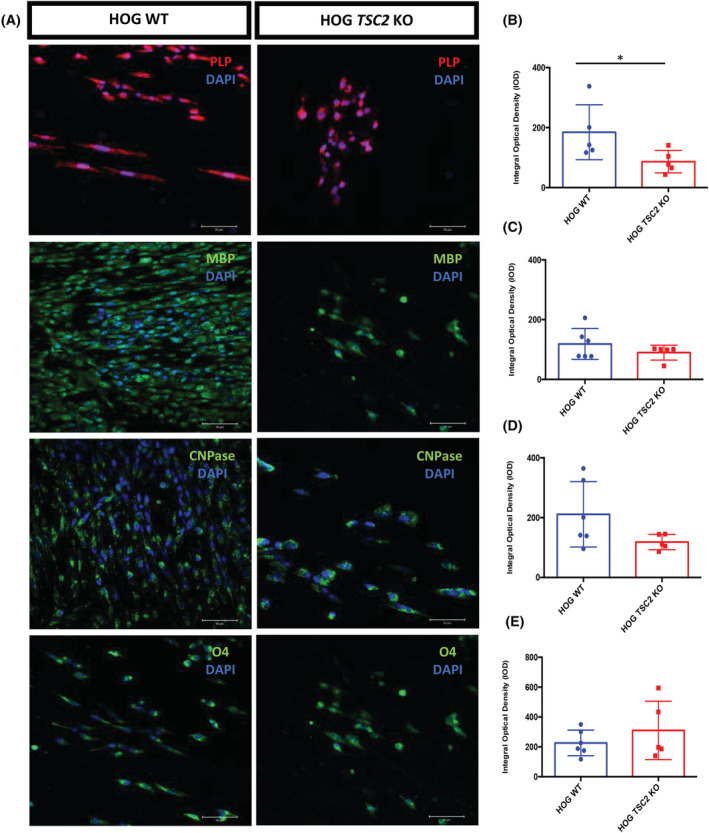
Decreased myelin in a TSC2 knock‐out cell line. Representative images of immunolabelling of oligodendrocyte lineage markers PLP, MBP, CNPase and O4 in TSC2 wild‐type and knock‐out cells grown on nanofibres (A). DAPI counterstaining (blue) was used to observe cell nuclei. Scale bar = 50 μm. The integral optical density (IOD) of PLP (B), MBP (C), CNPase (D) and O4 (E) expression observed in TSC2 wild‐type and knock‐out nanofibre cultures. Dots represent single measurements of quantification of HOG TSC2 wild‐type and knock‐out cells. Mann–Whitney U test was applied for statistical analysis with *p < 0.01
FIGURE 4.

Impaired myelination as a result of depleted oligodendroglial turnover. Representative images of immunolabelling of the oligodendrocyte precursor marker NG2 in control, FCD2B and TSC patient nanofibre cultures (A) and in TSC2 wild‐type and knock‐out cells grown on nanofibres (B). DAPI counterstaining (blue) was used to observe cell nuclei. Scale bar = 50 μm. NG2 control (scale bar = 100 μm). The integral optical density (IOD) of NG2 (C) expression observed in patient nanofibre cultures. Dots represent patient (control (n = 4), FCD2B (n = 7) and TSC (n = 1) median of quantification. The integral optical density (IOD) of NG2 (D) expression observed in TSC2 wild‐type and knock‐out nanofibre cultures. Dots represent single measurements of quantification of HOG TSC2 wild‐type and knock‐out cells. Mann–Whitney U test was applied for statistical analysis with *p < 0.01 and **p < 0.001. Western blot of myelin (MBP, PLP), oligodendrocytes (O4, CNPase) and their precursor cells (NG2) in representative control, FCD2B and TSC patient white matter samples (E). Beta‐actin was used as loading control
FIGURE 6.

Everolimus treatment of cells grown in an inflammatory environment repairs oligodendroglial lineage progression in HOG TSC2 knock‐out cells and significantly increases CNPase expression in FCD2B patient cells. Representative images of immunolabelling of oligodendroglial lineage markers CNPase (A, A) in FCD2B patient primary nanofibre cultures and MBP (A, B) in TSC2 knock‐out cells grown on nanofibres. The integral optical density (IOD) of CNPase (B) expression observed in treated patient nanofibre cultures. Bars represent patient (control (n = 4), FCD2B (n = 6) and TSC (n = 1) median of quantification. Mann–Whitney U test was applied for statistical analysis with **p < 0.01 and **p < 0.001. The integral optical density (IOD) of CNPase (C), PLP (D) and MBP (E) expression observed in treated TSC2 wild‐type and knock‐out nanofibre cultures. Bars represent single data of quantification of HOG TSC2 wild‐type and knock‐out cells. Mann–Whitney U test was applied for statistical analysis with **p < 0.01 and **p < 0.001. Abbreviations: IL‐1β, interleukin‐1 beta; EV, everolimus
3.11. Statistical analysis
Data analyses and visualisation were conducted with GraphPad Prism (Version 8) and SPSS (Version 26.0). Statistical analyses were performed using SPSS and non‐parametric independent Mann–Whitney U test was applied to analyse differences between groups. Spearman's rho was performed for correlations. In general, for the statistical analyses, a confidence interval of 95% was applied, and significant values p < 0.05 were marked *, and p < 0.01 were marked **.
4. RESULTS
4.1. Clinical information
In total, our cohort consisted of mixed glial primary cells derived from seven FCD2B patients and one TSC patient (neurobiobank Amsterdam UMC, location AMC). The control group consisted of primary cells derived from one FCD3D patient and three mMCD patients. Somatic mutation analysis was performed with all samples. In the TSC patient, a TSC2 mutation was identified (p.Arg611Trp). No mutations were identified in any of the FCD2B patients or in the control group. The FCD2B patient cohort had a median age at epilepsy onset of 12 months (interquartile range [IQR] 9–14), age at surgery was median 4 years (IQR 2–10), a median duration of epilepsy of 3 years (IQR 2–7) and a median seizure frequency of 5 per day (IQR 3–11.2). The control group displayed a median age of 60 months (IQR 24–96) at epilepsy onset and of 10 years (IQR 4.5–17) at surgery. Median duration of epilepsy at surgery was 4.5 years (IQR 1.8–11) and the median seizure frequency was 5 per day (IQR 4–9). Before surgery, 42.8% of FCD2B patients had a normal IQ, whereas 28.6% had mild cognitive impairment and in another 28.6%, there was severe impairment. The TSC patient showed mild cognitive impairment. In the control group, IQ was normal in 50% of patients, whereas 50% showed mild cognitive impairment (Table 1).
TABLE 1.
Clinical data of FCD2B [1, 2, 3, 4, 5, 6, 7], TSC [8] and control [9, 10, 11, 12], cases selected for this study
| Patient ID | Sex | Age at epilepsy onset (m) | Age at surgery (year) | Duration of epilepsy (year) | Seizure frequency (day) | IQ | Histopathology |
|---|---|---|---|---|---|---|---|
| 1 | M | 12 | 2 | 1 | several | 2 | FCD2B |
| 2 | M | 14 | 4 | 3 | 6 | 1 | FCD2B |
| 3 | M | 12 | 3 | 2 | 0.14 | 1 | FCD2B |
| 4 | M | 72 | 13 | 7 | 4 | 1 | FCD2B |
| 5 | F | 1 | 2 | 2 | 10 | 3 | FCD2B |
| 6 | F | 9 | 8 | 7 | 15 | 3 | FCD2B |
| 7 | M | 13 | 10 | 9 | 4 | 2 | FCD2B |
| 8 | F | 1 | 0.91 | 0.91 | 5 | 2 | TSC |
| 9 | M | 108 | 14 | 5 | 10 | 2 | FCD3B |
| 10 | M | 60 | 6 | 1 | 6 | 1 | mMCD |
| 11 | M | 60 | 18 | 13 | 4 | 2 | mMCD |
| 12 | M | 12 | 4 | 4 | 4 | 1 | mMCD |
Abbreviations: M, male; F, female; tsc, tuberous sclerosis complex gene; IQ, intelligence quotient (1 = normal, 2 = mild impairment, 3 = severe impairment).
4.2. More oligodendroglial precursor cells in FCD2B and TSC cultures
Figure 1A–E shows the results obtained in primary patient cells as well as HOG TSC2 knock‐out (HOG‐ko) and wild‐type (HOG‐wt) cells cultured under 2D‐culture standard conditions and in particular, show the cell morphology observed via light microscopy: HOG‐wt showed a flat and epithelioid‐like morphology that resembled primary mixed glial cell cultures from mMCD control patient cells (see Figure 1A,D). Interestingly, the soma size of HOG‐ko was significantly increased (34.1 ± 14.2; Mann–Whitney U test, **p = 0.0001)) compared to HOG‐wt (17.3 ± 4.7). Further, there was a significant change in soma size between control (29.8 ± 19.1), FCD2B (40.6 ± 20.8; *p = 0.02) and TSC (53.1 ± 18.5; **p = 0.0001) patient mixed glial cell cultures (Figure S3).
Primary mixed glial cells were grown on polycaprolactone nanofibres to promote the maturation of OPCs. By day 9, mature oligodendrocytes were generated, expressing CNPase, MBP and PLP in all cultures, and showing mature oligodendrocyte morphology (Figure 1F–J). Our control patient cultures (n = 4) contained more mature oligodendrocytes with 77.2% (±23.8) O4, 75.8% (±14.1) CNPase, 37.6% (±12.9) MBP and 46.45% (28.4) PLP and a lower number of NG2 progenitor cells (53.6% [±34.2]) (Figure 1K). The FCD2B nanofibre culture (n = 7) was composed of 69.3% (±30.9) NG2, 55% (±24.7) O4, 60.7% (±21.5) CNPase, 21.6% (±16.1) MBP and 20.8% (±15.1) PLP positive cells (Figure 1L). Similar observations were found in the TSC culture (n = 1) with 67% NG2, 48.5% O4, 19.3% CNPase, 26.3% MBP and 29% PLP (Figure 1M). Overall, only a small percentage of astrocytes (control 10.8% (±5.6), FCD2B 4% (±1.6) and TSC 8.4%) and no Map 2‐positive neurons were detected, highlighting the specificity of our protocol (Figure 1K–M). Our oligodendrocyte TSC2 knock‐out cell line showed similarities in cell culture composition (Figure 1N,O). The HOG‐wt culture contained 48.2% NG2, 58.4% O4, 76.8% CNPase, 35.7% MBP and 46.2% PLP (Figure 1N). In contrast, the HOG‐ko culture consisted of 73.8% NG2, 56.8% O4, 62.8% CNPase, 28.8% MBP and 26.1% PLP (Figure 1O). Noticeably, no GFAP‐positive astrocytes or Map 2‐neurons were found in our HOG culture. Further, mTOR‐pathway activation was seen in FCD2B, TSC and HOG‐ko nanofibre cultures (Figure 1P–R).
4.3. Limited maturation of OPCs in FCD2B and TSC cultures
The results of immunofluorescent labelling for CNPase, MBP and PLP to detect the myelin content are shown in Figure 2A. By applying anti‐CNPase antibody, control samples (n = 4) revealed a significantly higher integral optical density (IOD) compared to primary cells from FCD2B patients (Mann–Whitney U test, n = 7; *p = 0.006); furthermore, a TSC (n = 1) case also revealed less CNPase expression. The mean IOD reached levels of 327.1 ± 112 in FCD2B cells and 227.1 in the TSC culture. In controls, the observed mean IOD was 946.5 ± 337.5 (Figure 2B). A significant decrease in PLP mean IOD of FCD2B cells (321.3 ± 71) compared to the mean IOD of control cultures (726.2 ± 348.7) was revealed (*p = 0.04). The TSC patient culture showed less PLP expression (mean IOD 233.1) than controls (Figure 2C). Similar results were obtained using MBP immunolabelling (Figure 2D). Interestingly, the pre‐oligodendrocyte marker O4 was significantly elevated in controls in contrast to FCD2B patient cultures (Mann–Whitney U test, **p = 0.006). This analysis demonstrated that the mean IOD of controls was 881.7 ± 235.4 while the mean IOD of FCD2B was 408.2 ± 90 and of TSC 707.5 (Figure 2E). An overall decrease in markers of myelination in TSC and FCD2B compared to controls was observed. These findings are in line with results from HOG‐wt and HOG‐ko cells (Figure 3A). In HOG‐ko, a significant decrease in myelin content was observed via PLP staining (86.5 ± 37.5) compared to HOG‐wt (184.5 ± 91.7) (*p = 0.03) (Figure 3B). In addition, a lower MBP and CNPase content was observed in HOG‐ko (Figure 3C,D). Contrary to the results obtained in patient cultures, O4 expression was higher in HOG‐ko (Figure 3E).
Next, we aimed to clarify whether there is also a failure of oligodendroglial lineage turnover (Figure 4A,B). We found significantly elevated levels of NG2 expression in FCD2B (523.9 ± 183.7; *p = 0.04) and TSC (mean IOD 425.6) patient cultures in contrast to controls (289.3 ± 115.6) (Figure 4C). In the TSC model, NG2 expression was significantly increased in HOG‐ko (140.8 ± 77.8) compared to HOG‐wt (58.1 ± 23.8) (*p = 0.01) (Figure 4D). We detected protein levels of the oligodendroglial lineage markers in representative FCD2B, TSC and control samples using western blotting. Myelin content, observed via CNPase, MBP and PLP, was lower in FCD2B and TSC patients compared to controls. In line with our myelination assay results, we found higher NG2 expression in FCD2B and TSC patient tissue (Figure 4E).
Altogether, an elevated level of OPCs was found in FCD2B and TSC patient cultures as well as in the TSC2 knock‐out cell line suggesting that they exhibit depleted turnover in our nanofibre culture.
4.4. Myelin‐like segments observed in nanofibre culture via electron microscopy
Using electron microscopy, we found aberrant myelination in the white matter of a FCD2B patient (Figure 5A). The majority of the oligodendrocytes abnormally myelinated the nerve fibres, showing splitting or disruption of the myelin sheaths, also called onion bulb formation. Of the 93 nerve cells with myelin sheaths photographed, 59 had some form of alteration. Further, we were able to show that primary oligodendroglia derived from the surgery specimens of one FCD2B and one mMCD patient cultured on nanofibres concentrically wrapped the nanofibres to form myelin‐like segments (Figure 5B,C). It is essential to note that of the 30+ different nanofibres, myelin‐like segments were observed in both patient and control. However, the myelin‐like segments observed in FCD2B and control cultures were organised with solely a single wrap of concentric membrane around the nanofibres (Figure 5B and C, arrows).
FIGURE 5.

Ultrastructural findings in the white matter and nanofibre cell culture of patients with FCD2B. Representative ultrastructural image of the white matter of a FCD2B case (A). A morphologically normal‐shaped myelinated fibre (*). Conversely, the majority of myelinated fibres showed disruption or formation of onion bulb configuration of the myelin sheath (#). Representative electron micrographs of nanofibre grown mMCD (B, B) and FCD2B (C, C) patient primary cells illustrating ensheathment of polycaprolactone nanofibres (*). Arrows indicate concentric wrapping of membrane around a nanofibre. Scale bar (a, b, c) = 500 nm, (B, C) = 1 μm
4.5. Everolimus treatment repairs oligodendroglial lineage progression and myelin formation
One of the features of mTORpathies is a prominent and persistent activation of inflammatory pathways, one of cytokines that is particularly upregulated is the cytokine IL‐1β [37]. To further explore the capacity for myelination in an inflammatory environment, IL‐1β was added to the nanofibre cultures followed by mTOR inhibitor everolimus treatment (Figure 6A).
Screening for NG2 precursor cells in the TSC nanofibre culture revealed a higher level of NG2 before (378.3) and after everolimus treatment (942.7) compared to controls. The TSC HOG model revealed a significant increase in NG2 expression after everolimus treatment (Mann–Whitney U test; mean IOD NG2 84.5 ± 25.3; 175.7 ± 79.3; *p = 0.01) in contrast to knock‐out cells that were grown in medium containing IL‐1β (Figure S4A, B). As opposed to patient cultures, O4 was significantly increased after everolimus treatment in HOG‐wt and HOG‐ko (WT: *p = 0.03; KO: *p = 0.04) when compared to HOG‐wt and HOG‐ko IL‐1β cultures. In HOG‐wt, an O4 IOD of 95.1 ± 48.5 was measured when applying the IL‐1β assay protocol and after treatment with everolimus the O4 IOD was 174.3 ± 64.8. Also, in HOG‐ko, a low IOD of O4 was observed when growing in an inflammatory environment, which was reversed by everolimus treatment (Figure S4C, D). A significant increase in myelination capacity, as judged by CNPase staining, was observed in FCD2B cells after everolimus treatment (*p = 0.001). FCD2B primary patient cells grown in inflammatory media showed a mean IOD of 268.7 ± 116.8 and after everolimus treatment the mean IOD of CNPase was 621.6 ± 200.3. Further, analysis of the TSC patient culture showed a rescue of CNPase expression after everolimus treatment of the IL‐1β culture (Figure 6B). Everolimus treatment led to a significant increase of CNPase expression in HOG‐wt culture (*p = 0.009). CNPase expression in the HOG‐wt culture before everolimus treatment was 112.8 ± 25.3 and after, 197.5 ± 42.7 (Figure 6C). Significant increases of PLP were found after everolimus treatment of HOG‐ko grown in an inflammatory environment (*p = 0.02) (before treatment: mean PLP IOD 75.95 ± 32.1; after treatment 159.5 ± 63.2) (Figure 6D). These results were confirmed in the TSC patient culture (Figure S4E). Additionally, MBP expression was significantly increased in everolimus treated (173.7 ± 34.5) compared to untreated (57.5 ± 13.3) (*p = 0.01) HOG‐ko (Figure 6E). As the myelination capacity in an inflammatory environment seemed to be repaired via everolimus treatment, we were further interested to determine if mTOR pathway dysregulation has a direct influence on proliferative activity.
4.6. Altered proliferative activity in TSC and FCD2B patient cells
The results of proliferative capacity determined via Alamar Blue assay with primary mixed glial cell cultures of FCD2B (n = 4), TSC (n = 1) and control samples (n = 3), as well as with HOG‐wt and HOG‐ko cells are shown in Figures 7A,B: under standard conditions, proliferative activity was significantly increased in FCD2B cultures (43.1% viability ± 8.8) when compared to control (22.7% viability ± 6.2) (*p = 0.0001) (Figure 7A). This phenomenon was still present in an inflammatory environment (*p = 0.0001) (Figure 7A). The viability was 22.9% (±6.7) in controls and 42.4 (±10.3) in FCD2B samples. Remarkably, everolimus treatment of FCD2B cells grown in medium containing IL‐1β, led to a significantly (*p = 0.0001) lower proliferative activity (26.5% ± 7.1) (Figure 7A).
FIGURE 7.

Increased proliferative activity in FCD2B patient‐derived primary mixed glial cells and HOG TSC2 knock‐out cells normalised after everolimus treatment. FCD2B and control primary mixed glial cells were grown for 5 days under standard conditions, treated with 30 ng/ml IL‐1β and 30 ng/ml IL‐1β + 20 nM everolimus and cell proliferation was determined by the Alamar Blue assay. Experiments were performed in sextuplicate. Patients included in this experiment: control (n = 3), FCD2B (n = 4) and TSC (n = 1). Error bars represent standard deviations of these measurements (A). HOG TSC2 wild‐type and knock‐out cells were grown for 5 days under standard conditions, treated with 30 ng/ml IL‐1β and 30 ng/ml IL‐1β + 20 nM everolimus and cell viability was determined by the Alamar Blue assay. Experiments were performed in sextuplicate of the HOG TSC2 wild‐type and knock‐out cell line. Error bars represent standard deviations of these measurements (B). Abbreviations: IL‐1β, interleukin‐1 beta; EV, everolimus
HOG‐wt cells showed significantly less proliferation in the IL‐1β assay (16.6 ± 14.4) compared to wild‐type cells grown under standard conditions (28.6 ± 4.9) (*p = 0.002) (Figure 7B). Identical results were found with the HOG‐ko cells, illustrating a significant decline in viability after IL‐1β treatment (14% ± 6.9) in contrast to standard conditions (32.8% ± 13.7) (*p = 0.0001) (Figure 7B). Noticeably, the proliferative activity was restored after everolimus treatment of HOG‐ko (22.5 ± 7.4) (*p = 0.002) (Figure 7B). These results indicate a direct influence of a mTOR pathway dysregulation on the proliferative activity in cell culture, which was reversed by everolimus treatment.
4.7. Decreased myelin content in patient nanofibre cultures correlates to an early onset and long duration of epilepsy
Further analysis of the observed myelin pathology and clinical data (Table 1), such as cognitive impairment, seizure frequency and age at epilepsy surgery failed to detect significant group differences. A correlation between lower PLP expression and an early onset of epilepsy was observed (Spearman's rho; p = 0.7). A long history of epilepsy and the status of myelination in patients may have directly influenced the status of myelination in our patient cohort. However, there might be co‐variance between the two variables.
5. DISCUSSION
We were able to show, for the first time, that in TSC and FCD2B patient nanofibre cell cultures, there is impaired development of OPCs into differentiated myelinating oligodendrocytes, as result of constitutive mTOR pathway activation. Interestingly, everolimus treatment repaired myelin formation in our patient 3D‐nanofibre cultures. These findings were confirmed in a genetically modified TSC2 knock‐out HOG cell line. Our study therefore provides evidence for the influence of mTOR activation on myelin dynamics in FCD and TSC patient cell cultures.
As a variety of germline, as well as somatic mutations, have been found in mTORpathies, we sequenced the lesional white matter of our patient cohort using a diagnostic TSC and FCD panel. However, we only found a mutation in the TSC patient. Still, FCD2B patients may carry low frequent mutations, which could only be detected using whole‐exome/genome sequencing or cortical tissue.
Previous studies investigating the underlying mechanism of epilepsy have reported the white matter to be affected in certain patients with epilepsy and autism, as well as in several epilepsy animal models, indicating a link between myelin abnormalities and epilepsy and its co‐morbidities [17, 18, 38, 39]. Further, cellular hypertrophy has been reported in resections of TSC patients, as well as TSC rodent models [40, 41]. Using a TSC patient iPSC‐based neuron‐oligodendrocyte co‐culture system, an interaction between neurons and oligodendrocytes leading to cellular hypertrophy was observed [42].
In this study, we provide additional support for the direct effect of TSC2 knock‐out on the known hypertrophic phenotype shown in TSC patient culture [42, 43]. However, our experiments also highlight that cellular hypertrophy is solely dependent on the TSC2 mutation in oligodendrocytes and independent of neuronal abnormalities, indicating that interactions between these cells may not be essential for the development of a TSC‐associated phenotype.
As the mTOR pathway has emerged as a key player in oligodendrocyte differentiation and myelination, recent studies have investigated the link between depleted myelin and mTORpathies in epilepsy surgery specimens [5, 17, 44, 45]. In a previous study, we observed significantly reduced myelin capacity in FCD2B as well as in TSC patients that correlated with a reduced number of OPCs [17]. However, an increased number of oligodendroglia compared to controls and by this a link between white matter pathology and duration of epilepsy was shown in patients with temporal lobe epilepsy and mMCD [46]. Further, differentiation of OPCs and myelin sheath formation was found to be compromised in the dysplastic cortex of FCD2A patients [33]. Rodent models have examined the causal relationship between abnormal mTOR signalling and accurate myelin formation, yet the cell autonomous effects of mTOR pathway mutations, for example, TSC ablation in oligodendrocytes, still remain questionable [32, 41].
In the present study, we were able to show impaired myelination in TSC and FCD2B primary cells as well as in a TSC2 knock‐out cell line, indicating a direct influence of mTOR pathway activation on oligodendrocytes. We identified higher proliferation of NG2 glia in primary cell cultures of epilepsy surgery specimens. Thus, our results highlight lower amounts of mature oligodendroglia in epilepsy specimens, supporting previous histopathological findings [17, 18, 33]. Based on our results, we suggest that oligodendroglial lineage progression, and the consequent impaired maturation and myelination, may be due to oligodendrocyte autonomous effects of constitutive mTOR pathway activation.
Further, persistent and complex activation of inflammatory pathways in both cortical tubers and FCD lesions was demonstrated by others [47]. Experimental research has reported a role for proinflammatory cytokines, such as interleukin‐1β, in epileptogenesis and maintenance of seizures [48, 49]. The latest evidence supports the hypothesis that hypomyelination could be reversed by treatment with the mTOR inhibitor everolimus [50, 51]. In our study, we applied an inflammatory environment to our 3D‐nanofibre cell culture model and observed the capacity of oligodendroglia after everolimus treatment. We show that everolimus may be able to repair hypomyelination in mTORpathy patients, which was further supported by findings from HOG‐ko cells.
A recent study showed that neurons and astrocytes differentiated from primitive neural stem cells had higher proliferative activity compared to control [43]. This is in good agreement with results from another study reporting significantly increased proliferation of TSC patient induced pluripotent stem cell (iPSC)‐derived oligodendrocytes when co‐cultured with TSC patient iPSC‐derived neurons [42]. In this study, we observed significantly increased proliferation in a neuron‐free culture of FCD2B patient cells compared to control cultures that was normalised after everolimus treatment.
Our work has some limitations: the small sample size, which was due to the fact that TSC and FCD2B are orphan diseases and that this study included patient‐derived primary cells instead of animal models (by this being dependent on epilepsy surgery specimen). Nevertheless, using patient primary cells has the advantage of visualising human pathology.
Although induction of myelinating oligodendrocytes has been demonstrated in cortical spheroid models, this was not part of our study protocol. The main reason for this decision was the known limited ability to study complex post‐natal myelin pathology in organoids due to their resemblance to the early stages of the human cerebral formation [52].
Our results not only confirm previous neuropathological findings that proper myelin formation is impaired due to a constitutive over‐activation of the mTOR pathway [17], but—for the first time—that there is impaired development of OPCs into differentiated myelinating oligodendrocytes in TSC and FCD2B primary patient nanofibre cell cultures.
CONFLICT OF INTERESTS
None of the authors has any conflict of interests to disclose.
AUTHOR CONTRIBUTIONS
VG, TS and AM drafted the content of this paper and the performed the analysis of the data. MF conceived the study and participated in its design and coordination. VG wrote the manuscript. VG, JL, VE, RR, NW, PL and ML performed experiments. VG, RD, BP, SG, JA, AB and KR contributed to the collection and selection of tissue samples and/or clinical data. JH, EA and MF assisted in the final editing of the paper. All authors contributed to the article and approved the submitted version.
ETHICS STATEMENT
The study was performed according to the guidelines of good laboratory practice of the European Commission and the local ethics committee of the Medical University of Vienna gave a positive vote for the study plan (EK Nr.978/2009).
6.
6.1. PEER REVIEW
The peer review history for this article is available at https://publons.com/publon/10.1111/nan.12744.
Supporting information
Figure S1: Confirmation of TSC2 knock‐out via western blot. Western blot presenting labelled TSC2 of TSC2 knock‐out cells and wild‐type control.
Figure S2: Illustration of the experimental timeline of the myelination assay protocols applying 3D‐nanofibre matrices.
Figure S3: Significant changes in cell soma size. Soma area was quantified using representative images of control, FCD2B, TSC, HOG TSC2 wild‐type and knock‐out cells. Bars represent measurements of quantification of control (n = 1), FCD2B (n = 1) and TSC (n = 1) patient primary mixed glial cultures as well as HOG TSC2 wild‐type and knock‐out cells. Mann–Whitney U‐test was applied for statistical analysis with **p < 0.01 and ** p < 0.001 (A). 2D‐cell culture of mMCD control (a), FCD2B (b), TSC (c), HOG TSC2 wild‐type (d) and HOG TSC2 knock‐out cells (e) (light microscopy). Scale bar = 6 μm (B).
Figure S4: Everolimus treatment of cells grown in an inflammatory environment. The integral optical density (IOD) of NG2 (A and B), O4 (C and D), PLP (E) and MBP (F) expression observed in treated patient and cell line nanofibre cultures. Bars represent patient (control (n = 4), FCD2B (n = 6) and TSC (n = 1) median of quantification. Bars of the integral optical density (IOD) of NG2 (B) and O4 (D) expression observed in treated TSC2 wild‐type and knock‐out nanofibre cultures represent single data of quantification of HOG TSC2 wild‐type and knock‐out cells. Mann–Whitney U‐test was applied for statistical analysis with **p < 0.01 and ** p < 0.001. Abbreviations: IL‐1β, Interleukin‐1 beta; EV, everolimus.
Data S1. Supporting information
ACKNOWLEDGEMENTS
This study is funded by a grant of the Austrian Epilepsy Society dedicated to Dr Feucht. The research leading to these results has received funding from the European Union's Seventh Framework Programme (FP7/2007‐2013) under grant agreement no. 602391 (EPISTOP; EA, MF, AM, TS), the Dutch Epilepsy Foundation, project number 2020‐02 (AM, ML), the ZonMw, Programme Translational Research no. 95105004 (EA) and by the German Tuberous Sclerosis Association – TSD e. V, (TS, VG).
Gruber V‐E, Lang J, Endmayr V, et al. Impaired myelin production due to an intrinsic failure of oligodendrocytes in mTORpathies. Neuropathol Appl Neurobiol. 2021;47:812-825. 10.1111/nan.12744
[Correction added on 26 August 2021, after first online publication: Peer review history statement has been added.]
Funding information Austrian Epilepsy Society; Dutch Epilepsy Foundation (2020‐02); European Union’s Seventh Framework Programme (EPISTOP/602391); German Tuberous Sclerosis Association; ZonMw, Programme Translational Research (95105004)
Contributor Information
Theresa Scholl, Email: theresa.scholl@meduniwien.ac.at.
Angelika Mühlebner, Email: a.muhlebner@umcutrecht.nl.
DATA AVAILABILITY STATEMENT
The data that support the findings of this study are available from the first author upon reasonable request.
REFERENCES
- 1. Simons M, Nave K‐A. Oligodendrocytes: myelination and axonal support. Cold Spring Harb Perspect Biol. June 2015;8(1):a020479. [DOI] [PMC free article] [PubMed] [Google Scholar]
- 2. Philips T, Rothstein JD. Oligodendroglia: Metabolic supporters of neurons. Am Soc Clin Invest. 2017;127(9):3271‐3280. [DOI] [PMC free article] [PubMed] [Google Scholar]
- 3. Bedner P, Jabs R, Steinhäuser C. Properties of human astrocytes and NG2 glia. Glia. 2020;68(4):756‐767. [DOI] [PubMed] [Google Scholar]
- 4. Gaesser JM, Fyffe‐Maricich SL. Intracellular signaling pathway regulation of myelination and remyelination in the CNS. Exp Neurol. 2016. [DOI] [PMC free article] [PubMed] [Google Scholar]
- 5. Ishii A, Furusho M, Macklin W, Bansal R. Independent and cooperative roles of the Mek/ERK1/2‐MAPK and PI3K/Akt/mTOR pathways during developmental myelination and in adulthood. Glia. 2019;67(7):1277‐1295. [DOI] [PMC free article] [PubMed] [Google Scholar]
- 6. Musah AS, Brown TL, Jeffries MA, Shang Q, Hashimoto H, Evangelou A. Mechanistic target of rapamycin regulates the oligodendrocyte cytoskeleton during myelination. J Neurosci Off J Soc Neurosci. 2020. [DOI] [PMC free article] [PubMed] [Google Scholar]
- 7. Crino PB. mTOR signaling in epilepsy: Insights from malformations of cortical development. Cold Spring Harb Perspect Med. 2015;5(4):1‐17. [DOI] [PMC free article] [PubMed] [Google Scholar]
- 8. Wong M, Crino PB. MTOR and epileptogenesis in developmental brain malformations. Epilepsia. 2010;51:72. [PubMed] [Google Scholar]
- 9. Jones AC, Shyamsundar MM, Thomas MW, et al. Comprehensive mutation analysis of TSC1 and TSC2‐and phenotypic correlations in 150 families with tuberous sclerosis. Am J Hum Genet. May 1999;64(5):1305‐1315. [DOI] [PMC free article] [PubMed] [Google Scholar]
- 10. Osborne JP, Fryer A, Webb D. Epidemiology of tuberous sclerosis. Ann N Y Acad Sci. 1991;615(1):125‐127. [DOI] [PubMed] [Google Scholar]
- 11. Muhlebner A, van Scheppingen J, Hulshof HM, Scholl T, Iyer AM, Anink JJ. Novel histopathological patterns in cortical tubers of epilepsy surgery patients with tuberous sclerosis complex. PloS One. 2016;11(6). [DOI] [PMC free article] [PubMed] [Google Scholar]
- 12. Mizuguchi M, Takashima S. Neuropathology of tuberous sclerosis. Brain Dev. 2001;23(7):508‐515. [DOI] [PubMed] [Google Scholar]
- 13. Blumcke I, Thom M, Aronica E, Armstrong DD, Vinters H, Palmini A. The clinicopathologic spectrum of focal cortical dysplasias: a consensus classification proposed by an ad hoc Task Force of the ILAE Diagnostic Methods Commission. Epilepsia. January 2011;52(1):158‐174. [DOI] [PMC free article] [PubMed] [Google Scholar]
- 14. Fields RD. White matter in learning, cognition and psychiatric disorders. Trends in neurosciences [Internet]. 2008. https://pubmed.ncbi.nlm.nih.gov/18538868 [DOI] [PMC free article] [PubMed]
- 15. Baumer FM, Song JW, Mitchell PD, et al. Longitudinal changes in diffusion properties in white matter pathways of children with tuberous sclerosis complex. Pediatr Neurol. June 2015;52(6):615‐623. [DOI] [PMC free article] [PubMed] [Google Scholar]
- 16. Urbach H, Scheffler B, Heinrichsmeier T, et al. Focal cortical dysplasia of Taylor's balloon cell type: A clinicopathological entity with characteristic neuroimaging and histopathological features, and favorable postsurgical outcome. Epilepsia. 2002;43(1):33‐40. [DOI] [PubMed] [Google Scholar]
- 17. Scholl T, Mühlebner A, Ricken G, et al. Impaired oligodendroglial turnover is associated with myelin pathology in focal cortical dysplasia and tuberous sclerosis complex. Brain Pathol. 2017;27(6):770‐780. [DOI] [PMC free article] [PubMed] [Google Scholar]
- 18. Mühlebner A, van Scheppingen J, de Neef A, et al. Myelin pathology beyond white matter in tuberous sclerosis complex (TSC) cortical tubers. J Neuropathol Exp Neurol. 2020;79(10):1054‐1064. [DOI] [PMC free article] [PubMed] [Google Scholar]
- 19. Moavero R, Benvenuto A, Emberti Gialloreti L, et al. Early clinical predictors of autism spectrum disorder in infants with tuberous sclerosis complex: results from the EPISTOP study. J Clin Med. 2019;8(6):788. [DOI] [PMC free article] [PubMed] [Google Scholar]
- 20. Casanova MF, El‐Baz AS, Kamat SS, et al. Focal cortical dysplasias in autism spectrum disorders. Acta Neuropathol Commun. January 2014;27:2(1). [DOI] [PMC free article] [PubMed] [Google Scholar]
- 21. Kimura N, Takahashi Y, Shigematsu H, et al. Risk factors of cognitive impairment in pediatric epilepsy patients with focal cortical dysplasia. Brain Dev [Internet]. 2019;41(1):77‐84. https://www.sciencedirect.com/science/article/pii/S0387760418303450 [DOI] [PubMed] [Google Scholar]
- 22. Woolfenden S, Sarkozy V, Ridley G, Coory M, Williams K. A systematic review of two outcomes in autism spectrum disorder ‐ epilepsy and mortality. Dev Med Child Neurol. 2012. Apr;54(4):306‐312. [DOI] [PubMed] [Google Scholar]
- 23. Jokiranta E, Sourander A, Suominen A, Timonen‐Soivio L, Brown AS, Sillanpää M. Epilepsy among children and adolescents with autism spectrum disorders: a population‐based study. J Autism Dev Disord. October 2014;44(10):2547‐2557. [DOI] [PubMed] [Google Scholar]
- 24. Dimond D, Schuetze M, Smith RE, et al. Reduced white matter fiber density in autism spectrum disorder. Cerebral Cortex [Internet]. 2019;29(4):1778‐1788. 10.1093/cercor/bhy348 [DOI] [PMC free article] [PubMed] [Google Scholar]
- 25. Lee BH, Smith T, Paciorkowski AR. Autism spectrum disorder and epilepsy: Disorders with a shared biology. Epilepsy & behavior: E&B [Internet]. 2015. https://pubmed.ncbi.nlm.nih.gov/25900226 [DOI] [PMC free article] [PubMed]
- 26. Galvez‐Contreras AY, Zarate‐Lopez D, Torres‐Chavez AL, Gonzalez‐Perez O. Role of oligodendrocytes and myelin in the pathophysiology of autism spectrum disorder. MDPI Ag. 2020;1‐17. [DOI] [PMC free article] [PubMed] [Google Scholar]
- 27. Rodríguez‐Cruces R, Concha L. White matter in temporal lobe epilepsy: clinico‐pathological correlates of water diffusion abnormalities. Quant Imaging Med Surg. 2015;5(2):264‐278. https://pubmed.ncbi.nlm.nih.gov/25853084 [DOI] [PMC free article] [PubMed] [Google Scholar]
- 28. Mathon B, Bordes A, Amelot A, Carpentier A, Méré M, Dupont S, et al. Evaluation of psychomotor functions in patients with drug‐resistant epilepsy. Epilepsy & Behavior [Internet]. 2020. http://www.sciencedirect.com/science/article/pii/S1525505020301608 [DOI] [PubMed]
- 29. Strzelczyk A, Klein KM, von Podewils F. Editorial: Burden of Illness in People With Epilepsy: From Population‐Based Studies to Precision Medicine. Front Neurol. 2018;1164. [DOI] [PMC free article] [PubMed] [Google Scholar]
- 30. Wiebe S. Burden of intractable epilepsy. Adv Neurol. 2006;97:1‐4. [PubMed] [Google Scholar]
- 31. de Vries PJ, Belousova E, Benedik MP, et al. TSC‐associated neuropsychiatric disorders (TAND): findings from the TOSCA natural history study. Orphanet J Rare Dis. 2018;13(1):157. [DOI] [PMC free article] [PubMed] [Google Scholar]
- 32. Lebrun‐Julien F, Bachmann L, Norrmen C, et al. Balanced mTORC1 activity in oligodendrocytes is required for accurate CNS myelination. J Neurosci [Internet]. 2014;34(25):8432‐8448. [DOI] [PMC free article] [PubMed] [Google Scholar]
- 33. Donkels C, Peters M, Fariña Núñez MT, et al. Oligodendrocyte lineage and myelination are compromised in the gray matter of focal cortical dysplasia type IIa. Epilepsia. 2020;61(1):171‐184. [DOI] [PubMed] [Google Scholar]
- 34. Friede RL. Control of myelin formation by axon caliber (with a model of the control mechanism). J Comp Neurol. 1972. Feb;144(2):233‐252. [DOI] [PubMed] [Google Scholar]
- 35. Lee S, Leach MK, Redmond SA, et al. A culture system to study oligodendrocyte myelination processes using engineered nanofibers. Nat Methods. September 2012;9(9):917‐922. [DOI] [PMC free article] [PubMed] [Google Scholar]
- 36. Mecha M, Iñigo PM, Mestre L, Hernangómez M, Borrell J, Guaza C. An easy and fast way to obtain a high number of glial cells from rat cerebral tissue: A beginners approach. Nature Protocol Exchange [Internet]. 2011; 10.1038/protex.2011.218 [DOI]
- 37. Boer K, Jansen F, Nellist M, et al. Inflammatory processes in cortical tubers and subependymal giant cell tumors of tuberous sclerosis complex. Epilepsy Res. January 2008;78(1):7‐21. [DOI] [PubMed] [Google Scholar]
- 38. Wolff JJ, Gu H, Gerig G, et al. Differences in white matter fiber tract development present from 6 to 24 months in infants with autism. Am J Psychiatry. June 2012;169(6):589‐600. [DOI] [PMC free article] [PubMed] [Google Scholar]
- 39. You Y, Bai H, Wang C, et al. Myelin damage of hippocampus and cerebral cortex in rat pentylenetetrazol model. Brain Res. March 2011;1381:208‐216. [DOI] [PubMed] [Google Scholar]
- 40. Ruppe V, Dilsiz P, Reiss CS, et al. Developmental brain abnormalities in tuberous sclerosis complex: a comparative tissue analysis of cortical tubers and perituberal cortex. Epilepsia. April 2014;55(4):539‐550. [DOI] [PubMed] [Google Scholar]
- 41. Meikle L, Talos DM, Onda H, et al. A mouse model of tuberous sclerosis: neuronal loss of Tsc1 causes dysplastic and ectopic neurons, reduced myelination, seizure activity, and limited survival. J Neurosci Off J Soc Neurosci. May 2007;27(21):5546‐5558. [DOI] [PMC free article] [PubMed] [Google Scholar]
- 42. Nadadhur AG, Alsaqati M, Gasparotto L, et al. Neuron‐glia interactions increase neuronal phenotypes in tuberous sclerosis complex patient iPSC‐derived models. Stem Cell Reports. January 2019;12(1):42‐56. [DOI] [PMC free article] [PubMed] [Google Scholar]
- 43. Li Y, Cao J, Chen M, et al. Abnormal neural progenitor cells differentiated from induced pluripotent stem cells partially mimicked development of TSC2 neurological abnormalities. Stem Cell Reports. April 2017;8(4):883‐893. [DOI] [PMC free article] [PubMed] [Google Scholar]
- 44. Schurr J, Coras R, Rossler K, Pieper T, Kudernatsch M, Holthausen H, et al. Mild malformation of cortical development with oligodendroglial hyperplasia in frontal lobe epilepsy: a new clinico‐pathological entity. Brain pathology (Zurich, Switzerland). 2017. [DOI] [PMC free article] [PubMed]
- 45. Mühlebner A, Coras R, Kobow K, et al. Neuropathologic measurements in focal cortical dysplasias: validation of the ILAE 2011 classification system and diagnostic implications for MRI. Acta Neuropathol. 2012;123(2):259‐272. [DOI] [PubMed] [Google Scholar]
- 46. Shepherd C, Liu J, Goc J, et al. A quantitative study of white matter hypomyelination and oligodendroglial maturation in focal cortical dysplasia type II. Epilepsia. May 2013;54(5):898‐908. [DOI] [PMC free article] [PubMed] [Google Scholar]
- 47. Ravizza T, Boer K, Redeker S, et al. The IL‐1β system in epilepsy‐associated malformations of cortical development. Neurobiol Dis. 2006;24(1):128‐143. [DOI] [PubMed] [Google Scholar]
- 48. Aronica E, Bauer S, Bozzi Y, et al. Neuroinflammatory targets and treatments for epilepsy validated in experimental models. Epilepsia. 2017;27‐38. [DOI] [PMC free article] [PubMed] [Google Scholar]
- 49. Vezzani A, French J, Bartfai T, Baram TZ. The role of inflammation in epilepsy. Nat Rev Neurol. 2011;7(1):31‐40. [DOI] [PMC free article] [PubMed] [Google Scholar]
- 50. Peters JM, Prohl A, Kapur K, et al. Longitudinal effects of everolimus on white matter diffusion in tuberous sclerosis complex. Pediatr Neurol. 2019;90:24‐30. [DOI] [PMC free article] [PubMed] [Google Scholar]
- 51. Zeng L‐H, Xu L, Gutmann DH, Wong M. Rapamycin prevents epilepsy in a mouse model of tuberous sclerosis complex. Ann Neurol. 2008;63(4):444‐453. [DOI] [PMC free article] [PubMed] [Google Scholar]
- 52. Madhavan M, Nevin ZS, Shick HE, et al. Induction of myelinating oligodendrocytes in human cortical spheroids. Nature Methods [Internet]. 2018;15(9):700‐706. 10.1038/s41592-018-0081-4 [DOI] [PMC free article] [PubMed] [Google Scholar]
Associated Data
This section collects any data citations, data availability statements, or supplementary materials included in this article.
Supplementary Materials
Figure S1: Confirmation of TSC2 knock‐out via western blot. Western blot presenting labelled TSC2 of TSC2 knock‐out cells and wild‐type control.
Figure S2: Illustration of the experimental timeline of the myelination assay protocols applying 3D‐nanofibre matrices.
Figure S3: Significant changes in cell soma size. Soma area was quantified using representative images of control, FCD2B, TSC, HOG TSC2 wild‐type and knock‐out cells. Bars represent measurements of quantification of control (n = 1), FCD2B (n = 1) and TSC (n = 1) patient primary mixed glial cultures as well as HOG TSC2 wild‐type and knock‐out cells. Mann–Whitney U‐test was applied for statistical analysis with **p < 0.01 and ** p < 0.001 (A). 2D‐cell culture of mMCD control (a), FCD2B (b), TSC (c), HOG TSC2 wild‐type (d) and HOG TSC2 knock‐out cells (e) (light microscopy). Scale bar = 6 μm (B).
Figure S4: Everolimus treatment of cells grown in an inflammatory environment. The integral optical density (IOD) of NG2 (A and B), O4 (C and D), PLP (E) and MBP (F) expression observed in treated patient and cell line nanofibre cultures. Bars represent patient (control (n = 4), FCD2B (n = 6) and TSC (n = 1) median of quantification. Bars of the integral optical density (IOD) of NG2 (B) and O4 (D) expression observed in treated TSC2 wild‐type and knock‐out nanofibre cultures represent single data of quantification of HOG TSC2 wild‐type and knock‐out cells. Mann–Whitney U‐test was applied for statistical analysis with **p < 0.01 and ** p < 0.001. Abbreviations: IL‐1β, Interleukin‐1 beta; EV, everolimus.
Data S1. Supporting information
Data Availability Statement
The data that support the findings of this study are available from the first author upon reasonable request.