

Abstract
Ethylmalonic acid (EMA) is a major and potentially cytotoxic metabolite associated with short‐chain acyl‐CoA dehydrogenase (SCAD) deficiency, a condition whose status as a disease is uncertain. Unexplained high EMA is observed in some individuals with complex neurological symptoms, who carry the SCAD gene (ACADS) variants, c.625G>A and c.511C>T. The variants have a high allele frequency in the general population, but are significantly overrepresented in individuals with elevated EMA. This has led to the idea that these variants need to be associated with variants in other genes to cause hyperexcretion of ethylmalonic acid and possibly a diseased state. Ethylmalonyl‐CoA decarboxylase (ECHDC1) has been described and characterized as an EMA metabolite repair enzyme, however, its clinical relevance has never been investigated. In this study, we sequenced the ECHDC1 gene (ECHDC1) in 82 individuals, who were reported with unexplained high EMA levels due to the presence of the common ACADS variants only. Three individuals with ACADS c.625G>A variants were found to be heterozygous for ECHDC1 loss‐of‐function variants. Knockdown experiments of ECHDC1, in healthy human cells with different ACADS c.625G>A genotypes, showed that ECHDC1 haploinsufficiency and homozygosity for the ACADS c.625G>A variant had a synergistic effect on cellular EMA excretion. This study reports the first cases of ECHDC1 gene defects in humans and suggests that ECHDC1 may be involved in elevated EMA excretion in only a small group of individuals with the common ACADS variants. However, a direct link between ECHDC1/ACADS deficiency, EMA and disease could not be proven.
Keywords: digenic inheritance, ethylmalonic aciduria (EMA), ethylmalonyl‐CoA decarboxylase (ECHDC1), short‐chain acyl‐CoA dehydrogenase (SCAD), synergistic heterozygosity
1. INTRODUCTION
Increased urinary excretion of ethylmalonic acid (EMA) is a biochemical marker for disturbances in the activity of short‐chain acyl‐CoA dehydrogenase (SCAD) [EC 1.3.8.1], an enzyme catalysing the oxidation of short‐chain fatty acids. Primary defects in ACADS [MIM: 606885], encoding SCAD, have been associated with SCAD deficiency (SCADD [MIM: 201470]), a condition with uncertain status as a disease. 1 , 2 Secondary disturbances of SCAD function and elevated EMA levels are also seen in ethylmalonic encephalopathy (EE [MIM: 602473]), caused by defects in ETHE1 [MIM: 608451] 3 and in multiple acyl‐CoA dehydrogenation deficiency (MADD [MIM: 231680]), where SCADD is caused by genetic defects in the electron transfer flavoproteins (ETF or ETFDH), 4 or by genetic defects in flavin synthesis or transport. 5 , 6 , 7 , 8 , 9
When SCAD is impaired, its substrate, butyryl‐CoA, accumulates in mitochondria and is partly exported to the cytosol. Various low‐affinity enzymes metabolise butyryl‐CoA: carnitine O‐acetyltransferase [EC 2.3.1.137] converts butyryl‐CoA into butyryl‐carnitine, propionyl‐CoA carboxylase [EC 6.4.1.3] (mitochondria) and acetyl‐CoA carboxylase [EC 6.4.1.2] (cytosol) convert butyryl‐CoA into ethylmalonyl‐CoA, which is then metabolised into EMA by acyl‐CoA hydrolase [EC 3.1.2.20].
Studies on rat brain tissues and human skeletal muscle cells have shown that EMA may induce mitochondrial dysfunction with inhibition of the electron transport chain, oxidative stress and energy deficiency, 10 , 11 , 12 , 13 , 14 whereby it may contribute to the neuromuscular phenotype that characterize individuals with elevated levels of EMA.
SCADD is a recessive condition and various rare ACADS variants associated with high EMA levels (>20 mmol/mol creatinine) have been identified. In addition, two common ACADS variants, c.625G>A;p.Gly209Ser (dbSNP: rs1799958) and c.511C>T;p.Arg171Trp (dbSNP: rs1800556), have been associated with SCADD. The two variants, which impair SCAD folding and stability, have a minor allele frequency of 26% and 3% in the healthy population, respectively (Genome Aggregation Database—gnomAD, https://www.biorxiv.org/content/10.1101/531210v3), but are more common in SCADD individuals with minor allele frequencies of 75% and 8%, respectively. 15 , 16 It is still not fully understood why some individuals with biallelic common ACADS variants or one common variant in trans with a rare ACADS variant are healthy, while others develop symptoms with high EMA levels. These issues have raised the question whether ACADS variants need to be combined with other variant genes to cause EMA and possibly disease.
In 2011, Linster et al described a novel player in the regulation of EMA levels, ethylmalonyl‐CoA decarboxylase (ECHDC1) [EC 4.1.1.94]. ECHDC1 is a metabolite repair enzyme, whose primary function is to decarboxylate ethylmalonyl‐CoA, the intermediate in the formation of EMA. 17 ECHDC1 was also shown to prevent the formation of methyl‐ and ethyl‐branched fatty acids. 18 Due to its role in decreasing EMA formation, partial deficiency in ECHDC1 could potentially synergize with SCAD variants to cause EMA aciduria.
In the present work, we investigated the role of ECHDC1 as a genetic factor for elevated EMA excretion in 82 unrelated SCADD individuals 1 with unexplained high EMA levels and bearing the common ACADS variants only. The additive effect of combined ECHDC1 and ACADS deficiency on EMA formation was further analysed through in vitro studies.
2. MATERIAL AND METHODS
2.1. Study design
The 82 samples included in this study were from symptomatic individuals with symptoms leading to suspicion of SCAD deficiency and with elevated urinary EMA (20‐498 mmol/mol creatinine), who were referred to Research Unit for Molecular Medicine, Aarhus University Hospital, Aarhus, Denmark, for genetic evaluation of SCADD in the years 1992 to 2008. The ACADS gene was sequenced as described below and the findings reported to the referring clinical/metabolic department as contribution to the diagnostic work‐up of the individuals. The 82 individuals were classified as having unexplained high EMA levels due to the presence of ACADS susceptibility variants alone or an ACADS susceptibility variant in trans with a rare ACADS variant. The samples selected for DNA analysis came from three groups of individuals: A) wild‐type or heterozygous for ACADS c.625G>A, urinary EMA >20 mmol/mol creatinine (26 individuals); B) homozygous for ACADS c.625G>A or compound heterozygous with ACADS c.625G>A on one allele and ACADS c.511C>T on the other allele, EMA excretion >40 mmol/mol creatinine (48 individuals); C) compound heterozygous with a rare ACADS variant on one allele and ACADS c.625G>A on the other, EMA excretion >150 mmol/mol creatinine (8 individuals).
Fibroblasts derived from individuals with ECHDC1 variants were all juvenile and compared to juvenile healthy fibroblasts: C1 (Cambrex, #CC‐2509), C2 (Promocell, #C‐12300) and C3 (ATCC, CRL‐2450). For the lentivirus transduction experiments (see below), DNA derived from juvenile healthy fibroblasts were sequenced and selected to represent the three possible ACADS c.625G>A genotypes: ACADS c.[=];[=] (Cambrex, #CC‐2509), ACADS c.[625G>A];[=] (Promocell, #C‐12300) or ACADS c.[625G>A];[625G>A] (kindly provided by Sarah Young, Duke University).
2.2. Cell culture
All cells were kept at standard conditions (37°C, 5% CO2). HEK293T cells (ATCCCRL‐11268, Boras, Sweden) were maintained in Dulbecco's Modified Eagle Medium (DMEM) (Lonza) supplemented with 10% fetal bovine serum (FBS) (Sigma‐Aldrich), 4 mM l‐Glutamine and 100 U/mL Penicillin‐Streptomycin Mixture. Fibroblasts were maintained in standard Roswell Park Memorial Institute (RPMI) 1640 medium (Lonza) supplemented with 10% FBS (Sigma‐Aldrich), 4 mM l‐Glutamine and 100 U/mL Penicillin‐Streptomycin Mixture.
2.3. ACADS and ECHDC1 genomic sequence analysis
ACADS (GenBank: NM_000017.2) was sequenced as described previously. 19 Five mRNA reference sequences/ECHDC1 isoforms are reported in NCBI (Gene ID: 55862, updated on 21‐Dec‐2019). Primers were designed to cover exonic and nearby intronic elements of all five isoforms. DNA variants and locations are reported in relation to isoform 1 (GenBank: NM_001002030.1), which is the most abundantly expressed isoform and the one characterized in Linster et al. 17 Exonic elements and flanking intronic regions of both genes were amplified by conventional PCR and subsequently sequenced on a 3100‐Avant Genetic Analyser using BigDye Terminator v1.1 Cycle Sequencing kit (Applied Biosystems). Primer sequences can be obtained upon request. PCRs were carried out in a final volume of 25 μL using: 2.5 μL 10× TEMPase buffer (Ampliqon), 1.25 pmol of each dNTP (GE Healthcare), 5 pmol of each primer (DNA Technology), 1 μL of DNA template (2 μL if bloodspot DNA), 1 U TEMPase hot start polymerase (Ampliqon). PCR conditions were: one cycle at 96°C for 15 minutes, 35 cycles at 96°C for 30 seconds, 50°C for 1 minute, 72°C for 1.5 minutes, one cycle at 72°C for 5 minutes. The quality and quantity of PCR products were validated on a 2% agarose gel using standard methods. Sequence data were analysed using Sequencer from Gene Codes Corporation.
2.4. RNA purification and quantitative PCR
Total RNA was isolated using TRIzol Reagent (Sigma‐Aldrich), according to the manufacturer's protocol. RNA quality was confirmed on a 1.5% agarose gel and its purity was validated using the Synergy H1 Hybrid Multi‐Mode Microplate Reader, with a 260/280 ratio of 1.8 to 2.1. cDNA was synthesized using iScript cDNA Synthesis Kit (BioRad) and 500 ng of RNA. cDNA was diluted 1:40 and 4 μL were used as a template for qPCR amplification in a total reaction volume of 20 μL. RT‐qPCR reactions were performed on the ABI StepOnePlus using TaqMan Fast Universal PCR Master Mix. (Applied Biosystems) and predesigned hydrolysis probes (TaqMan probes) targeting either ECHDC1 (dyed with FAM (Applied Biosystems), Entrez: 55862) recognising exon 5/6 boundary (all ECHDC1 isoforms were detected by the probe) or GAPDH (dyed with VIC [Life Technologies], Entrez: 2597) targeting exon 3 or POP4 (dyed with FAM (Applied Biosystems), Entrez: 10775), targeting exon 3/4 boundary. The reaction conditions were: one cycle at 95°C for 20 seconds, 40 cycles at 95°C for 1 second and one cycle at 60°C for 20 seconds. Each sample was analysed in triplicates. A no‐template (nuclease‐free water) and a no‐reverse‐transcriptase control were included in each plate for each probe. Based on three independent experiments, the mean correlation coefficient (R 2) was 0.996 ± 0.000 and 0.997 ± 0.001 and the mean PCR efficiency was 93.207 ± 2.468 and 98.306 ± 2.442 for the POP4 and ECHDC1 assay, respectively. Results were calculated using the standard curve method.
2.5. In silico predictions
Splice site strength and activation of putative cryptic splice sites were analysed using the SpliceSiteFinder‐like, 20 MaxEntScan, 21 NNSplice, 22 GeneSplicer 23 and Human Splicing Finder 2.4.1. 24 The analyses were performed using Alamut Visual version 2.10 (Interactive Biosoftware, Rouen, France) with default settings. The allele frequency of the variants was obtained from gnomAD. The consequences of ECHDC1 c.389T>C;p.Met130Thr missense variant on protein structure and function were predicted using PolyPhen‐2 25 and SIFT, 26 while the conservation of ECHDC1 p.Gly74 was predicted using ConSurf. 27
2.6. PCR analysis of ECHDC1 splice products
To detect putative misspliced ECHDC1 mRNAs, cDNA was amplified by conventional PCR (annealing temperature 59°C) and sequenced on a 3500 Dx Genetic Analyzer (Applied Biosystems) as described above. Sequencing data were analysed using CLC Main Workbench 8.1 (QIAGEN). A 5′ primer (5′GACAGCCTCTCTGTCTGGAAG3′), located in exon 2 and a 3′ primer (5′ATGAACATGCATACGGCCATTC3′), located in exon 4, were used for ECHDC1 c.221‐4_222delinsTA variant. A 5′ primer (5′TAAGTGTTGCGCTGGTTCAAG3′), located in exon 5 and a 3′ primer (5′TCGTTCTGTAATGCTTCCTCCA3′) located in exon 6, were used for ECHDC1 c.498‐36_498‐33del variant.
2.7. In vitro studies of recombinant human p.Met130Thr ECHDC1
The human ECHDC1 cDNA was amplified from human liver mRNA and cloned in a pET28a plasmid, essentially as described in Linster et al, 17 using a 5′ primer (5′CAGCATATG GCGAAAAGTCTTTTGAAGAC3′) containing a NdeI site (underlined) and the initiating ATG (in boldface type) and a 3′ primer (5′TTGCGGCCGC TTATTTATTAAATTTTCCTTTCTTAGC3′) containing a NotI site (underlined) and the stop codon (in boldface type). The p.Met130Thr mutation was produced by site directed mutagenesis, as previously described. 28 The primers used were 5′CCGTATGCATGTTCA C GCAAAACACCTTA3′ and 5′TAAGGTGTTTTGC G TGAACATGCATACGG3′, where the mutated nucleotides are underlined. The expression plasmids encoding either wild‐type or p.Met130Thr mutated ECHDC1 were checked through sequencing and used to transform E. coli BL21. Protein expression was induced with 0.4 mM IPTG and cells were harvested after 20 hours of incubation at 20°C in LB medium. Protein extraction and purification was performed as previously described. 17 The activity of wild‐type and p.Met130Thr ECHDC1 was assayed through the decrease in acid‐stable [14C]ethylmalonyl‐CoA. Radioactive‐labelled ethylmalonyl‐CoA and the reaction was performed as previously described. 17
2.8. Lentivirus production, transduction and ECHDC1 knockdown
The preparation of lentivirus for ECHDC1 knockdown was done by standard calcium phosphate transfection protocol in HEK293T cells, as described previously. 29
Briefly, 1 × 10⁷ HEK293T cells seeded 1 day prior were transfected with 40 μg shRNA‐encoding pGIPZ lentiviral transfer vector DNA (Dharmacon) either targeting GAPDH [MIM: 138400] (shGAPDH), ECHDC1: V2LHS_175832 (shECHDC1#1), V2LHS_277143 (shECHDC1#2), V3LHS_355398 (shECHDC1#3), V3LHS_355399 (shECHDC1#4) or V3LHS_355397 (shECHDC1#5), or encoding a non‐targeting shRNA (shNonT), along with 10 μg pMD2.G (Addgene) and 30 μg psPAX (Addgene) in 2.5 M CaCl2 and 2× HEPES (50 mM HEPES, 10 mM KCl, 12 mM Dextrose, 280 mM NaCl, 1.5 mM Na2PO4 pH 7.05). Supernatant was collected on day 3 and filtered through a 0.45 μm pore‐size (Sarstedt) before ultracentrifugation in conical tubes (Beckman Coulter) at 25000 rpm, 4°C, using a Beckman L8‐70M ultracentrifuge. The virus pellet was re‐suspended in Dulbecco's Phosphate‐Buffered Saline (DPBS) pH 7.2, no CaCl2, no MgCl2. The titre was estimated by HIV‐1 p24 Antigen ELISA 2.0, according to manufacturer's protocol (ZeptoMetrix Corporation), assuming that 1 μg p24 corresponds to 107 infectious particles.
Fibroblasts were transduced with pGIPZ lentiviral vectors in the presence of 6 μg/mL polybrene, at a MOI ~0.1, as estimated by the p24‐adjusted dose, to minimize the number of cells integrating more than one vector copy. The MOI of ~0.1 was validated by GFP fluorescence microscopy. Transduced fibroblasts were then selected in RPMI 1640 medium containing 1.5 μg/mL puromycin, before switching back to standard RPMI 1640 medium, and the resulting GFP positive and puromycin resistant colonies were pooled before assessing target mRNA knockdown by RT‐qPCR.
Knockdown efficiency in the three fibroblast cell lines was initially tested using RT‐qPCR with all five shRNAs, targeting ECHDC1 (shECHDC1#1‐ shECHDC1#5, see above) (data not shown). Fibroblast transduced with the following shRNAs were chosen for further experiments: shECHDC1#5 for ACADS 625G/G fibroblasts, shECHDC1#3 for ACADS 625G/A fibroblasts and shECHDC1#1 for ACADS 625A/A fibroblasts. ECHDC1 expression level relative to shNonT was similar in the three fibroblast cell lines across culturing experiments, with values of 0.37±0.09, 0.42 ± 0.01and 0.53 ± 0.16, respectively (data not shown).
2.9. Quantification of EMA by LC‐MS/MS from ECHDC1 knockdown fibroblasts
ECHDC1 knockdown fibroblasts were grown with or without 5 mM sodium butyrate (Sigma‐Aldrich) for 24 hours to stimulate EMA excretion, as described by Linster et al. 17 EMA in the culture medium was quantified by liquid chromatography tandem mass spectrometry (LC‐MS‐MS). A 275 μL sample of cell culture medium was transferred to a 1.5 mL microtube (Eppendorf) and added with 25 μL of internal standard solution (10 μM ethylmalonic acid‐D3, Cambridge Isotope Laboratories, in H2O) followed by 800 μL of cold acetonitrile for protein precipitation. The sample was vortex‐mixed and incubated for 2 minutes before centrifugation at 15.000×g. The supernatant was transferred to a new 1.5 mL microtube and evaporated to dryness using a vacuum concentrator. The sample was reconstituted in 100 μL H2O with 0.2% formic acid and 7.5 μL were injected (partial loop needle overfill injection mode) in the UPLC‐MS/MS system. Separate calibrator samples containing ethylmalonic acid in the concentration range 0.0015 to 3.3 μM were prepared for quantification. Calibrator samples were prepared by diluting a 10 mM stock solution of ethylmalonic acid (Sigma‐Aldrich) with fresh medium and then following the same procedure as the experimental samples. A calibration curve was constructed by (1/x) weighted linear regression analysis using the ethylmalonic peak area normalized with the internal standard peak area.
Samples were analysed by LC‐MS/MS with a Waters Acquity UPLC coupled to a Xevo TQ‐S (Waters Milford, Massachusetts) mass spectrometer operating in the multiple reaction monitoring (MRM) mode. The column was a HSS‐C18 (Waters Acquity, 100 × 2.1 mm, 1.8 μm), and the flow rate was 0.4 mL/min with solvent A (H2O with 0.2% formic acid) and B (methanol with 0.1% formic acid). The gradient chromatography profile used was: 0 to 0.5 minute: hold 99% A and 1% B; 0.5 to 5 minutes: linear gradient to 10% A; 5 to 6 minutes: hold 10% A; 6 to 6.1 minutes: linear gradient to 99% A; 6.1 to 8 minutes: hold 99% A.
Electrospray ionization in the negative ion mode (ES÷) with a capillary voltage of 2.73 kV was used with the following settings: gas flow 150 L/h (cone) and 800 L/h (desolvation), temperatures 150°C (source) and 600°C (desolvation).
The following MRM transitions were used for monitoring ethylmalonic acid: 131 > 86.9 (quantifier) and 131 > 68.9 (qualifier) while for ethylmalonic acid‐D3 134 > 90 (quantifier) and 134 > 72 (qualifier) were used. A cone voltage of 22 V was used for all transitions and the collision energy was 9 eV for the quantifier transitions and 20 eV for the qualifier transitions.
3. RESULTS
DNA samples from 82 clinically affected individuals with unexplained high levels of EMA (urinary EMA >20 mmol/mol creatinine), and carriers of the common ACADS variants were included.
3.1. Genetic analysis of ECHDC1
Only three out of 82 individuals were found to have heterozygous variants in ECHDC1. Individual P1 and P3 carried the c.389T>C (p.Met130Thr) and the c.221‐4_222delinsTA ECHDC1 variant, respectively and were homozygous for ACADS c.625G>A with urinary EMA >40 mmol/mol creatinine (Group B, see Materials and Methods). P2 carried a c.498‐36_498‐33del ECHDC1 variant and was heterozygous for ACADS c.625G>A with urinary EMA >20 mmol/mol creatinine (Group A). According to the gnomAD database, the identified ECDHC1 variants were either not reported or reported with a very low allele frequency in the general population (Table 1 and Figure 1). The clinical presentation of the three individuals was similar to previously published EMA individuals with disease onset in infancy or childhood and symptoms such as hypotonia, developmental delay, feeding difficulties, failure to thrive and cyclic vomiting. There were no reports of similar phenotypes in family members. Samples from parents and other family members were not available.
TABLE 1.
Identified ECHDC1 variants
| ECHDC1 genotype | Allele frequency a | ACADS genotype | Group b | |
|---|---|---|---|---|
| P1 | c.[389T>C];[=] | 0.00007 | c.[625G>A];[ 625G>A] | B |
| EMA >40 mmol/mol creatinine | ||||
| P2 | c.[498‐36_498‐33del];[=] | NR | c.[625G>A];[=] | A |
| EMA >20 mmol/mol creatinine | ||||
| P3 | c.[221‐4_222delinsTA];[=] | NR | c.[625G>A];[625G>A] | B |
| EMA >40 mmol/mol creatinine |
Abbreviation: NR, not reported.
Allele frequency in the general population, according to the gnomAD database, Date 080620.
Groups are defined as described in Material and Methods.
FIGURE 1.
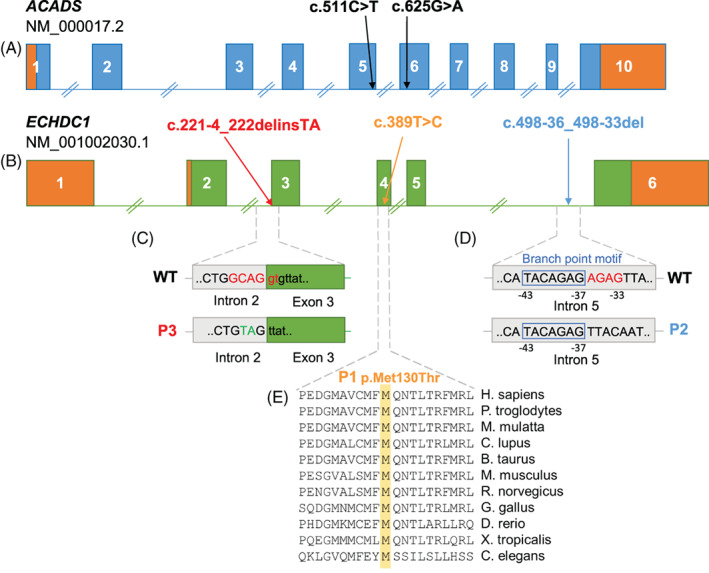
Location and predicted molecular consequences of ACADS and ECHDC1 variants identified in the three individuals with high EMA. A and B, Genomic location of the two common ACADS susceptibility variants and of the three ECHDC1 variants. The 5′ and 3′ UTR regions are displayed in orange. C, P3 carries an indel variant in the acceptor splice site of intron 2; 6nt are deleted (depicted in red) and 2nt are inserted (depicted in green). D, P2 carries a deletion of 4nt (depicted in red) next to a predicted branch point motif (blue box) in intron 5. E, P1 carries a c.389T>C missense variant in exon 4, which results in the replacement of p.Met130 with a Thr. Met130 is a highly conserved amino acid in numerous eukaryotic species
3.2. The three ECHDC1 variants result in loss‐of‐function
The ECHDC1 c.389T>C variant changes a highly conserved and nonpolar methionine to a polar threonine (Figure 1E). In silico analysis by SIFT 26 and PolyPhen 25 scores this alteration not tolerable (score: 0) and probably damaging (score: 0.99), respectively. Overexpression studies of wild‐type and variant p.Met130Thr ECHDC1 in E. coli confirmed the in silico predictions since the decarboxylation activity of the variant enzyme was 5% to 10% compared to the wild‐type one (Figure 2).
FIGURE 2.
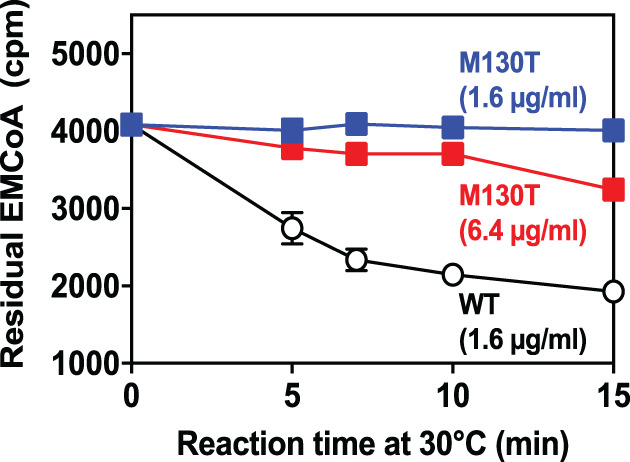
Decarboxylation activity of p.Met130Thr variant ECHDC1 compared to wild‐type ECHDC1. Both proteins were produced in E. coli as fusion proteins with an N‐terminal His‐tag. They were purified to homogeneity and incubated in the reaction mixture at the indicated protein concentrations in the presence of [14C]ethylmalonyl‐CoA (EMCoA). The reaction was stopped at the indicated times and the residual [14C]ethylmalonyl‐CoA was determined. Data represent means ± SD for 6 wild‐type (WT, 1.6 μg/mL), 4 p.Met130Thr (6.4 μg/mL) and 2 p.Met130Thr (1.6 μg/mL) determinations performed in 2 separate experiments. If not visible, the SD bar is smaller than the size of the symbol
Dermal fibroblasts from individual 2 and 3, who carry the intronic variants c.498‐36_498‐33del and c.221‐4_222delinsTA, respectively, were available. RT‐qPCR analyses showed approx. 50% ECHDC1 mRNA expression in fibroblasts as compared to healthy controls, categorizing them as loss‐of‐function variants (Figure 3). Due to low expression levels, it was not possible to quantify fibroblast ECHDC1 protein level by Western blot analysis or its activity by [14C]ethylmalonyl‐CoA decarboxylase assay.
FIGURE 3.
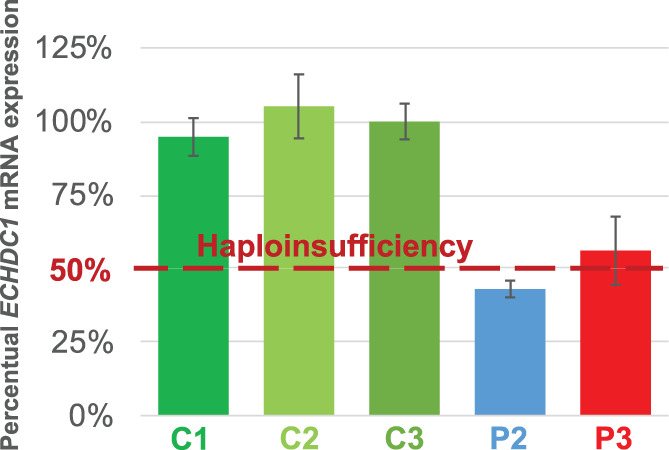
ECHDC1 mRNA expression in fibroblasts from individual 2 and 3 compared to three controls. The error bars (±SD) represent triplicate RT‐qPCR measurements from each of 2 to 3 independent cell cultures
The c.498‐36_498‐33del variant is located immediately downstream of a branch point motif (Figure 1D). Usually, branch points are located 21‐34 nucleotides upstream of an exon, with the consensus sequence yUnAy. 30 Human Splicing Finder 24 predicts the ECHDC1 c.498‐43_498‐37 nucleotides as the strongest branch point motif located in the region. Sequence analysis of ECHDC1 mRNA did not show any misspliced products suggesting that putative misspliced mRNAs produced by the variant allele are degraded by nonsense‐mediated decay (NMD), confirming RT‐qPCR results.
According to various splice site prediction programs, the c.221‐4_222delinsTA variant deletes the acceptor splice site in intron 2, creating a weaker acceptor splice site 3nt downstream in exon 3 and activating a stronger cryptic acceptor splice site 44nt upstream in intron 2 (Figure 4A,B). In agreement with these predictions, comprehensive analyses of ECHDC1 splice products (Figure 4C‐G), showed that most ECHDC1 mRNA molecules are spliced using the upstream acceptor splice site in intron 2 resulting in unstable ECHDC1 transcripts with an out‐of‐frame deletion, which are substrates for NMD. Only a minor amount of mRNA molecules are spliced using the downstream acceptor splice site in exon 3, which results in stable ECHDC1 transcripts with an in‐frame deletion of the highly conserved p.Gly74 (Figure 4H). This is in agreement with RT‐qPCR showing approximately 50% ECHDC1 expression in P3's fibroblasts (Figure 3).
FIGURE 4.
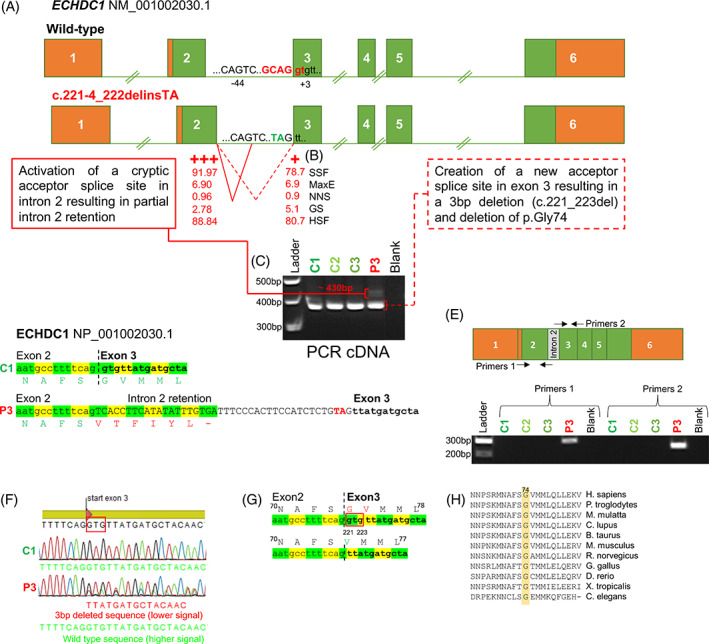
Molecular consequences of ECHDC1 c.221‐4_222delinsTA. A, The c.221‐4_222delinsTA mutation deletes intron 2 acceptor splice site, creating a weaker acceptor splice site 3nt downstream in exon 3, and activating a stronger cryptic acceptor splice site 44nt upstream in intron 2. The position of the acceptor‐splice‐site‐motif G (NAG/NN) is indicated. B, The strength of the two alternative acceptor splice sites, according to five different prediction programs, is shown; SSF: SpliceSiteFinder, MaxE: MaxEntScan, NNS: NNSplice GS: GeneSplicer, HSF: Human Splicing Finder (see Material and Methods). C, The PCR products obtained, using cDNA as template and primers located in exon 2 and 3, respectively, are shown (3% agarose gel). In P3, two bands were observed: a ~430 bp band and a ~380 bp band, similar in size to the wild‐type band. D, The activation of the upstream acceptor splice site, results in partial intron 2 retention (~430 bp band) and creation of a premature stop codon due to a shifted reading frame. The TA insertion is depicted in red. E, The PCR products obtained with primers, specific for the inserted intronic fragment, are displayed and shown to be unique for P3 cDNA (2% agarose gel). F, Sequence data from analysis of the ~380 bp band in panel (C). The creation of the downstream acceptor splice site results in 3 bp deletion (c.221_223del). A heterozygous 3 bp deletion is clearly visible in the sequencing data derived from P3, but not in C1. G, The 3 bp deletion causes the deletion of p.Gly74. The deleted nucleotides are enclosed in the red box. H, A multiple alignment analysis shows that p.Gly74 is conserved among Eukaryotic species
3.3. ACADS and ECHDC1 deficiencies act in synergy on cellular EMA excretion
Having shown that 3/82 SCADD individuals with common ACADS variants were heterozygous for loss‐of‐function ECHDC1 variants, we speculated that ECHDC1 haploinsufficiency, in combination with the common ACADS c.625G>A variant, had an additive effect on EMA levels. To further examine this hypothesis, we measured EMA levels in cultured fibroblasts from healthy individuals, who were either wild‐type, heterozygous or homozygous for ACADS c.625G>A, with or without approximately halved knockdown of ECHDC1 mRNA levels (Figure 5). The six cell lines were constructed by transduction either with non‐targeting shRNA or with ECHDC1 targeting shRNA. EMA excretion was measured by UPLC‐MS/MS in culturing medium from all six cell lines after 24 hours with or without 5 mM butyrate stimulation. Neither ECHDC1 knockdown alone nor homozygosity or heterozygosity for the common ACADS c.625G>A variant had a significant effect on EMA excretion. However, the combination of the two gene deficiencies seemed to have an additive effect on EMA excretion, with ACADS homozygosity + ECHDC1 knockdown showing 2‐fold increase in EMA as compared to ACADS heterozygosity + ECHDC1 knockdown. When challenged with butyrate, ECHDC1 knockdown or ACADS c.625G>A homozygosity individually increased EMA excretion approximately 2‐fold. However, combining ACADS c.625G>A homozygosity with ECHDC1 knockdown increased EMA excretion >6‐fold when the cells were challenged with butyrate illustrating that ACADS and ECHDC1 deficiency act in synergy on cellular EMA levels when challenged with butyrate.
FIGURE 5.
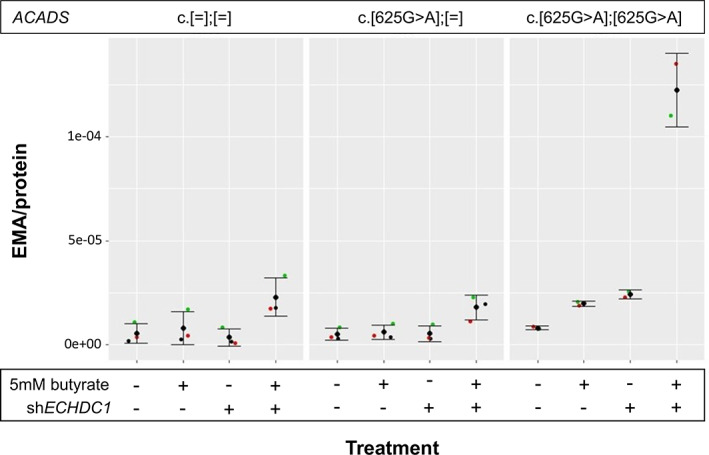
EMA Excretion in Fibroblasts with the Three Possible ACADS c.625G>A Genotypes, with or without ~50% ECHDC1 Knockdown and with or without Butyrate Stimulation. Fibroblasts were treated either with non‐targeting shRNA or with ECHDC1 targeting shRNA. Fibroblasts were treated for 24 hours either with 0 mM or with 5 mM butyrate. EMA excretion was measured for all cell lines and expressed as EMA/protein. Data from two experiments (c.[625G>A];[625G>A]) or three experiments (c.[=];[=] and c.[625G>A];[=]) are shown as the mean ± SD
4. DISCUSSION
SCADD is an enigmatic inborn error of metabolism, primarily due to the existence of two common ACADS variants, c.625G>A and c.511C>T, with high allele frequencies in the general population, but significantly overrepresented in individuals with elevated urinary EMA. 15 , 16 Moreover, reports of follow‐up from newborn screening programs have demonstrated that the majority of infants with elevated butyryl‐carnitine/EMA do not develop clinical symptoms. 2 On the other hand; clinical symptoms have been reported in some individuals with EMA and biallelic rare ACADS variants. 1 , 2 Therefore, it has been speculated that ACADS common variants and EMA might be risk factors for the development of disease, but that symptoms might only develop in combination with other genetic or environmental factors. 1 , 15 , 31 ECHDC1 has been described and characterized as an EMA metabolite repair enzyme, which may play a role in ethylmalonic aciduria. 17 In order to investigate the role of ECHDC1 in ethylmalonic aciduria, we sequenced ECHDC1 in a unique cohort of 82 symptomatic individuals with high EMA levels (urinary EMA >20 mmol/mol creatinine), and with the common c.625G>A and c.511C>T variants or no identified variants in the ACADS gene. Heterozygous ECHDC1 variants were identified in only three individuals, all carrying the common ACADS c.625G>A variant. In vitro studies of the variants in E. coli or in fibroblasts derived from the affected individuals verified that all three variants are loss‐of‐function variants resulting in no or very low ECHDC1 gene expression/residual activity. Based on this, we hypothesized that ECHDC1 haploinsufficiency, in combination with the common ACADS c.625G>A variant, may act in synergy on cellular EMA levels. Through in vitro fibroblast studies, we showed that homozygosity for ACADS c.625G>A variant in combination with approximately halved ECHDC1 knockdown had a significant and additive effect on EMA excretion when fibroblasts were challenged with butyrate (P‐value .0009).
The concept of synergistic heterozygosity, where partial deficiencies of different genes in the same metabolic pathway result in pathological amounts of disease‐associated metabolites, was first described in individuals affected by various inborn errors of metabolism. 32 , 33 Later, it has been demonstrated that digenic/oligogenic inheritance play a role in several disorders and is a common cause of reduced penetrance in genetic diseases, 34 , 35 , 36 , 37 , 38 but relatively few cases have been convincingly explained by combined genetic and functional studies. While our functional ex vivo studies in human cells clearly show that ECHDC1 haploinsufficiency in combination with the common ACADS c.625G>A variant has an additive effect on EMA levels, the clinical evidence of a digenic disease mechanism is not well supported, since only three unrelated cases were identified and since it was not possible to perform family segregation studies to verify a digenic cause. Clearly, the impact of ECHDC1 on the incomplete biochemical penetrance in SCADD needs more clarification, but from the present study, it is safe to say that ECHDC1 variants do not play a major role, and that one needs to look for alternative genes and mechanisms.
Other examples of potential gene‐gene interactions in SCADD have previously been reported in symptomatic individuals, who were homozygous for ACADS c.625G>A, and had reduced expression of the essential mitochondrial antioxidant, superoxide dismutase 2 (SOD2) [EC 1.15.1.1]. These individuals had increased susceptibility to oxidative stress, compared to healthy controls, who were homozygous ACADS c.625G>A and with normal levels of SOD2. 39 , 40 Another gene‐gene interaction has been observed between SCAD and its co‐factor flavin adenine dinucleotide (FAD). Affected individuals harbouring the c.625G>A variant have significantly lower blood FAD levels than affected individuals with two rare ACADS variants. 41 In addition, it has been shown that the effects of the two ACADS susceptibility variants are modulated by cellular temperature. 15 , 16 In the present study, we show that catabolic stress with increased butyrate load increases the functional consequence of isolated ACADS and ECHDC1 deficiency, respectively and had an additive effect on EMA levels when ACADS deficiency acts in combination with ECHDC1 deficiency. Thus, the common ACADS variants may only be conditionally pathogenic if they interact with other genes or environmental changes pushing the EMA level over a required threshold into possibly pathology.
In conclusion, this is the first report demonstrating ECHDC1 gene defects in humans. Our study suggests that ECHDC1 may be involved in elevated EMA excretion in only a small group (3/82) of individuals with common ACADS variants. Other potential modifier genes would be those associated with increased EMA due to secondary disturbances of SCAD, such as the genes involved in electron transfer from SCAD (ETFA, ETFB, ETFDH), genes involved in flavin‐cofactor metabolism/transport and the ETHE1 gene. Moreover, performing whole genome sequencing in our cohort of individuals with common ACADS variants and elevated EMA could unravel other EMA modifier genes and/or identify other genetic causes and mechanisms of their unexplained neuromuscular symptoms.
CONFLICT OF INTEREST
The authors confirm independence from the sponsors; the content of the article has not been influenced by the sponsors.
AUTHOR CONTRIBUTIONS
Rikke K. J. Olsen, Emile Van Schaftingen, Lars Aagaard and Niels Gregersen designed the research and critically reviewed the manuscript. Sarah Fogh and Graziana Dipace drafted the manuscript. Anne Bie and Margrethe Kjeldsen sequenced the ECHDC1 and ACADS genes. Maria Veiga‐da‐Chunha performed E. coli studies of recombinant p.Met130Thr ECHDC1. Jakob Hansen performed EMA metabolite measurements. Sarah Fogh performed ECHDC1 knockdown experiments and RT‐qPCR studies in fibroblasts. Graziana Dipace characterized the ECHDC1 splice variants, assisted by Signe Mosegaard. Antonia Ribes provided patient cells and clinical data. All authors have reviewed the manuscript. Rikke K. J. Olsen is the guarantor of the work and, as such, accepts full responsibility for the work and/or the conduct of the study, had access to the data, and controlled the decision to publish.
ETHICS STATEMENT
This study has been approved by the Central Denmark Region Committees on Health Research Ethics (reference number 1‐10‐72‐6‐16).
ACKNOWLEDGMENTS
We thank patients and their families and collaborators (biochemists and clinicians) for providing important samples and knowledge for the present study. The study was supported by the Aarhus County Research Initiative, the Faculty of Health, Aarhus University (PhD Scholarship to S.F.), the Fonds de la Recherche Scientifique‐FRS/FNRS (J.0104.18 to M.V.D.C.), the Walloon Excellence in Life Sciences and Biotechnology (WELBIO CR‐2015A‐09 to E.V.S.), and by the Instituto de Salud Carlos III (PI19/01310) and the Centro de Investigación Biomédica en Red de Enfermedades Raras (CIBERER), an initiative of the Instituto de Salud Carlos III, Ministerio de Ciencia e Innovación, Spain (to A.R.).
Fogh S, Dipace G, Bie A, et al. Variants in the ethylmalonyl‐CoA decarboxylase ( ECHDC1 ) gene: a novel player in ethylmalonic aciduria? J Inherit Metab Dis. 2021;44(5):1215–1225. 10.1002/jimd.12394
Sarah Fogh, Graziana Dipace, Emile Van Schaftingen, and Rikke K. J. Olsen contributed equally to this work.
Funding information Fonds De La Recherche Scientifique ‐ FNRS, Grant/Award Number: J.0104.18; Ministerio de Ciencia e Innovación; Instituto de Salud Carlos III, Grant/Award Number: PI19/01310; Centro de Investigación Biomédica en Red de Enfermedades Raras (CIBERER); Walloon Excellence in Life Sciences and Biotechnology, Grant/Award Number: WELBIO CR‐2015A‐09; Aarhus University Communicating Editor: Jerry Vockley
Endnote
We deliberately avoid the terms “SCADD patients” and more generally “patients” in the present article, to avoid any implicit assumption that SCADD is an established disease. All “individuals” studied in the present work are nonetheless “patients” in the usual meaning, that is, people consulting health care providers for health problems.
DATA AVAILABILITY STATEMENT
The ECHDC1 variants reported in this paper have been submitted to the ClinVar database (https://www.ncbi.nlm.nih.gov/clinvar/) with the following ClinVar accession numbers SCV001432708 (c.221‐4_222delinsTA), SCV001432709 (c.389T>C) and SCV001432710 (c.498‐36_498‐33del). The remaining data supporting the current study have not been deposited in a public repository but are available from the corresponding author on request.
REFERENCES
- 1. Pedersen CB, Kølvraa S, Kølvraa A, et al. The ACADS gene variation spectrum in 114 patients with short‐chain acyl‐CoA dehydrogenase (SCAD) deficiency is dominated by missense variations leading to protein misfolding at the cellular level. Hum Genet. 2008;124:43‐56. [DOI] [PubMed] [Google Scholar]
- 2. Wolfe L, Jethva R, Oglesbee Devin, Vockley Jerry. 2011. Short‐Chain Acyl‐CoA Dehydrogenase Deficiency. University of Washington, Seattle: GeneReviews® [Internet] https://www.ncbi.nlm.nih.gov/books/NBK63582/. [PubMed] [Google Scholar]
- 3. Tiranti V, D'Adamo P, Briem E, et al. Ethylmalonic encephalopathy is caused by mutations in ETHE1, a gene encoding a mitochondrial matrix protein. Am J Hum Genet. 2004;74:239‐252. [DOI] [PMC free article] [PubMed] [Google Scholar]
- 4. Olsen RKJ, Andresen BS, Christensen E, Bross P, Skovby F, Gregersen N. Clear relationship between ETF/ETFDH genotype and phenotype in patients with multiple acyl‐CoA dehydrogenation deficiency. Hum Mutat. 2003;22:12‐23. [DOI] [PubMed] [Google Scholar]
- 5. Green P, Wiseman M, Crow YJ, et al. Brown‐Vialetto‐Van Laere syndrome, a Ponto‐bulbar palsy with deafness, is caused by mutations in C20orf54. Am J Hum Genet. 2010;86:485‐489. [DOI] [PMC free article] [PubMed] [Google Scholar]
- 6. Ho G, Yonezawa A, Masuda S, et al. Maternal riboflavin deficiency, resulting in transient neonatal‐onset glutaric aciduria type 2, is caused by a microdeletion in the riboflavin transporter gene GPR172B. Hum Mutat. 2011;32:E1976‐E1984. [DOI] [PubMed] [Google Scholar]
- 7. Bosch AM, Abeling NG, Ijlst L, et al. Brown‐Vialetto‐Van Laere and Fazio Londe syndrome is associated with a riboflavin transporter defect mimicking mild MADD: a new inborn error of metabolism with potential treatment. J Inherit Metab Dis. 2011;34:159‐164. [DOI] [PMC free article] [PubMed] [Google Scholar]
- 8. Olsen RKJ, Reinson K, Künnapas K, et al. Riboflavin‐responsive and ‐non‐responsive mutations in FAD synthase cause multiple acyl‐CoA dehydrogenase and combined respiratory‐chain deficiency. Am J Hum Genet. 2016;98:1130‐1145. [DOI] [PMC free article] [PubMed] [Google Scholar]
- 9. Schiff M, Veauville‐Merllié A, Su CH, et al. SLC25A32 mutations and riboflavin‐responsive exercise intolerance. New Engl J Med. 2016;374:795‐797. [DOI] [PMC free article] [PubMed] [Google Scholar]
- 10. Leipnitz G, Schuck PF, Ribeiro CA, et al. Ethylmalonic acid inhibits mitochondrial Creatine kinase activity from cerebral cortex of young rats in vitro. Neurochem Res. 2003;28:771‐777. [DOI] [PubMed] [Google Scholar]
- 11. Barschak AG, Ferreira Gda C, André KR, et al. Inhibition of the electron transport chain and creatine kinase activity by ethylmalonic acid in human skeletal muscle. Metab Brain Dis. 2006;21:11‐19. [DOI] [PubMed] [Google Scholar]
- 12. Ferreira Gda C, André KR, Schuck PF, et al. Effect of in vivo administration of ethylmalonic acid on energy metabolism in rat tissues. Metab Brain Dis. 2006;21:29‐39. [DOI] [PubMed] [Google Scholar]
- 13. Schuck PF, Busanello EN, Moura AP, et al. Promotion of lipid and protein oxidative damage in rat brain by ethylmalonic acid. Neurochem Res. 2010;35:298‐305. [DOI] [PubMed] [Google Scholar]
- 14. Ritter L, Kleemann D, Hickmann FH, et al. Disturbance of energy and redox homeostasis and reduction of Na+,K+‐ATPase activity provoked by in vivo intracerebral administration of ethylmalonic acid to young rats. Biochim Biophys Acta Mol Basis Dis. 2015;1852:759‐767. [DOI] [PubMed] [Google Scholar]
- 15. Gregersen N, Winter VS, Corydon MJ, et al. Identification of four new mutations in the short‐chain acyl‐CoA dehydrogenase (SCAD) gene in two patients: one of the variant alleles, 511C—>;T, is present at an unexpectedly high frequency in the general population, as was the case for 625G—>;A, toget. Hum Mol Genet. 1998;7:619‐627. [DOI] [PubMed] [Google Scholar]
- 16. Corydon MJ, Gregersen N, Lehnert W, et al. Ethylmalonic aciduria is associated with an amino acid variant of short chain acyl‐coenzyme A dehydrogenase. Pediatr Res. 1996;39:1059‐1066. [DOI] [PubMed] [Google Scholar]
- 17. Linster CL, Noël G, Stroobant V, et al. Ethylmalonyl‐CoA decarboxylase, a new enzyme involved in metabolite proofreading. J Biol Chem. 2011;286:42992‐43003. [DOI] [PMC free article] [PubMed] [Google Scholar]
- 18. Dewulf JP, Gerin I, Rider MH, Veiga‐da‐Cunha M, van Schaftingen E, Bommer GT. The synthesis of branched‐chain fatty acids is limited by enzymatic decarboxylation of ethyl‐ and methylmalonyl‐CoA. Biochem J. 2019;476:2427‐2447. [DOI] [PMC free article] [PubMed] [Google Scholar]
- 19. Corydon MJ, Vockley J, Rinaldo P, et al. Role of common gene variations in the molecular pathogenesis of short‐chain acyl‐CoA dehydrogenase deficiency. Pediatr Res. 2001;49:18‐23. [DOI] [PubMed] [Google Scholar]
- 20. Zhang MQ. Statistical features of human exons and their flanking regions. Hum Mol Genet. 1998;7:919‐932. [DOI] [PubMed] [Google Scholar]
- 21. Yeo G, Burge CB. Maximum Entropy Modeling of Short Sequence Motifs with Applications to RNA Splicing Signals. J Comput Biol. 2004;11:377‐394. [DOI] [PubMed] [Google Scholar]
- 22. Reese MG, Eeckman FH, Kulp D, Haussler D. Improved splice site detection in genie. J Comput Biol. 1997;4:311‐323. [DOI] [PubMed] [Google Scholar]
- 23. Pertea M, Lin X, Salzberg SL. GeneSplicer: a new computational method for splice site prediction. Nucleic Acids Res. 2001;29:1185‐1190. [DOI] [PMC free article] [PubMed] [Google Scholar]
- 24. Desmet F‐O, Hamroun D, Lalande M, Collod‐Béroud G, Claustres M, Béroud C. Human splicing finder: an online bioinformatics tool to predict splicing signals. Nucleic Acids Res. 2009;37:e67. [DOI] [PMC free article] [PubMed] [Google Scholar]
- 25. Adzhubei IA, Schmidt S, Peshkin L, et al. A method and server for predicting damaging missense mutations. Nat Methods. 2010;7:248‐249. [DOI] [PMC free article] [PubMed] [Google Scholar]
- 26. Ng PC, Henikoff S. Predicting deleterious amino acid substitutions. Genome Res. 2001;11:863‐874. [DOI] [PMC free article] [PubMed] [Google Scholar]
- 27. Ashkenazy H, Abadi S, Martz E, et al. ConSurf 2016: an improved methodology to estimate and visualize evolutionary conservation in macromolecules. Nucleic Acids Res. 2016;44:W344‐W350. [DOI] [PMC free article] [PubMed] [Google Scholar]
- 28. Tahay G, Wiame E, Tyteca D, Courtoy PJ, Van Schaftingen E. Determinants of the enzymatic activity and the subcellular localization of aspartate N‐acetyltransferase. Biochem J. 2012;441:105‐112. [DOI] [PubMed] [Google Scholar]
- 29. Dalsgaard T, Cecchi CR, Askou AL, et al. Improved Lentiviral gene delivery to mouse liver by hydrodynamic vector injection through tail vein. Mol Ther ‐ Nucleic Acids. 2018;12:672‐683. [DOI] [PMC free article] [PubMed] [Google Scholar]
- 30. Gao K, Masuda A, Matsuura T, Ohno K. Human branch point consensus sequence is yUnAy. Nucleic Acids Res. 2008;36:2257‐2267. [DOI] [PMC free article] [PubMed] [Google Scholar]
- 31. Pedersen CB, Bross P, Winter VS, et al. Misfolding, degradation, and aggregation of variant proteins. The molecular pathogenesis of short chain acyl‐CoA dehydrogenase (SCAD) deficiency. J Biol Chem. 2003;278:47449‐47458. [DOI] [PubMed] [Google Scholar]
- 32. Vockley J, Rinaldo P, Bennett MJ, Matern D, Vladutiu GD. Synergistic heterozygosity: Disease resulting from multiple partial defects in one or more metabolic pathways. Mol Genet Metab. 2000;18:10‐18. [DOI] [PubMed] [Google Scholar]
- 33. Vladutiu GD. Heterozygosity: An Expanding role in proteomics. Mol Genet Metab. 2001;63:51‐63. [DOI] [PubMed] [Google Scholar]
- 34. Tang B, Xiong H, Sun P, et al. Association of PINK1 and DJ‐1 confers digenic inheritance of early‐onset Parkinson's disease. Hum Mol Genet. 2006;15:1816‐1825. [DOI] [PubMed] [Google Scholar]
- 35. Cooper DN, Krawczak M, Polychronakos C, Tyler‐Smith C, Kehrer‐Sawatzki H. Where genotype is not predictive of phenotype: towards an understanding of the molecular basis of reduced penetrance in human inherited disease. Hum Genet. 2013;132:1077‐1130. [DOI] [PMC free article] [PubMed] [Google Scholar]
- 36. Gonçalves, C. I. , Aragüés, J. M. , Bastos, M. & Barros, L . GNRHR biallelic and digenic mutations in patients with normosmic congenital hypogonadotropic hypogonadism. Endocr Connect. 2017;6:360‐366. [DOI] [PMC free article] [PubMed] [Google Scholar]
- 37. Sambuughin N, Mungunsukh O, Ren M, et al. Pathogenic and rare deleterious variants in multiple genes suggest oligogenic inheritance in recurrent exertional rhabdomyolysis. Mol Genet Metab Rep. 2018;16:76‐81. [DOI] [PMC free article] [PubMed] [Google Scholar]
- 38. Vockley J, Dobrowolski SF, Arnold GL, Guerrero RB, Derks TGJ, Weinstein DA. Complex patterns of inheritance, including synergistic heterozygosity, in inborn errors of metabolism: implications for precision medicine driven diagnosis and treatment. Mol Genet Metab. 2019;128:1‐9. [DOI] [PMC free article] [PubMed] [Google Scholar]
- 39. Pedersen CB, Zolkipli Z, Vang S, et al. Antioxidant dysfunction: potential risk for neurotoxicity in ethylmalonic aciduria. J Inherit Metab Dis. 2010;33:211‐222. [DOI] [PubMed] [Google Scholar]
- 40. Zolkipli Z, Pedersen CB, Lamhonwah AM, Gregersen N, Tein I. Vulnerability to oxidative stress in vitro in pathophysiology of mitochondrial short‐chain Acyl‐CoA dehydrogenase deficiency: response to antioxidants. PLoS One. 2011;6:27‐33. [DOI] [PMC free article] [PubMed] [Google Scholar]
- 41. Van Maldegem BT, Duran M, Wanders RJA, Waterham HR, Wijburg FA. Flavin adenine dinucleotide status and the effects of high‐dose riboflavin treatment in short‐chain acyl‐CoA dehydrogenase deficiency. Pediatr Res. 2010;67:304‐308. [DOI] [PubMed] [Google Scholar]
Associated Data
This section collects any data citations, data availability statements, or supplementary materials included in this article.
Data Availability Statement
The ECHDC1 variants reported in this paper have been submitted to the ClinVar database (https://www.ncbi.nlm.nih.gov/clinvar/) with the following ClinVar accession numbers SCV001432708 (c.221‐4_222delinsTA), SCV001432709 (c.389T>C) and SCV001432710 (c.498‐36_498‐33del). The remaining data supporting the current study have not been deposited in a public repository but are available from the corresponding author on request.