

Abstract
The methylase METTL3 is the writer enzyme of the N6‐methyladenosine (m6A) modification of RNA. Using a structure‐based drug discovery approach, we identified a METTL3 inhibitor with potency in a biochemical assay of 280 nM, while its enantiomer is 100 times less active. We observed a dose‐dependent reduction in the m6A methylation level of mRNA in several cell lines treated with the inhibitor already after 16 h of treatment, which lasted for at least 6 days. Importantly, the prolonged incubation (up to 6 days) with the METTL3 inhibitor did not alter levels of other RNA modifications (i. e., m1A, m6Am, m7G), suggesting selectivity of the developed compound towards other RNA methyltransferases.
Keywords: METTL3, RNA methyltransferase inhibitor, epitranscriptomics, m6A, leukemia
Writer's block: We developed and characterized a small‐molecule inhibitor of m6A writer METTL3 by protein crystallography, biochemical and cellular assays. It shows high‐nanomolar potency in the biochemical assay, good selectivity against a panel of protein methyltransferases and kinases, and it reduced m6A/A ratio in mRNAs of different cell lines. In addition, we confirmed the selectivity of our compound towards other RNA methyltransferases in living cells.

Introduction
The finely organized network of gene expression comprising RNA transcription, splicing, transport, translation, and degradation is often perturbed in cancer.[ 1 , 2 ] In addition to previously known regulators of gene expression, such as epigenetic modifications or miRNAs, the recently discovered layer of regulation based on co‐ and post‐transcriptional RNA modifications gave rise to a new field named epitranscriptomics.[ 2 , 3 ] While over 160 different RNA modifications have been discovered to date, one of the most abundant modifications, N6‐methyladenosine or m6A (comprising 0.1–0.4 % of all adenosine in mRNA), is involved in most of the aspects of RNA regulation, i. e., alternative polyadenylation, splicing (controls about 3 % of alternatively spliced exons [4] ), nuclear export, stability, and translation initiation.[ 2 , 3 ] It is also found in other RNA species, including lncRNAs, [5] rRNAs, [6] and snRNAs. [7] Dysregulated m6A deposition is directly involved in the development of acute myeloid leukemia (AML) and lymphomas, difficult‐to‐treat blood cancers,[ 1 , 8 , 9 , 10 , 11 , 12 ] as well being associated with other types of cancer (e. g., bladder, lung, ovarian, colorectal, bone, liver, gastric).[ 13 , 14 , 15 , 16 , 17 , 18 , 19 , 20 , 21 ]
In mRNAs and lncRNAs, most of the m6A modifications are installed in [G/A/U][G>A]m6AC[U>A>C] consensus sites (GGm6ACU is the most prevalent) [22] by the so‐called m6A‐METTL complex (MAC), consisting of methyltransferase‐like protein 3 (METTL3) and METTL14. [3] MAC is assisted by a regulatory complex (named MACOM, m6A‐ METTL‐associated complex) composed of WTAP, RBM15/B, VIRMA, ZC3H13 and HAKAI. [23] The crystal structure of the METTL3/14 complex was resolved in 2016,[ 24 , 25 , 26 ] revealing the function of each component. While METTL14 plays a scaffolding role in substrate RNA recognition, forming an RNA‐binding groove at the interface of the two subunits, METTL3 carries out the catalytic transfer of the methyl group from a cofactor S‐(5′‐adenosyl)‐ʟ‐methionine (SAM) onto the N6 atom of the adenine.[ 24 , 25 , 26 ]
To date, there are no cell‐permeable inhibitors of METTL3/14 with a disclosed chemical structure except for the universal nucleoside analogue sinefungin, which inhibits most methyltransferases and is not selective for METTL3.[ 27 , 28 ] Therefore, all published studies of the role of m6A in cancer have relied on the knockdown/overexpression of the writers, erasers, and readers. In contrast to this approach, using small‐molecule inhibitors preserves the function of the target enzyme to act as a scaffold for protein‐protein interactions that would otherwise be disrupted by RNAi, thus enabling discrimination between the enzymatic and structural roles. Indeed, it has been demonstrated that both a catalytically active and a non‐functional METTL3 lead to a reduction in p‐AKT levels highlighting the m6A‐independent function of METTL3. [10] In addition, small‐molecule inhibitors enable titration experiments across a range of concentrations to be performed, ranging from mild perturbation to near‐complete inhibition of the METTL3 enzymatic activity, which can reveal a spectrum of phenotypes. Generally, inhibitors can inactivate their targets rapidly, allowing precise temporal control over METTL3 function. This is particularly important for studying downstream effects of m6A depletion on gene and protein expression and will help to elucidate the m6A regulatory network in health and disease.
Here we report a nanomolar inhibitor of METTL3 (UZH1a) which is selective and cell‐permeable, while its enantiomer UZH1b is essentially inactive. The crystal structure of the complex shows several favourable interactions of the UZH1a chemical probe with METTL3, some of which are not observed in the METTL3/SAM complex and thus provide selectivity against other SAM‐dependent methyltransferases. Furthermore, the characterization of UZH1a in biochemical and cellular assays provides evidence that UZH1a has a good potential for the development of a lead compound against METTL3‐dependent cancers.
Results and Discussion
Our initial efforts to develop a potent and selective METTL3 inhibitor were focused on screening an adenine‐based library, which yielded several hits with micromolar potency in a homogenous time‐resolved fluorescence (HTRF) enzyme inhibition assay. [29] Protein structure‐based optimization coupled with compound potency evaluation in our HTRF assay [30] resulted in the high‐nanomolar inhibitor UZH1a (Figure 1a). The potency of UZH1a in the HTRF assay was 280 nM, while its enantiomer UZH1b was 100‐fold less active (Figure 1b). We confirmed the binding of UZH1a but not its enantiomer UZH1b to METTL3 by X‐ray crystallography (Figure 1c). The UZH1a inhibitor fills the pocket of the adenosine moiety of SAM but not the pocket of the SAM methionine. Besides the favourable van der Waals contacts, there are several hydrogen bonds between polar groups of the UZH1a inhibitor and METTL3 (yellow dashed lines in Figure 1c). The pyrimidine moiety is engaged in two hydrogen bonds with the backbone NH groups of Ile378 and Asn549. It is also involved in an edge‐to‐face π‐stacking arrangement with the phenol of Phe534 and π interactions with the amide group of the Asn549 side chain. The hydroxyl group is involved as the donor in a hydrogen bond with the side chain oxygen atom of Asn549 (distance of 2.5 Å) and in water‐bridged polar interactions (distance of 2.8 Å) with the backbone NH and CO groups of residues 550 and 535, respectively. There is also an intra‐inhibitor hydrogen bond between the amide NH and phenolic oxygen of UZH1a (green dashed line in Figure 1c). Notably, the binding of UZH1a results in a conformational rearrangement (6 Å displacement of the amino group) of the Lys513 side chain with respect to the Lys513 orientation in the complex of METTL3 with SAM or sinefungin (Figure 1d, PDB code 6Y4G). In detail, the tertiary amino group of UZH1a replaces the primary amine of Lys513 in the salt bridge with Asp395. As a consequence, the amine of Lys513 replaces the amino group of SAM in the salt bridge with Glu532. These castling‐like changes of ligand/METTL3 and intra‐METTL3 ionic interactions are likely to provide selectivity against other SAM‐dependent methyltransferases. Indeed, UZH1a demonstrated high selectivity towards other protein methyltransferases (as well as several promiscuous protein kinases), with remaining enzymatic activity of over 75 % at 10 μM concentration of UZH1a (Table 1).
Figure 1.
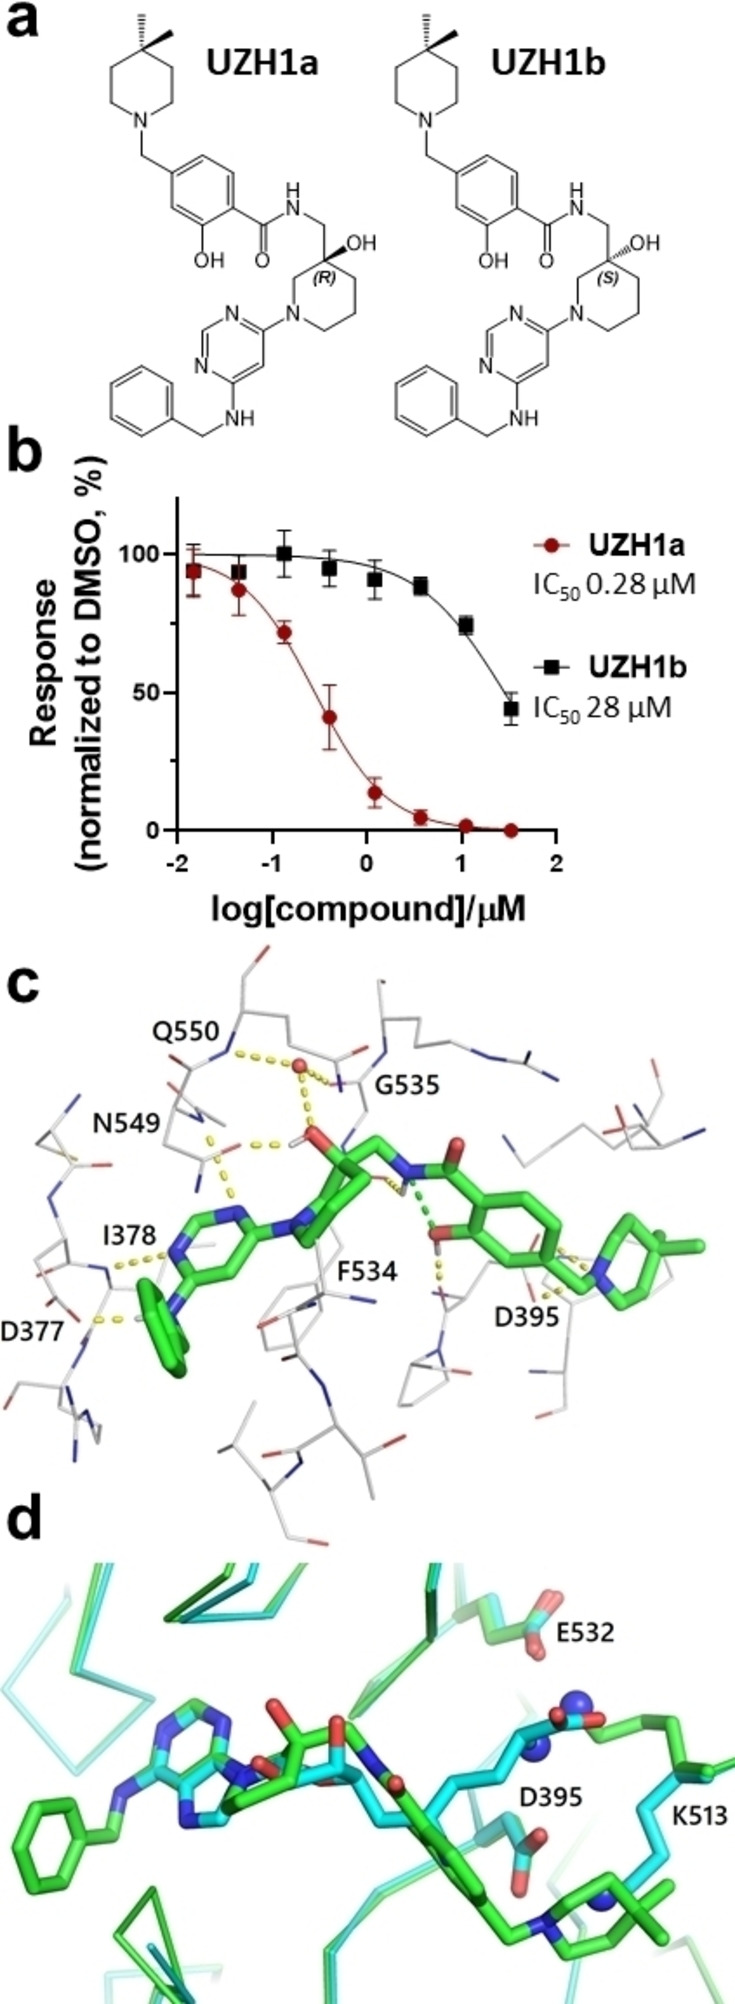
In vitro characterization of METTL3 inhibitors. (a) Chemical structures of UZH1a and UZH1b; absolute configuration was determined by X‐ray crystallography. (b) Enzymatic activity assay based on HTRF, mean±SD, N=4. (c) Crystal structure of METTL3/14 in complex with UZH1a (carbon atoms in green, PDB code 7ACD). Hydrogen bonds (yellow and green dashed lines) and a water molecule in contact with the inhibitor (red sphere) are shown. (d) Overlay of crystal structures of METTL3/14 in complex with UZH1a (carbon atoms in green) and METTL3/14 in complex with sinefungin (carbon atoms in cyan, PDB code 6Y4G). The amino groups involved in the castling‐like conformational change are highlighted (blue spheres on N atoms).
Table 1.
Kinases and protein methyltransferases selectivity profile of UZH1a at 10 μM.
|
Type |
Protein |
Remaining activity [%][a] |
Control IC50 [μM] |
Control compound[b] |
|
|---|---|---|---|---|---|
|
Replicate 1 |
Replicate 2 |
||||
|
methyltransferase |
DOT1L |
100 |
98 |
0.278 |
SAH |
|
G9a |
96 |
99 |
1.95 |
SAH |
|
|
MLL4 complex |
88 |
89 |
2.11 |
SAH |
|
|
PRDM9 |
101 |
101 |
3.98 |
chaetocin |
|
|
PRMT1 |
91 |
88 |
0.140 |
SAH |
|
|
SETD2 |
99 |
103 |
7.39 |
SAH |
|
|
SMYD3 |
88 |
92 |
18.7 |
SAH |
|
|
kinase |
Abl |
80 |
74 |
– |
– |
|
CDK2/cyclinA |
83 |
72 |
– |
– |
|
|
cKit |
95 |
101 |
– |
– |
|
|
DDR1 |
96 |
85 |
– |
– |
|
|
Flt3(D835Y) |
80 |
68 |
– |
– |
|
|
Fms |
92 |
102 |
– |
– |
|
|
JAK1 |
101 |
102 |
– |
– |
|
|
PDGFRα |
88 |
81 |
– |
– |
|
|
Pim‐1 |
100 |
95 |
– |
– |
|
|
ROCK‐I |
86 |
80 |
– |
– |
|
[a] The remaining activity is the percentage of enzymatic activity in the presence of 10 μM UZH1a with respect to the buffer solution containing DMSO. The closer to 100 % are these values, the weaker the inhibitory potency of UZH1a. [b] SAH=S‐(5′‐adenosyl)‐ʟ‐homocysteine.
UZH1a possesses favourable physicochemical properties and is therefore compatible with cell‐based experiments. Indeed, its molecular weight is relatively low (558 g/mol), and the octanol‐water partition coefficient logD7.4 of 2.6 is optimal for cell uptake. UZH1a was highly permeable (Papp>1 ⋅ 10−5 cm/s) in a Caco‐2 permeability assay used to evaluate intestinal uptake (Table 2). However, the efflux ratio of 2.3 suggests that UZH1a may be subject to active efflux. Importantly, the large difference in biochemical potency of UZH1a and UZH1b (>100‐fold, Figure 1b) allows for discrimination of non‐specific effects due to the chemical properties of the compounds and makes them highly suitable for mechanistic cellular studies.
Table 2.
Permeability of reference compounds and UZH1a in Caco‐2 cell assay.
|
Compound |
Direction |
Papp[10−6 cm/s] |
Papp(B−A)/Papp(A−B) |
|
|---|---|---|---|---|
|
Replicate 1 |
Replicate 2 |
|||
|
Metoprolol |
A‐B |
33.7 |
31.4 |
1.1 |
|
B‐A |
34.7 |
33.3 |
||
|
Atenolol |
A‐B |
0.5 |
0.4 |
2.0 |
|
B‐A |
0.9 |
1.0 |
||
|
Erythromycin |
A‐B |
0.3 |
0.2 |
62.9 |
|
B‐A |
18.1 |
17.5 |
||
|
UZH1a |
A‐B |
12.4 |
11.8 |
2.3 |
|
B‐A |
25.6 |
28.8 |
||
Papp‐apparent permeability coefficient, A‐apical, B‐basal.
Higher potency of UZH1a in comparison to UZH1b in the biochemical assay (Figure 1b) is consistent with higher thermal stabilization of the METTL3/14 construct by UZH1a than UZH1b in a protein thermal shift assay (Figure 2a, ΔTm=2.5 °C and 0.5 °C at 10 μM, respectively). This increased stabilization towards thermal denaturation allowed us to study UZH1a binding to its protein target directly in cells. HEK293T cells were transiently transfected with a plasmid encoding METTL3 catalytic domain (residues 356–580) tagged on its N‐terminus with ProLabel® (ePL) peptide (42 aa) to investigate the UZH1a and UZH1b binding in a cellular thermal shift assay based on the InCell Pulse platform (Figure 2b). We observed increased fusion protein abundance at 46 °C upon incubation with UZH1a, but not with UZH1b, with EC50 of 4 μM.
Figure 2.
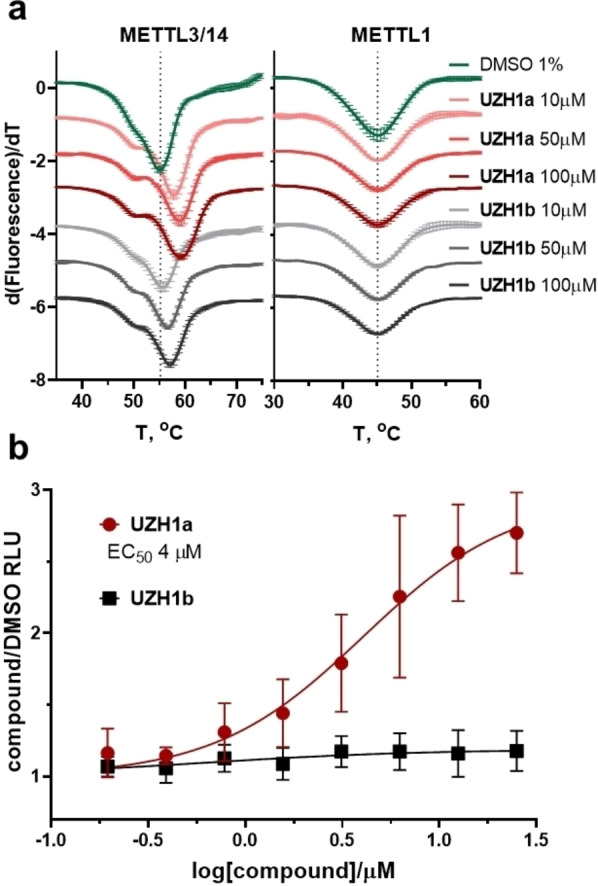
Protein thermal shift assay for METTL3/14 and METTL1 and cellular target engagement assay of UZH1a and UZH1b in HEK293T cells. (a) Results of the differential scanning fluorimetry (protein thermal shift assay) for METTL3/14 and METTL1 constructs. Derivative plot of the thermal denaturation curves of METTL3/14 and METTL1 in the presence of UZH1a (red), UZH1b (gray), or DMSO (green). Protein concentrations were 2 μM, mean±SD, N=3 (technical replicates). (b) Results of InCELL Pulse assay in HEK293T cells transfected with METTL3 construct and incubated with increasing concentrations of UZH1a and UZH1b for 1 h at 37 °C, followed by heating at 46 °C for 3 min. The soluble METTL3 fraction was quantified in luminescence‐based assay, DMSO‐treated cells served as normalization control, mean±SD, N=3–4 (biological replicates).
In line with the biochemical and cellular target engagement assays, we observed a dose‐dependent reduction in m6A methylation level in mRNA from the human leukemia cell line MOLM‐13 treated with UZH1a (IC50 of 7 μM), while UZH1b was less active at concentrations up to 100 μM in these cells, as determined by triple‐quadrupole LC mass spectrometry (Figure 3a). However, the effect of the m6A level depletion upon UZH1a treatment was attenuated by at least one order of magnitude in cells in comparison to the biochemical assay. This could be the consequence of cellular efflux (Table 2) or competition with high intracellular SAM/SAH levels. Interestingly, m6A level reduction in mRNAs followed a first‐order kinetics, with a maximum m6A inhibition level of 70 % and a half‐decay time τ of 1.8 h (Figure 3b).
Figure 3.
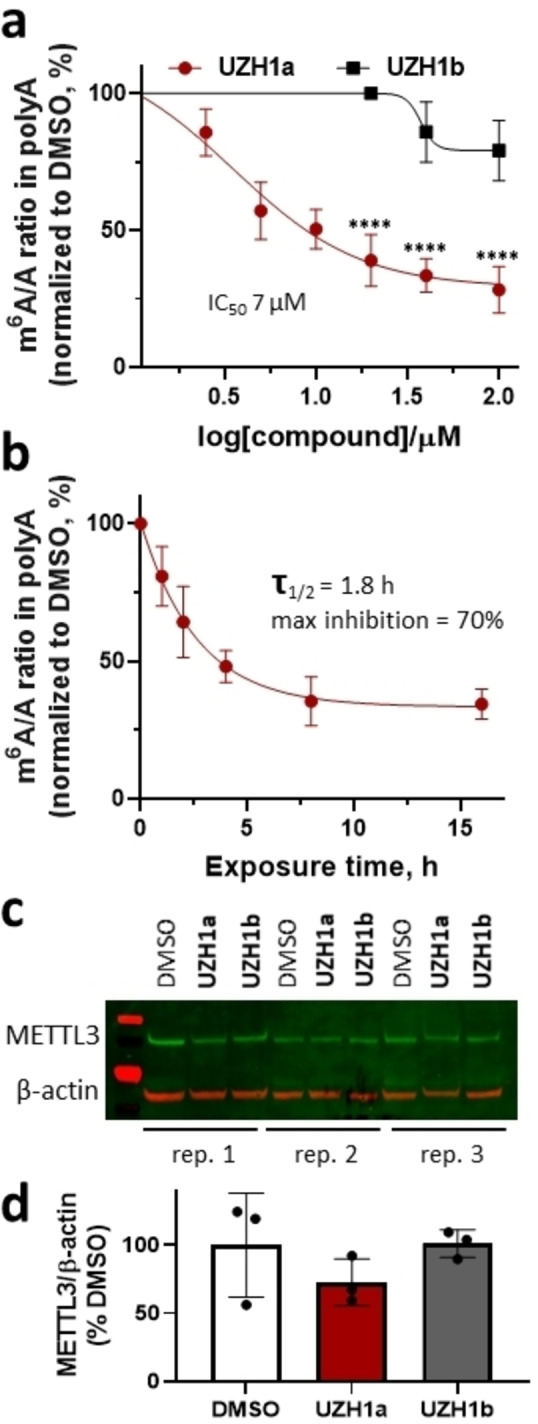
Cellular activity of the METTL3 inhibitor UZH1a in MOLM‐13 cells. (a) Results of UPLC‐MS/MS assay of m6A level in mRNA from MOLM‐13 cells upon UZH1a and UZH1b treatment at a dose range of 2.5 to 100 μM for 16 h, mean±SD, N=3–7 (biological replicates), ****p<0.0001 vs. UZH1b. (b) Kinetics of m6A level reduction in mRNA from MOLM‐13 cells upon UZH1a treatment at a dose of 40 μM for 1 to 16 h determined in UPLC‐MS/MS assay, mean±SD, N=3 (biological replicates), normalized to DMSO‐treated samples for each time point. (c) Western blotting of METTL3 expression level in MOLM‐13 cells after treatment with 40 μM of UZH1a and UZH1b for 16 h, N=3 (biological replicates). (d) Quantification of the METTL3 signal intensity relative to β‐actin in western blot images of compound treated versus DMSO only treated samples, mean±SD, N=3 (biological replicates).
The latter value is lower than the average mRNA half‐life in cells (≈10 h) [31] and is in line with the previously observed rapid degradation of m6A‐modified mRNAs.[ 4 , 32 , 33 ] We have verified that m6A level reduction was not caused by a reduction in METTL3 protein level (Figure 3c, d). Using UZH1a, we could, for the first time, directly estimate the average half‐life of m6A‐modified RNA in the cells. This result illustrates an important advantage of chemical inhibition of METTL3 over genetic manipulation, as it allows precise temporal control over METTL3 function due to the rapid cellular penetration of small‐molecule probes. One has to bear in mind that this method does not allow the decay of m6A‐modified mRNA to be distinguished from the potential demethylation of the transcripts via cellular ALKBH5. The latter, however, has been shown to affect only a small percentage of mRNAs after transcription. [4]
We confirmed that UZH1a was able to reduce m6A/A levels in mRNA fraction not only in the leukemia cell line MOLM‐13 but also in at least two other cell lines (i. e., osteosarcoma U2OS cells and immortalized human embryonic kidney cell line HEK293T, Figure 4a). However, the m6A level reduction IC50 values were slightly higher in these cell lines in comparison to MOLM‐13 cells (9 and 15 μM vs. 7 μM, respectively). Importantly, the ability to inhibit cellular m6A levels in mRNA fraction was preserved for at least 6 days (Figure 4b).
Figure 4.

Cellular activity of the METTL3 inhibitor UZH1a and siRNA‐mediated METTL3 knockdown in HEK293T and U2OS cells. (a) Results of UPLC‐MS/MS assay of m6A level in mRNA from U2OS and HEK293T cells upon UZH1a treatment at a dose range of 2.5 to 100 μM for 16 h, mean±SD, N=3 (biological replicates), normalized to DMSO‐treated samples for each cell line. (b) Results of UPLC‐MS/MS assay of modified nucleosides level in mRNA fraction and in total RNA from U2OS cells upon 40 μM UZH1a treatment for 3 and 6 days, mean±SD, N=3 (biological replicates), normalized to DMSO‐treated samples. (c) Representative results of western blotting analysis of METTL3 protein level in HEK293T and U2OS cells after 72‐h transfection with 50 nM of siRNA targeting METTL3 (siM3), negative control siRNA (siNC), or in non‐transfected cells (NT). Quantification of the METTL3 signal intensity relative to β‐actin in western blot images of siRNA‐treated versus non‐transfected (NT) samples, mean±SD, N=3 (biological replicates). (d) Results of UPLC‐MS/MS assay of m6A level in mRNA from HEK293T and U2OS cells after 72‐h transfection with 50 nM of siRNA targeting METTL3 (siM3) or negative control siRNA (siNC), normalized to non‐transfected cells (NT), mean±SD, N=3–4 (biological replicates).
Interestingly, siRNA‐mediated METTL3 knockdown in both HEK293T and U2OS failed to adequately reduce m6A levels in mRNA despite the strong reduction of METTL3 protein level (over 80 %, Figure 4c, d). It has previously been observed that even a low residual level of METTL3 expression can maintain m6A/A ratio in cells. [34] These findings illustrate yet another advantage of our inhibitor that is able to rapidly reduce m6A levels up to 75 % in a dose‐dependent manner in a range of cell lines, and, therefore, comprises a valuable tool to probe various cellular functions of m6A‐modified mRNAs.
In order to evaluate the selectivity of our METTL3 inhibitor towards other RNA methyltransferases in cells, we analysed the levels of m6A as well as other RNA modifications (i. e., m6Am, m1A, m7G) in total RNA. It is known that m6A is present in other RNA species[ 6 , 7 , 35 , 36 , 37 ] and is installed in rRNAs by enzymes other than METTL3 (i. e., METTL5/TRMT112 for 18S and ZCCHC4 for 28S ribosomal subunits, respectively).[ 35 , 36 ] The average half‐life of rRNAs and tRNAs, presenting the major RNA component in cells, is much longer than that of mRNA.[ 31 , 38 ] Therefore, prolonged incubation times are necessary to evaluate potential non‐specific inhibition of the methyltransferases modifying these RNA types. We studied the levels of m6A, m6Am, m1A, m7G in total RNA of U2OS cells treated with 40 μM of UZH1a for 3 and 6 days and observed virtually no changes in these modifications (Figure 4b). In addition to the LC‐MS/MS analysis of m7G methylation levels in total RNA after UZH1a treatment (Figure 4b), we used mechanistic protein thermal shift assay to confirm the absence of binding of our compound UZH1a to METTL1 (Figure 2a), an enzyme responsible for m7G installation on tRNA,[ 39 , 40 ] mRNA, [41] and miRNA. [42] Overall, these results point out the exceptional selectivity of UZH1a towards other RNA methyltransferases.
Conclusion
Chemical probes that target proteins involved in the m6A modification of RNA are essential for understanding the complexity of this epitranscriptomic regulatory network. Furthermore, they are also valuable starting points for designing novel drugs against several diseases ranging from cancer to viral infections. Here, we have characterized a small‐molecule inhibitor of METTL3 by protein crystallography, a biochemical binding assay, and a battery of cellular assays. Our METTL3 inhibitor UZH1a shows high‐nanomolar potency in the biochemical assay, good selectivity against a panel of protein methyltransferases and kinases, and is active in cells. Importantly, METTL3 chemical inhibition reduced the m6A/A ratio in mRNAs of three different cell lines (AML MOLM‐13 cells, osteosarcoma U2OS cells, and the embryonic kidney cell line HEK293T). In addition, we confirmed the selectivity of our compound towards other RNA methyltransferases in a protein thermal shift assay as well as in living cells. The crystal structure of METTL3/14 in complex with UZH1a has revealed its binding mode and is used as the basis for the development of more potent inhibitors. Future work will focus on the implications of METTL3 inhibition in various disease models.
Experimental Section
Compound characterization
UZH1a
Purity >95 %, confirmed by supercritical fluid chromatography (SFC).
1 H NMR (500 MHz, CD3OD) δ 7.95 (s, 1H), 7.82 (d, J=8.0 Hz, 1H), 7.31–7.24 (m, 4H), 7.23–7.18 (m, 1H), 6.90 (s, 1H), 6.86 (d, J=8.0 Hz, 1H), 5.58 (s, 1H), 4.38 (s, 2H), 3.64–3.37 (m, 8H), 2.52 (s, 4H), 1.84–1.74 (m, 2H), 1.72–1.59 (m, 2H), 1.43 (t, J=5.6 Hz, 4H), 0.94 (s, 6H).
13 C NMR (126 MHz, CD3OD) δ 170.7, 164.4, 163.8, 161.8, 158.2, 144.0, 140.4, 129.9, 129.6, 128.3, 128.1, 120.8, 120.0, 117.2, 82.6, 71.8, 63.5, 52.8, 50.9, 47.1, 45.9, 45.5, 39.0, 35.3, 29.1, 28.4, 22.6. Five carbon signals are missing due to overlapping of equivalent signals.
HRMS (ESI): m/z: calculated for C32H43N6O3 + [M+H+]: 559.33912 found: 559.33851.
UZH1b
Purity >95 %, confirmed by SFC.
1 H NMR (500 MHz, CD3OD) δ 7.95 (s, 1H), 7.83 (d, J=8.0 Hz, 1H), 7.31–7.24 (m, 4H), 7.23–7.18 (m, 1H), 6.91 (s, 1H), 6.88 (d, J=8.0 Hz, 1H), 5.58 (s, 1H), 4.38 (s, 2H), 3.64–3.37 (m, 8H), 2.54 (s, 3H), 1.84–1.74 (m, 2H), 1.72–1.59 (m, 2H), 1.44 (t, J=5.6 Hz, 4H), 0.94 (s, 6H).
13 C NMR (126 MHz, CD3OD) δ 170.7, 164.4, 163.7, 161.7, 158.2, 143.7, 140.4, 129.9, 129.6, 128.3, 128.1, 121.0, 120.0, 117.2, 82.5, 71.8, 63.4, 52.8, 50.9, 47.1, 45.9, 45.5, 38.9, 35.3, 29.1, 28.5, 22.6. Five carbon signals are missing due to overlapping of equivalent signals.
HRMS (ESI): m/z: calculated for C32H43N6O3 + [M+H+]: 559.33912 found: 559.33848.
IR (cm−1, neat): 418, 426, 438, 452, 471, 488, 498, 513, 547, 555, 592, 608, 668, 697, 733, 748, 778, 798, 826, 873, 977, 1027, 1114, 1150, 1171, 1226, 1260, 1306, 1329, 1362, 1431, 1453, 1496, 1505, 1548, 1595, 2922, 2948, 3323.
Protein expression and purification
Recombinant METTL3354‐580‐METTL14106‐396 complex constructs for crystallization and for the use in enzymatic activity and protein thermal shift assays were expressed using the baculovirus/Sf9 insect cell expression system as previously described. [25]
The plasmid expressing the N‐terminally hexahistidine‐tagged METTL1 protein was a gift from Cheryl Arrowsmith (Addgene ID: 25264). The protein was overexpressed for 12 hours at 20 °C in Escherichia coli BL21 (DE3) cells upon induction with 0.2 mM IPTG. The cells were harvested and resuspended in the lysis buffer containing 100 mM Tris‐HCl at pH 8.0 and 500 mM NaCl. The cells were lysed by sonication and the cell lysate was clarified by centrifugation at 50’000 g for two hours and loaded onto Ni‐NTA affinity column (5 mL HisTrap FF from GE Healthcare). After extensive washing with the wash buffer containing 100 mM Tris‐HCl at pH 8.0, 500 mM NaCl and 50 mM imidazole the target protein was eluted with elution buffer containing 100 mM Tris‐HCl at pH 8.0, 500 mM NaCl and 250 mM imidazole. The N‐terminal hexahistidine‐tag was removed by cleavage with tobacco etch virus (TEV) protease at 1 : 50 ratio. The excess imidazole was removed by overnight dialysis and the sample was subjected to secondary subtractive Ni‐NTA affinity chromatography step to remove the protease and uncleaved protein. Finally, the protein was subjected to a gel filtration step using Superdex 75 16/60 column in a buffer containing 10 mM Tris‐HCl at pH 8, 150 mM NaCl.
Differential scanning fluorimetry (thermal shift assay)
Thermal shift assay was performed as previously described with slight modifications. [43] Briefly, protein (METTL1 or METTL3/14) at a final concentration of 2 μM was mixed with UZH1a or UZH1b at final concentrations of 10, 50, 100 μM in a final volume of 20 μL in a buffer system consisting of 50 mM HEPES at pH 7.5 and 150 mM NaCl. DMSO concentration was kept at 1 % (v/v). SYPRO Orange was added at a final dilution of 1 : 1000 (v/v) as a fluorescence probe (ex/em 465/590 nm). Differential scanning fluorimetry was performed on a LightCycler® 480 Instrument II (Roche Diagnostics, Indianapolis, IN). The temperature was raised with a step of 3.6 °C per minute from 20 °C to 85 °C and fluorescence readings were taken at each interval. The reported values (ΔTm) are calculated as the difference between the transition midpoints of an individual sample and the average of the reference wells (containing the protein and the DMSO only) in the same plate.
Reader‐based HTRF assay of METTL3 inhibition in vitro
Compound potencies were evaluated by using a previously reported METTL3 inhibition assay. [30] Briefly, the level of m6A in the oligoribonucleotide substrate after the reaction catalyzed by METTL3‐METTL14 was quantified by measuring specific binding of modified oligoribonucleotide to the m6A reader YTHDC1345‐509 by homogeneous time‐resolved fluorescence (HTRF). Tested compounds that inhibit METTL3 decrease the m6A level and, thus, reduce the HTRF signal. Response curves were plotted in GraphPad Prism 8.4 and fitted with nonlinear regression “log(inhibitor) vs. normalized response‐variable slope”, from which IC50 values were determined. The IC50 values are given as an average of at least three independent measurements for each compound.
Protein crystallization
The protein crystals of METTL3354‐580‐METTL14106‐396 were obtained as previously described. [25] Briefly, purified METTL3/14 complex was diluted to 5 mg/mL in 10 mM Tris‐Cl pH 8.0, 200 mM NaCl. Crystals were obtained using the hanging drop vapor diffusion by mixing 1 mL complex solution with 1 mL reservoir solution containing 20 % PEG3350 and 400 mM of magnesium acetate. The soaking experiment was carried out by transferring crystals to a 1 μL drop containing 100 mM compound directly dissolved in the buffer containing 30 % PEG3350, and 400 mM magnesium acetate. After 16‐h incubation at 22 °C, the crystals were harvested and flash‐frozen in liquid nitrogen.
Data collection and structure solution
Diffraction data were collected at the PXIII beamline at the Swiss Light Source (SLS) of the Paul Scherrer Institute (PSI, Villigen, Switzerland) and processed using XDS as previously described. [29] The crystal structures were solved by molecular replacement by employing the 5 L6D structure as the search model in the Phaser program [44] (Phenix package). In the crystals not subjected to soaking, clear electron density for product cofactor S‐adenosyl‐ʟ‐homocysteine (SAH) is visible. Therefore, in this soaking experiment setup test compounds competed with SAH for the S‐adenosyl‐ʟ‐methionine (SAM) binding site. In the crystal structure of UZH1a, the electron density due to the homocysteine part of SAH was no longer visible. All of the crystallographic models were constructed through iterative cycles of manual model building with COOT [45] and refinement with phenix.refine. [46] Default XYZ (reciprocal‐space), XYZ (real‐space), individual B‐factors and occupancies refinement parameters appropriate for the resolution range were utilized. During the first run of the refinement update water was used in phenix.refine followed by addition of the missing water molecules manually.
Selectivity profiling
For kinase inhibition testing, Merck‐Millipore KinaseProfiler™ assay (radiometric, activity testing) was performed by Eurofins (Luxembourg). UZH1a was tested in single dose mode, in duplicate, at 10 μM, concentration of ATP was 10 μM. The required volume of the 50× stock of UZH1a in DMSO was added to the assay well, before a reaction mix containing an enzyme and substrate was added. The reaction was initiated by the addition of ATP. There was no pre‐incubation of the compound with the enzyme/substrate mix prior to ATP addition. For further details of each individual assay, please refer to the company's website.
For protein methyltransferase inhibition testing, HotSpot Methyltransferase Profiling assay was performed by Reaction Biology Corporation (Malvern, PA). UZH1a was tested in single dose mode, in duplicate, at 10 μM. Control compounds, SAH (S‐(5′‐adenosyl)‐ʟ‐homocysteine) or chaetocin, were tested in 10‐dose IC50 mode with 3‐fold serial dilution starting at 100 or 200 μM. Reactions were carried out at 1 μM SAM.
Caco‐2 cell permeability assay
The UZH1a intestinal permeability has been evaluated in Caco‐2 cell permeability assay by ChemPartner (Shanghai, China) following standard procedures. Briefly, Caco‐2 monolayer cells were cultured in Millicell‐24® cell culture plates (Merk Millipore; surface area of the membrane=0.7 cm2, VA=0.8 mL (A‐to‐B) or 0.4 mL (B‐to‐A)). The cell permeability of UZH1a along with the reference compounds (i. e., erythromycin, metoprolol, and atenolol) was tested at 10 μM in HBSS buffer containing 0.4 % DMSO (v/v) final concentration. The compounds were placed either in apical or basolateral chamber, and their concentrations were evaluated in both compartments after the 90‐min incubation at 37 °C using the API 4000™ LC/MS/MS system (Applied Biosystems, Waltham, MA). The Caco‐2 monolayer's leakiness after the treatment was evaluated by measuring concentrations of a fluorescent dye Lucifer Yellow with low cell permeability (5 μM initial concentration) using a fluorometer (at Ex/Em of 485/535 nm). Lucifer Yellow Papp values were lower than 1 ⋅ 10−6 cm/s, and transepithelial electrical resistance (TEER) values were higher than 400 Ω ⋅ cm2, verifying that the Caco‐2 monolayers were intact. Mass recovery of UZH1a was 82.4 % (A‐to‐B) and 92.4 % (B‐to‐A), indicating low non‐specific adsorption to the assay chambers. Compound permeability was evaluated in duplicates.
Compound permeability was calculated according to the following equation, where VA is the volume in the acceptor well, area is the surface area of the membrane and time is the total transport time in seconds:
Lucifer Yellow permeability was calculated according to the following equation:
Compound recovery was calculated according to the following equation:
Transepithelial electrical resistance (TEER) was calculated according to the following equation:
Cell culture
U2OS and HEK293T cells were maintained in DMEM medium supplemented with 4.5 g/L glucose, GlutaMAXTM, 10 % Gibco™ FBS, and 1 % penicillin/streptomycin (complete medium) in 5 % CO2 at 37 °C in a humidified incubator, with regular passaging twice a week using 1 : 5 split ratio. MOLM‐13 cells were cultured in RPMI 1640 medium containing 10 % Gibco™ FBS and 1 % penicillin/streptomycin (complete medium) in 5 % CO2 at 37 °C in a humidified incubator, with maintained cell densities at 0.6–2 ⋅ 106 cells/mL. All cell lines have been authenticated by cell line typing (external service provided by Microsynth, Switzerland). All cell lines were tested negative for mycoplasma contamination (PCR‐based assay by Microsynth, Switzerland).
Cellular target engagement assay InCELL Pulse
Gene encoding METTL3 catalytic domain (residue 356–580) was amplified using primers listed below:
pICP−N‐M3‐F: ATATGAATTCACACAGAGTGTCGGAGGTGATTCC
pICP−N‐M3‐R: ATGCTCTAGATTATAAATTCTTAGGTTTAGAGATGATACCATCTGGG
The amplified gene was ligated into the pICP‐ePL‐N vector between EcoRI and XbaI restriction sites
Cellular target engagement of the compounds was evaluated using InCELL Pulse assay according to the manufacturer's instructions. Briefly, HEK293T cells were seeded at 1 ⋅ 106 cells/well in 2 mL complete medium in a 6‐well plate and transfected with 1.5 μg of the plasmid encoding enhanced ProLabel® (ePL) enzyme fragment (42 aa) fused to the N‐terminus of the METTL3 catalytic domain (residues 354–580) using Lipofectamine RNAiMAX for 24 h. After the transfection, cells were washed once with Opti‐MEM medium, detached from the plate by gentle washing and counted. Forty microliters of Opti‐MEM medium containing 5000 transfected cells were mixed with 10 μL of 5× compound (UZH1a or UZH1b) solution in Opti‐MEM or 2.5 % (v/v) of DMSO (5×) as a negative control and incubated for 1 h at 37 °C. After the incubation, cells were heated at 46 °C for 3 min followed by incubation at 22 °C for 3 min, and the non‐aggregated METTL3‐ePL protein was quantified using luminescence‐based assay according to the InCELL Pulse kit's instructions.
Quantification of m6A/A ratio in polyadenylated RNA and total RNA by UPLC‐MS/MS analysis
MOLM‐13 cells were seeded into 6 well plates at a density of 1 ⋅ 106 cells/mL in 2 mL of complete RPMI medium. U2OS cells were seeded at 5 ⋅ 105 cells/well in a 6‐well plate, whereas HEK293T cells were seeded at 1 ⋅ 106 cells/well. After 24 h, cells were treated with increasing concentrations of UZH1a or UZH1b in DMSO or DMSO alone as a negative control (final concentration of DMSO 0.5 % (v/v)) for indicated time points. For the long‐term incubation studies, U2OS cells were seeded at 1.5 ⋅ 105 cells/well in a 6‐well plate. After 24 h, cells were treated with 40 μM of UZH1a in DMSO or DMSO alone as a negative control (final concentration of DMSO 0.5 % (v/v)) for 3 days or, after reseeding at 1.5 ⋅ 105 cells/well and adding fresh compound, 6 days in total. Following incubation in cell culture incubator, cells were washed once with PBS, and total RNA was extracted using 0.5 mL of GENEzol™ reagent according to manufacturer‘s instructions. The final volume of 50 μL of total RNA eluate was subjected to two rounds of purification using 25 μL Sera‐Mag magnetic oligo(dT) particles per sample. The polyadenylated RNA was eluted with nuclease‐free water in a final volume of 25 μL, and its concentration was determined using NanoDrop. One hundred nanograms of mRNA was digested to nucleosides and dephosphorylated in a one‐pot reaction using 0.5 μL of nucleoside digestion mix in 25 μL of total reaction volume for 4 hours at 37 °C. The samples were used for UPLC‐MS/MS analysis without further purification steps.
Nucleoside UPLC‐MS/MS was performed at the Functional Genomics Centre Zurich following previously described procedures with slight modifications.[47][48] Briefly, the samples were diluted 10 or 100‐fold in solvent A (0.1 % (v/v) formic acid in water), separated using a Waters Aquity M class (Waters) UPLC and detected with a TSQ Quantiva (Thermo Scientific) mass spectrometer by using a nano electrospray ionization (ESI) source in SRM mode. Analytes were separated on an HSS T3 column (particle size 1.8 μm, dimensions 0.15×60 mm). The mobile phases used for elution were A 0.1 % (v/v) formic acid in water and B 0.1 % (v/v) formic acid in acetonitrile at a flow rate of 2 μL/min, column temperature was ambient, sample temperature was 8 °C, injection volume was set to 1 μL, and sample loop volume was 1 μL. The analytes were separated following a gradient of 0–4 min 12.5 % B, 4–4.1 min 99 % B, 4.1–4.6 min 12.5 % B, 6 min 12.5 % B. Adenosine, m6A, m1A, and m6Am eluted at 3.30 min, 3.44 min, 2.89 min, and 3.56 min, respectively. Guanosine and m7G eluted at 3.34 min and 3.27 min, respectively. The mass spectrometer was operated using the following parameters: ESI positive ion mode, SRM acquisition mode, capillary voltage 3 kV, source temperature 300 °C, collision energy of 15 V for adenosine and guanosine, 20 V for m7G, and 25 V for m6A, m1A, and m6Am. Adenosine, m6A, m1A, and m6Am were detected by monitoring precursor to product transitions of m/z = 268.1→136.1, m/z = 282.1→150.1, m/z = 282.1→150.1, and m/z = 296.1→152.1, respectively. Guanosine and m7G were detected by monitoring precursor to product transitions of m/z = 284.1→136.1 and m/z=298.1→166.1, respectively. Absolute concentrations of adenosine, guanosine, m6A, m1A, m6Am, and m7G in the samples were determined based on an external calibration curve generated using adenosine (Sigma‐Aldrich, 01890–5G), guanosine (Sigma‐Aldrich, G6264‐1G), m6A (Chemie Brunschwig, CBLQB‐1055‐1 g), m1A (MedChem Express, MCE‐HY‐113081), m6Am (Toronto Research Chemicals, D447415), and m7G (Sigma‐Aldrich, M0627‐100MG) nucleoside standards. The modified‐to‐nonmodified nucleoside ratio of compound‐treated samples were normalized to the corresponding value of DMSO‐treated negative control. All measurements were performed in technical duplicates and repeated in at least three biological replicates on different days. Inhibition curves were plotted in GraphPad Prism 8.4 and fitted with nonlinear regression “log(inhibitor) vs. normalized response‐variable slope” with the maximal inhibition fixed at 80 %, from which IC50 values were determined.
RNAi‐mediated knockdown of METTL3
For western blotting experiments, HEK293T or U2OS cells were seeded in 6‐well plates at a density of 1.5 ⋅ 105 cells/well in 2 mL of complete DMEM medium, transfected with total 50 nM of METTL3‐targeting siRNA mix (at equimolar ratio) or negative control siRNA using Lipofectamine® RNAiMAX according to manufacturer's instructions, and incubated at 37 °C with 5 % CO2. The sequences of siRNAs are provided in the materials section. After 72 h, cells were analyzed for METTL3 protein expression using western blotting as described in the western blotting section.
To evaluate the effect of METTL3 knockdown on m6A/A level in polyadenylated RNA, HEK293T or U2OS cells were seeded in 6‐well plates and transfected as described above. After 72 h, m6A/A ratio reduction in polyadenylated RNA was evaluated as described in UPLC‐MS/MS analysis section. The assay was repeated three times on different days.
Western blotting
For immunodetection of METTL3 expression level after the compound exposure, MOLM‐13 cells were seeded at 1 ⋅ 106 cells/mL in a 6‐well plate in complete RPMI media. The next day, cells were treated with the indicated doses of compounds. After 16 hours of treatment, cells were collected by centrifugation, washed once with PBS, and resuspended in 200 μL of RIPA buffer (150 mM sodium chloride, 1 % (v/v) IGAPAL CA630, 0.5 % (w/v) sodium deoxycholate, 0.1 % (v/v) sodium dodecyl sulphate, 50 mM Tris‐HCl) with added protease inhibitor cocktail (1× final concentration). After incubating for 30 minutes on ice, cell lysates were centrifuged for 15–20 minutes at 16000×g at 4 °C to remove cell debris, and the supernatant containing proteins was collected. The protein concentration was quantified with Pierce™ Coomassie (Bradford) protein assay kit, and 30 μg of protein was loaded per well on a SurePAGE 12 % Bis‐Tris polyacrylamide gel. Following electrophoresis, the proteins were transferred to methanol‐activated low fluorescence PVDF membrane using Trans‐Blot® Turbo™ Transfer System (Bio‐Rad, Hercules, CA) according to manufacturer‘s instructions. The membrane was then blocked with 5 % non‐fat milk and incubated with anti‐METTL3 rabbit (1 : 1000) and anti‐β‐actin mouse (1 : 5000) antibodies overnight at 4 °C. The next day, the membrane was washed 3 times with PBST (PBS with 0.1 % (v/v) Tween‐20) and incubated with IRDye® 800CW goat anti‐rabbit IgG and IRDye® 680RD donkey anti‐mouse IgG secondary antibodies (1 : 10000) for 2 hours at room temperature. After incubation, the membrane was again washed three times in PBST, and fluorescence signal was detected on Odyssey® CLx Imaging System (LI‐COR). The band intensity in each lane was quantified using Image Studio Lite Version 5.2.5 (LI‐COR). For the detection of METTL3 protein in U2OS and HEK293T cells following the siRNA‐mediated knockdown, the cells were washed with PBS and lysed in 60 μL of lysis buffer. Cell lysates were probed for METTL3 expression as described above.
Statistical analysis
The statistical analysis was performed using GraphPad Prism software. Multiple experimental groups were compared pairwise using the one‐way analysis of variance (ANOVA) followed by Tukey's post‐hoc test unless stated otherwise, normality was assessed using Shapiro‐Wilk test. The differences between treatment groups were considered statistically significant at p‐values lower than 0.05.
Conflict of interest
The authors declare no conflict of interest.
Supporting information
As a service to our authors and readers, this journal provides supporting information supplied by the authors. Such materials are peer reviewed and may be re‐organized for online delivery, but are not copy‐edited or typeset. Technical support issues arising from supporting information (other than missing files) should be addressed to the authors.
Supporting Information
Acknowledgements
The authors thank Yuanding Chen (Shanghai Medicilon Inc.) for the synthesis of the UZH1a and UZH1b compounds and Eleen Laul for her help with chemical characterization of the compounds. The authors are grateful to Beat Blattmann for his help with setting up protein crystallization trials. We thank the staff at the Swiss Light Source (Paul Scherrer Institute) for their support with data collection. We thank the Swiss National Supercomputing Centre (CSCS) in Lugano for providing the computational resources. We also thank Dr. Endre Laczko and Dr. Stefan Schauer from Functional Genomics Center Zurich for their help with UPLC‐MS/MS analysis. We thank Dr. Paweł Śledź, Dr. Katherine Rollins, Prof. Dr. Marianne Hürzeler, and Dr. Claude Schärer for interesting discussions. We also thank Dr. Katherine Rollins for reading the manuscript and very useful suggestions for improving its clarity. This work was supported financially by the Swiss National Science Foundation (E.M.‐O., grant CRSK‐3_190825; A.C., Excellence grant 310030B‐189363) and the Swiss Cancer Research foundation (E.M.‐O., A.C., grant KFS‐5016‐02‐2020).
E. V. Moroz-Omori, D. Huang, R. Kumar Bedi, S. J. Cheriyamkunnel, E. Bochenkova, A. Dolbois, M. D. Rzeczkowski, Y. Li, L. Wiedmer, A. Caflisch, ChemMedChem 2021, 16, 3035.
Contributor Information
Dr. Elena V. Moroz‐Omori, Email: elena.omori@uzh.ch.
Prof. Amedeo Caflisch, Email: caflisch@bioc.uzh.ch.
References
- 1. Vu L. P., Cheng Y., Kharas M. G., Cancer Dis. 2019, 9, 25–33. [DOI] [PubMed] [Google Scholar]
- 2. Kadumuri R. V., Janga S. C., Trends Mol. Med. 2018, 24, 886–903. [DOI] [PMC free article] [PubMed] [Google Scholar]
- 3. Fu Y., Dominissini D., Rechavi G., He C., Nat. Rev. Genet. 2014, 15, 293–306. [DOI] [PubMed] [Google Scholar]
- 4. Ke S., Pandya-Jones A., Saito Y., Fak J. J., Vågbø C. B., Geula S., Hanna J. H., Black D. L., Darnell J. E., Darnell R. B., Genes Dev. 2017, 31, 990–1006. [DOI] [PMC free article] [PubMed] [Google Scholar]
- 5. Patil D. P., Chen C.-K., Pickering B. F., Chow A., Jackson C., Guttman M., Jaffrey S. R., Nature 2016, 537, 369–373. [DOI] [PMC free article] [PubMed] [Google Scholar]
- 6. Zhao B. S., Roundtree I. A., He C., Nat. Rev. Mol. Cell Biol. 2017, 18, 31–42. [DOI] [PMC free article] [PubMed] [Google Scholar]
- 7. Pendleton K. E., Chen B., Liu K., Hunter O. V., Xie Y., Tu B. P., Conrad N. K., Cell 2017, 169, 824–835.e14. [DOI] [PMC free article] [PubMed] [Google Scholar]
- 8. Ianniello Z., Paiardini A., Fatica A., Front. Oncol. 2019, 9, 1–11. [DOI] [PMC free article] [PubMed] [Google Scholar]
- 9. Barbieri I., Tzelepis K., Pandolfini L., Shi J., Millán-Zambrano G., Robson S. C., Aspris D., Migliori V., Bannister A. J., Han N., De Braekeleer E., Ponstingl H., Hendrick A., Vakoc C. R., Vassiliou G. S., Kouzarides T., Nature 2017, 552, 126–131. [DOI] [PMC free article] [PubMed] [Google Scholar]
- 10. Vu L. P., Pickering B. F., Cheng Y., Zaccara S., Nguyen D., Minuesa G., Chou T., Chow A., Saletore Y., MacKay M., Schulman J., Famulare C., Patel M., Klimek V. M., Garrett-Bakelman F. E., Melnick A., Carroll M., Mason C. E., Jaffrey S. R., Kharas M. G., Nat. Med. 2017, 23, 1369–1376. [DOI] [PMC free article] [PubMed] [Google Scholar]
- 11. Zhang W., He X., Hu J., Yang P., Liu C., Wang J., An R., Zhen J., Pang M., Hu K., Ke X., Zhang X., Jing H., Oncol. Lett. 2019, 18, 3682–3690. [DOI] [PMC free article] [PubMed] [Google Scholar]
- 12. Kumar S. R., Taylor K. H., Bryan J. N., Eaton A. M., Rna Dis. 2017, 2–7. [Google Scholar]
- 13. Cheng M., Sheng L., Gao Q., Xiong Q., Zhang H., Wu M., Liang Y., Zhu F., Zhang Y., Zhang X., Yuan Q., Li Y., Oncogene 2019, 38, 3667–3680. [DOI] [PubMed] [Google Scholar]
- 14. Han J., Wang J. Z., Yang X., Yu H., Zhou R., Lu H. C., Yuan W. B., Lu J. C., Zhou Z. J., Lu Q., Wei J. F., Yang H., Mol. Cancer 2019, 18, 1–15. [DOI] [PMC free article] [PubMed] [Google Scholar]
- 15. Wei W., Huo B., Shi X., Cancer Manag. Res. 2019, 11, 1177–1187. [DOI] [PMC free article] [PubMed] [Google Scholar]
- 16. Choe J., Lin S., Zhang W., Liu Q., Wang L., Ramirez-Moya J., Du P., Kim W., Tang S., Sliz P., Santisteban P., George R. E., Richards W. G., Wong K.-K., Locker N., Slack F. J., Gregory R. I., Nature 2018, 561, 556–560. [DOI] [PMC free article] [PubMed] [Google Scholar]
- 17. Hua W., Zhao Y., Jin X., Yu D., He J., Xie D., Duan P., Gynecol. Oncol. 2018, 151, 356–365. [DOI] [PubMed] [Google Scholar]
- 18. Miao W., Chen J., Jia L., Ma J., Song D., Biochem. Biophys. Res. Commun. 2019, 516, 719–725. [DOI] [PubMed] [Google Scholar]
- 19. Li T., Hu P. S., Zuo Z., Lin J. F., Li X., Wu Q. N., Chen Z. H., Zeng Z. L., Wang F., Zheng J., Chen D., Li B., Kang T. B., Xie D., Lin D., Ju H. Q., Xu R. H., Mol. Cancer 2019, 18, 1–15. [DOI] [PMC free article] [PubMed] [Google Scholar]
- 20. Chen M., Wei L., Law C. T., Tsang F. H. C., Shen J., Cheng C. L. H., Tsang L. H., Ho D. W. H., Chiu D. K. C., Lee J. M. F., Wong C. C. L., Ng I. O. L., Wong C. M., Hepatology 2018, 67, 2254–2270. [DOI] [PubMed] [Google Scholar]
- 21. Wang Q., Chen C., Ding Q., Zhao Y., Wang Z., Chen J., Jiang Z., Zhang Y., Xu G., Zhang J., Zhou J., Sun B., Zou X., Wang S., Gut 2020, 69, 1193–1205. [DOI] [PubMed] [Google Scholar]
- 22. Dominissini D., Moshitch-Moshkovitz S., Schwartz S., Salmon-Divon M., Ungar L., Osenberg S., Cesarkas K., Jacob-Hirsch J., Amariglio N., Kupiec M., Sorek R., Rechavi G., Nature 2012, 485, 201–206. [DOI] [PubMed] [Google Scholar]
- 23. Knuckles P., Lence T., Haussmann I. U., Jacob D., Kreim N., Carl S. H., Masiello I., Hares T., Villaseñor R., Hess D., Andrade-Navarro M. A., Biggiogera M., Helm M., Soller M., Bühler M., Roignant J.-Y., Genes Dev. 2018, 32, 415–429. [DOI] [PMC free article] [PubMed] [Google Scholar]
- 24. Wang X., Feng J., Xue Y., Guan Z., Zhang D., Liu Z., Gong Z., Wang Q., Huang J., Tang C., Zou T., Yin P., Nature 2016, 534, 575–578. [DOI] [PubMed] [Google Scholar]
- 25. Śledź P., Jinek M., eLife 2016, 5, 1–16. [DOI] [PMC free article] [PubMed] [Google Scholar]
- 26. Wang P., Doxtader K. A., Nam Y., Mol. Cell 2016, 63, 306–317. [DOI] [PMC free article] [PubMed] [Google Scholar]
- 27. Oerum S., Catala M., Atdjian C., Brachet F., Ponchon L., Barraud P., Iannazzo L., Droogmans L., Braud E., Ethève-Quelquejeu M., Tisné C., RNA Biol. 2019, 16, 798–808. [DOI] [PMC free article] [PubMed] [Google Scholar]
- 28. Ye F., Zhang W., Lu W., Xie Y., Jiang H., Jin J., Luo C., BioMed Res. Int. 2016, 2016, 1–8. [DOI] [PMC free article] [PubMed] [Google Scholar]
- 29. Bedi R. K., Huang D., Eberle S. A., Wiedmer L., Śledź P., Caflisch A., ChemMedChem 2020, 15, 744–748. [DOI] [PubMed] [Google Scholar]
- 30. Wiedmer L., Eberle S. A., Bedi R. K., Śledź P., Caflisch A., Anal. Chem. 2019, 91, 3078–3084. [DOI] [PubMed] [Google Scholar]
- 31. Yang E., van Nimwegen E., Zavolan M., Rajewsky N., Schroeder M., Magnasco M., Darnell J. E., Genome Res. 2003, 13, 1863–1872. [DOI] [PMC free article] [PubMed] [Google Scholar]
- 32. Wang X., Lu Z., Gomez A., Hon G. C., Yue Y., Han D., Fu Y., Parisien M., Dai Q., Jia G., Ren B., Pan T., He C., Nature 2014, 505, DOI 10.1038/nature12730. [DOI] [PMC free article] [PubMed] [Google Scholar]
- 33. Du H., Zhao Y., He J., Zhang Y., Xi H., Liu M., Ma J., Wu L., Nat. Commun. 2016, 7, DOI 10.1038/ncomms12626. [DOI] [PMC free article] [PubMed] [Google Scholar]
- 34. Schwartz S., Mumbach M. R., Jovanovic M., Wang T., Maciag K., Bushkin G. G., Mertins P., Ter-Ovanesyan D., Habib N., Cacchiarelli D., Sanjana N. E., Freinkman E., Pacold M. E., Satija R., Mikkelsen T. S., Hacohen N., Zhang F., Carr S. A., Lander E. S., Regev A., Cell Rep. 2014, 8, 284–296. [DOI] [PMC free article] [PubMed] [Google Scholar]
- 35. van Tran N., Ernst F. G. M., Hawley B. R., Zorbas C., Ulryck N., Hackert P., Bohnsack K. E., Bohnsack M. T., Jaffrey S. R., Graille M., Lafontaine D. L. J., Nucleic Acids Res. 2019, 47, 7719–7733. [DOI] [PMC free article] [PubMed] [Google Scholar]
- 36. Pinto R., Vågbø C. B., Jakobsson M. E., Kim Y., Baltissen M. P., O'Donohue M.-F., Guzmán U. H., Małecki J. M., Wu J., Kirpekar F., Olsen J. V., Gleizes P.-E., Vermeulen M., Leidel S. A., Slupphaug G., Falnes P. Ø., Nucleic Acids Res. 2019, 48, 830–846. [DOI] [PMC free article] [PubMed] [Google Scholar]
- 37. Boccaletto P., MacHnicka M. A., Purta E., Pitkowski P., Baginski B., Wirecki T. K., De Crécy-Lagard V., Ross R., Limbach P. A., Kotter A., Helm M., Bujnicki J. M., Nucleic Acids Res. 2018, 46, D303–D307. [DOI] [PMC free article] [PubMed] [Google Scholar]
- 38. Abelson H. T., Johnson L. F., Penman S., Green H., Cell 1974, 1, 161–165. [Google Scholar]
- 39. Alexandrov A., Martzen M. R., Phizicky E. M., RNA 2002, 8, 1253–1266. [DOI] [PMC free article] [PubMed] [Google Scholar]
- 40. Cartlidge R. A., Knebel A., Peggie M., Alexandrov A., Phizicky E. M., Cohen P., EMBO J. 2005, 24, 1696–1705. [DOI] [PMC free article] [PubMed] [Google Scholar]
- 41. Zhang L.-S., Liu C., Ma H., Dai Q., Sun H.-L., Luo G., Zhang Z., Zhang L., Hu L., Dong X., He C., Mol. Cell 2019, 74, 1304–1316.e8. [DOI] [PMC free article] [PubMed] [Google Scholar]
- 42. Pandolfini L., Barbieri I., Bannister A. J., Hendrick A., Andrews B., Webster N., Murat P., Mach P., Brandi R., Robson S. C., Migliori V., Alendar A., D'Onofrio M., Balasubramanian S., Kouzarides T., Mol. Cell 2019, 74, 1278–1290.e9. [DOI] [PMC free article] [PubMed] [Google Scholar]
- 43. Filippakopoulos P., Qi J., Picaud S., Shen Y., Smith W. B., Fedorov O., Morse E. M., Keates T., Hickman T. T., Felletar I., Philpott M., Munro S., McKeown M. R., Wang Y., Christie A. L., West N., Cameron M. J., Schwartz B., Heightman T. D., La Thangue N., French C. A., Wiest O., Kung A. L., Knapp S., Bradner J. E., Nature 2010, 468, 1067–1073. [DOI] [PMC free article] [PubMed] [Google Scholar]
- 44. McCoy A. J., Grosse-Kunstleve R. W., Adams P. D., Winn M. D., Storoni L. C., Read R. J., J. Appl. Crystallogr. 2007, 40, 658–674. [DOI] [PMC free article] [PubMed] [Google Scholar]
- 45. Emsley P., Lohkamp B., Scott W. G., Cowtan K., Acta Crystallogr. Sect. D 2010, 66, 486–501. [DOI] [PMC free article] [PubMed] [Google Scholar]
- 46. Afonine P. V., Grosse-Kunstleve R. W., Echols N., Headd J. J., Moriarty N. W., Mustyakimov M., Terwilliger T. C., Urzhumtsev A., Zwart P. H., Adams P. D., Acta Crystallogr. Sect. D 2012, 68, 352–367. [DOI] [PMC free article] [PubMed] [Google Scholar]
- 47. Garcia-Campos M. A., Edelheit S., Toth U., Safra M., Shachar R., Viukov S., Winkler R., Nir R., Lasman L., Brandis A., Hanna J. H., Rossmanith W., Schwartz S., Cell 2019, 178, 731–747.e16. [DOI] [PubMed] [Google Scholar]
- 48. Huang Y., Su R., Sheng Y., Dong L., Dong Z., Xu H., Ni T., Zhang Z. S., Zhang T., Li C., Han L., Zhu Z., Lian F., Wei J., Deng Q., Wang Y., Wunderlich M., Gao Z., Pan G., Zhong D., Zhou H., Zhang N., Gan J., Jiang H., Mulloy J. C., Qian Z., Chen J., Yang C.-G., Cancer Cell 2019, 35, 677–691.e10. [DOI] [PMC free article] [PubMed] [Google Scholar]
Associated Data
This section collects any data citations, data availability statements, or supplementary materials included in this article.
Supplementary Materials
As a service to our authors and readers, this journal provides supporting information supplied by the authors. Such materials are peer reviewed and may be re‐organized for online delivery, but are not copy‐edited or typeset. Technical support issues arising from supporting information (other than missing files) should be addressed to the authors.
Supporting Information