

Abstract
The picocyanobacteria Prochlorococcus and Synechococcus are found throughout the ocean's euphotic zone, where the daily light:dark cycle drives their physiology. Periodic deep mixing events can, however, move cells below this region, depriving them of light for extended periods of time. Here, we demonstrate that members of these genera can adapt to tolerate repeated periods of light energy deprivation. Strains kept in the dark for 3 d and then returned to the light initially required 18–26 d to resume growth, but after multiple rounds of dark exposure they began to regrow after only 1–2 d. This dark‐tolerant phenotype was stable and heritable; some cultures retained the trait for over 132 generations even when grown in a standard 13:11 light:dark cycle. We found no genetic differences between the dark‐tolerant and parental strains of Prochlorococcus NATL2A, indicating that an epigenetic change is likely responsible for the adaptation. To begin to explore this possibility, we asked whether DNA methylation—one potential mechanism mediating epigenetic inheritance in bacteria—occurs in Prochlorococcus. LC–MS/MS analysis showed that while DNA methylations, including 6 mA and 5 mC, are found in some other Prochlorococcus strains, there were no methylations detected in either the parental or dark‐tolerant NATL2A strains. These findings suggest that Prochlorococcus utilizes a yet‐to‐be‐determined epigenetic mechanism to adapt to the stress of extended light energy deprivation, and highlights phenotypic heterogeneity as an additional dimension of Prochlorococcus diversity.
Prochlorococcus are small (< 1 μm) non‐motile cyanobacteria broadly distributed throughout the mid‐latitude oceans, with a global population of ~ 3 × 1027 cells (Flombaum et al. 2013). They co‐exist with their close relatives, Synechococcus, which are slightly larger in size, less numerically abundant, and more widely distributed around the globe (Flombaum et al. 2013). Prochlorococcus comprises a number of genetically and physiologically distinct ecotypes, which can be broadly classified as High‐Light (HL) and Low‐Light (LL)‐adapted cells (Moore and Chisholm 1999; West and Scanlan 1999; Rocap et al. 2002). The two groups exhibit distinct distributions throughout the euphotic zone and across global spatial scales (Zinser et al. 2006; Johnson et al. 2006; Malmstrom et al. 2010), with the HL‐adapted cells generally found in highest abundance near the surface and LL‐adapted cells found deeper in the euphotic zone.
Vertical mixing through convection, internal waves, mesoscale eddies, and turbulent mixing can periodically displace these cells below the euphotic zone, depriving them of light energy for extended periods (Denman and Gargett 1983; Falkowski et al. 1991; Thorpe 2004). Multiple studies have documented Prochlorococcus (DeLong et al. 2006; Jiao et al. 2014; Shibl et al. 2014) and Synechococcus (Sohrin et al. 2011; Miller et al. 2017; Callieri et al. 2019) at depths of 300–2000 m—well below the euphotic zone. Detection of Prochlorococcus rRNA in deep samples from the western Pacific (Jiao et al. 2014), active transcription by Prochlorococcus and Synechococcus cells at 440 m in the Gulf of Aqaba (Miller et al. 2017), and the isolation of viable Synechococcus cells from 750 m in the anoxic Black Sea (Callieri et al. 2019) all indicate that these picocyanobacteria may remain viable in aphotic waters. The question then becomes: How long can they survive in the dark, and through what mechanisms?
Survival in darkness likely depends on the length of light deprivation and the ability of cells to maintain viability through mechanisms such as forming resting states (Smayda and Mitchell‐Innes 1974), reducing metabolic rates (Dehning and Tilzer 1989; Walter et al. 2017), drawing on energy stores (Walter et al. 2017), or switching to reduced carbon energy sources (White 1974). Prochlorococcus and Synechococcus are indeed able to utilize organic carbon sources for some of their carbon and energy needs (Eiler 2006; Yelton et al. 2016; Muñoz‐Marín et al. 2020) and access to organic carbon—either supplied directly from the media or by co‐cultured heterotrophs—can prolong Prochlorococcus' survival in extended darkness (Coe et al. 2016; Biller et al. 2018). When grown axenically in strictly inorganic media, for example, Prochlorococcus is unable to survive more than 1.5 d of extended darkness; however, when co‐cultured with a marine heterotroph such as Alteromonas it can survive up to 11 d (Coe et al. 2016; Biller et al. 2018). The mechanisms through which the “helper‐bacterium” (sensu Morris et al. 2008) aids dark survival appear to involve complex cross‐feeding interactions via organic carbon (Coe et al. 2016; Biller et al. 2018), as well as reduction of oxidative stress in the local environment (Morris et al. 2011, 2012; Ma et al. 2017). In contrast to Prochlorococcus, two strains of marine Synechococcus, WH7803 and WH8102, can survive at least 3 d in the dark without “helper‐bacteria” or the addition of organic carbon (Coe et al. 2016). While the mechanisms responsible for the difference is not clear, it is noteworthy that some Synechococcus lineages appear to endure periods of darkness on the order of months in the wild at locations including the Arctic (Cottrell and Kirchman 2009), during deep mixing events in the Adriatic Sea (Vilibić and Šantić 2008), and in Suruga Bay (Sohrin et al. 2011).
The lineages used in our dark‐survival experiments to date (Coe et al. 2016) have been maintained for ~ 30 yr on either a diel light:dark cycle or under continuous light; they have not experienced periods of extended light deprivation that might occur in the wild due to deep mixing. This made us wonder whether cells might adapt to repeated extended darkness such that they could recover more quickly once light was re‐supplied. To examine this, we exposed HL and LL Prochlorococcus, as well as Synechococcus, to repeated periods of extended darkness separated by periods of re‐growth on a diel light:dark cycle. We measured how long it took for the culture to resume growth after each extended dark exposure, noting whether recovery times were quicker after this “training” and whether the multiple rounds of dark exposure enhanced the population's ability to survive longer periods of darkness. As we hypothesized, both of these variables were enhanced by repeated exposure, inspiring us to undertake analyses that might begin to unravel the mechanism behind this adaptation.
Methods
Culturing
All Prochlorococcus and Synechococcus cells were grown in 0.2 μm filtered sterile Sargasso Sea water amended with Pro99 nutrients prepared as previously described (Moore et al. 2007). Triplicate cultures starting at a concentration of 5 × 10⁶ cells mL−1 to 1 × 10⁷ cells mL−1 were grown in a 13:11 light:dark cycle incubator with simulated dawn and dusk (Zinser et al. 2009) at 24 °C. This simulation creates gradual light transitions at sunrise by ramping light slowly up to mid‐day, remaining at peak light for 4 h, and then decreasing light to sunset over the course of 13 h. This gradual increase was important for reducing light shock on the cultures transitioning from extended darkness back into 13:11 light:dark conditions. Near optimal peak light levels for maximizing growth rate were used for all Prochlorococcus and Synechococcus strains involved and included the following combinations: MED4 (80 ± 1 μmol photons m−2 s−1), MIT9312 (80 ± 1 μmol photons m−2 s−1), MIT9202 (72 ± 1 μmol photons m−2 s−1), MIT9215 (72 ± 1 μmol photons m−2 s−1), AS9601 (72 ± 1 μmol photons m−2 s−1), NATL2A (37 ± 1 μmol photons m−2 s−1), MIT9313 (29 ± 1 μmol photons m−2 s−1), and WH8102 (76 ± 1 μmol photons m−2 s−1). Growth rates were calculated by exponential regression from the log‐linear portion of the growth curve. To compare changes in growth rates between parental (i.e., cells that were not exposed to repeated light energy deprivation) and dark‐trained lines, 3–7 growth curves were averaged and two‐tailed homoscedastic t‐tests were conducted using Microsoft Excel to determine significance.
To subject cells to extended darkness, we placed exponentially growing cultures into a 24 °C dark incubator at the end of the 13:11 light:dark cycle for varying durations. Including the 11 h of their last “natural” light:dark cycle, these cultures were in the dark for a total of 83 or 251 h for Prochlorococcus and 83, 155, 179, and 251 h for Synechococcus, which translated into days amounts to an additional 3, 6, 7, or 10 d of extended darkness, respectively. The cultures were then shifted back into the light:dark incubator at “sunrise” to reduce light shock effects, and recovery was monitored via bulk chlorophyll fluorescence measurements (10 AU model, Turner Designs, Sunnyvale, California) and flow cytometry (see below). All dark sampling and measurements were done in green light using layered neutral density filters #736 and 740 (Lee Filters, Burbank, California) over a white light source, which causes minimal gene expression change in Prochlorococcus (Steglich et al. 2006). All Prochlorococcus cultures were grown in co‐culture with Alteromonas macleodii MIT1002 with the exception of cultures rendered axenic (purification steps described below) in Fig. 4 (blue line) and Supporting Information Fig. S2 (blue and black lines). All Synechococcus cultures were axenic and were tested for purity using three broths ProAC, ProMM, and MPTB (Saito et al. 2002; Morris et al. 2008; Berube et al. 2015), as well as by flow cytometry.
Fig. 4.
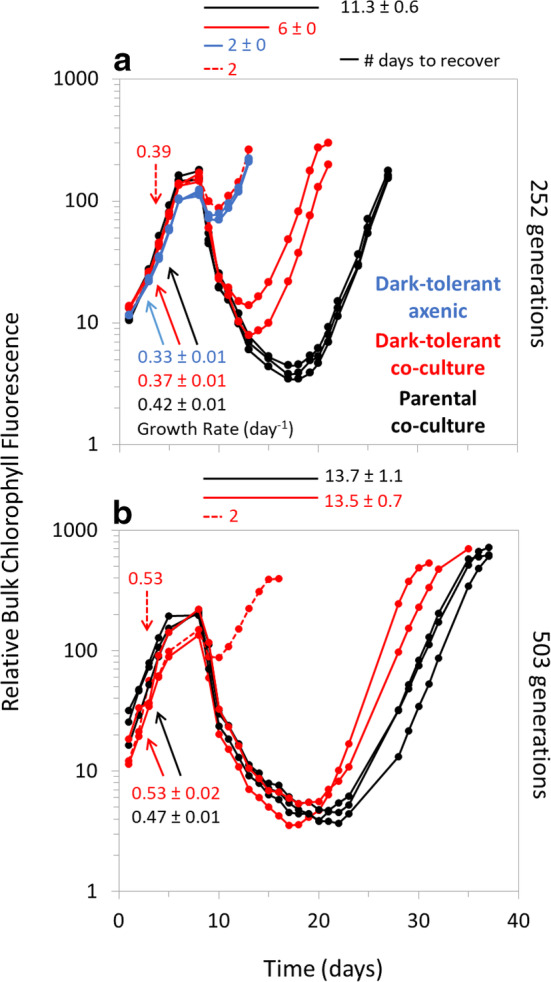
Reversion of dark‐tolerant Prochlorococcus. After (a) 252 and (b) 503 generations of growth under standard 13:11 light:dark conditions with no extended darkness, the responses to dark exposure of individual triplicate lineages of dark‐tolerant Prochlorococcus NATL2A co‐cultures (red; dashed for nonrevertant line) were compared to those of the parental co‐cultures (black) and axenic dark‐tolerant cultures (blue). Cultures were subjected to 3 d of extended darkness (vertical gray bar), and their recovery under standard 13:11 light:dark conditions was monitored via bulk chlorophyll fluorescence. The time needed to resume growth after dark exposure is indicated above figures and next to horizontal bars. The growth rates (day−1) calculated are shown next to color coordinated arrows. The growth rate increase in (b) prior to extended darkness can be accounted for by a change in the media natural seawater base 3 months prior to the experiment, but this did not influence the resumption of growth after darkness.
Alteromonas macleodii MIT1002 (Biller et al. 2015b ) was maintained on ProMM medium (Berube et al. 2015), but was spun down (10,000 × g for 15 min) and washed twice with Pro99 medium prior to addition into Prochlorococcus cultures to minimize carryover of organic carbon from ProMM. Alteromonas macleodii concentrations ranging between 5 × 10⁵ cells mL−1 to 1 × 10⁶ cells mL−1 were added at the onset of the experiment.
Cultures of Alteromonas and Prochlorococcus from dark‐trained and parental co‐cultures shown in Fig. 2 (blue line), Table 1, and Supporting Information Fig. S2 (Alteromonas red and gray lines; Prochlorococcus blue and black lines), were rendered axenic by using a serial dilution‐to‐extinction method previously published (Berube et al. 2015). Purity of the cultures was confirmed using all three purity broths mentioned above and by flow cytometry.
Fig. 2.
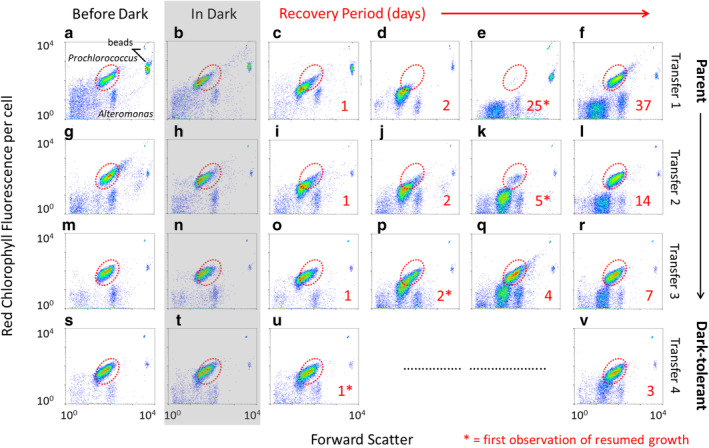
Flow cytometric analysis of Prochlorococcus MED4 populations during “dark training” by repeated dark exposure. Flow cytograms of forward light scatter and chlorophyll fluorescence per cell before dark exposure (first column), during 3 d of darkness (shaded area) and during the recovery period (panels to the right of shaded area) for each of four sequential transfers during the dark training. Numbers in red denote the days during the recovery period (up to late exponential phase) and the first observations of resumed growth are indicated by (*) also seen as “days to resume growth” in Fig. 1. The red‐dotted circle indicates the fluorescence and light scatter window occupied by parental and “fully recovered” cells. The cultures were maintained under standard 13:11 light:dark conditions during the recovery periods.
Table 1.
Relative abundance of methylated DNA nucleotides in different Prochlorococcus strains, as well as Alteromonas, determined by mass spectrometry. N6‐methyladenine (6 mA), C5‐methylcytosine (5 mC), and N4‐methylcytosine (4 mC) methylated nucleotides were measured in axenic parental (white) Alteromonas and Prochlorococcus strains from different high‐light (HL) and low‐light (LL) clades grown under standard light:dark conditions and in axenic dark‐tolerant (gray) Prochlorococcus NATL2A after experiencing changes in light regimes (treatments) including: before dark, 3 d in darkness (“in dark”), and after the cells resumed growth and reached late‐exponential growth phase (“recovered”). Nucleotides that were not detected were indicated with “n.d” and values indicate the mean (± SD) from three biological replicates.
| Strain | Treatment | Clade | 6 mA/dA (%) | 5 mC/dC (%) | 4 mC/dC (%) |
|---|---|---|---|---|---|
| Prochlorococcus | |||||
| NATL2A | – | LLI | n.d. | n.d. | n.d. |
| Dark‐tolerant NATL2A | Before dark | LLI | n.d. | n.d. | n.d. |
| Dark‐tolerant NATL2A | In dark | LLI | n.d. | n.d. | n.d. |
| Dark‐tolerant NATL2A | Recovered | LLI | n.d. | n.d. | n.d. |
| MED4 | – | HLI | 1.605 (± 0.08) | n.d. | n.d. |
| MIT9312 | – | HLII | n.d. | 0.847 (± 0.029) | n.d. |
| MIT9215 | – | HLII | n.d. | 0.895 (± 0.019) | n.d. |
| MIT9202 | – | HLII | n.d. | 0.318 (± 0.017) | n.d. |
| AS9601 | – | HLII | n.d. | 1.006 (± 0.044) | n.d. |
| MIT1304 | – | LLII/III | 0.317 (± 0.007) | n.d. | n.d. |
| MIT9313 | – | LLIV | 0.063 (± 0.02) | n.d. | n.d. |
| Alteromonas | |||||
| MIT1002 | – | – | 7.708 (± 0) | n.d. | n.d. |
| Dark‐tolerant MIT1002 | Before dark | – | 8.455 (± 0.003) | n.d. | n.d. |
Flow cytometry
Prochlorococcus cell abundance measurements by flow cytometry were prepared and processed as previously described (Zinser et al. 2006; Malmstrom et al. 2010). Samples were run on an Influx flow cytometer (Becton Dickinson, Franklin Lakes, New Jersey) and excited with a blue 488 nm laser and analyzed for chlorophyll fluorescence (692/40 nm) and size (forward scatter). All samples included 2 μm diameter Fluoresbrite beads (Polysciences Inc., Warrington, Pennsylvania) for size reference and alignment purposes. All flow cytometry data were analyzed using FlowJo version 10.6.1 (Flowjo LLC, BD Life Sciences, Ashland, Oregon).
DNA sequencing
To look for genetic mutations between the dark‐tolerant and parental Prochlorococcus NATL2A, genomic DNA was isolated for Illumina sequencing from biological duplicate cultures collected at three time points (first transfer before dark, first transfer after extended darkness, and seventh transfer after extended darkness; see “*” Fig. 1). Cells from 5 mL of culture were first pelleted by centrifugation at 12,000 × g for 10 min. Genomic DNA was extracted using a previously published phenol/chloroform procedure (Wilson 2001) with the addition of a 100% chloroform extraction at the end to remove residual phenol contaminates. To minimize shearing, samples were shaken briefly by hand (no vortex use), centrifugation time and speed (3 min at 16,000 × g) were minimized, and we used wide bore tips. Libraries were constructed using the NextEra XT kit (Illumina) on an automated Tecan Freedom EVO robotics platform, starting from 1 ng of input DNA. The resulting libraries were sequenced using an Illumina NextSeq 500, generating between 7.6 and 10.7 million 150 + 150 nt paired‐end reads from each sample (Supporting Information Table S1). All library construction and sequencing was carried out by the MIT BioMicro Center. Sequencing reads have been deposited to SRA under BioProject PRJNA669190 (Supporting Information Table S1). Low‐quality regions of sequencing data and Illumina adapter sequences were removed using Trimmomatic (V0.36) (Bolger et al. 2014). Illumina sequencing data was analyzed by breseq (V0.35.3) in both consensus and polymorphism modes (Deatherage et al. 2015), aligning the individual quality‐trimmed reads to reference genomes for Prochlorococcus NATL2A and Alteromonas macleodii MIT1002 (NCBI GenBank accession numbers CP000095.2 and JXRW01000000, respectively) which had been corrected for mutations present in the parental cultures as compared to the GenBank sequence. >99% of reads mapped to the reference genomes in each library; Prochlorococcus NATL2A had 833–1074x coverage, while both the genome and plasmid of Alteromonas macleodii MIT1002 had similar coverage levels within each library (in the range of ~ 80–200x). As polymorphism analysis can be complicated by false‐positives arising from systematic sequencing errors (Deatherage et al. 2015) potential polymorphisms were first examined to identify sites flagged by the software which were polymorphic in all replicate parental and dark‐tolerant cultures. Alignment data for any genomic locations identified as potentially polymorphic exclusively in replicate dark‐tolerant cultures were manually examined.
Fig. 1.
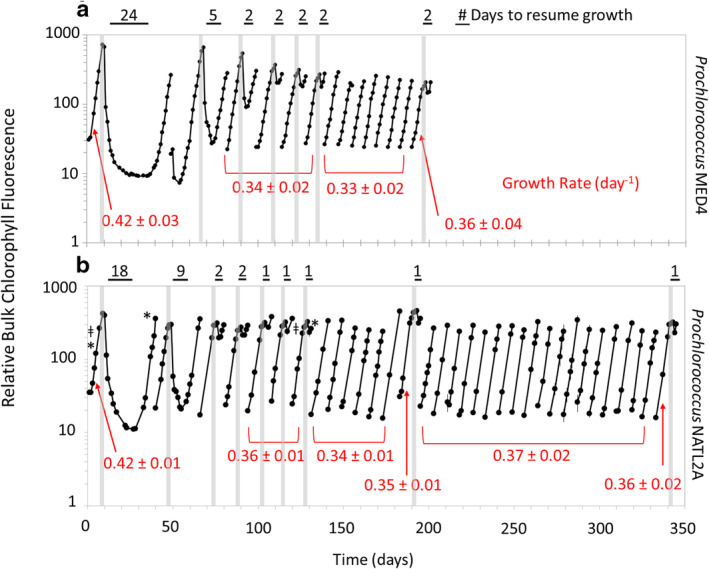
Recovery dynamics of Prochlorococcus cultures after repeated dark exposure. Prochlorococcus (a) MED4 and (b) NATL2A were subjected to 3 d of extended darkness (vertical gray bars) and then allowed to recover under standard 13:11 light:dark growth conditions. Once cells reached late‐exponential growth phase, cultures were transferred to fresh media and the process was repeated. Transfers without vertical gray bars indicate growth under standard 13:11 light:dark conditions without extended darkness. The time needed to resume growth after dark exposure is indicated above the black horizontal bars and growth rates (day−1) calculated for the parental and dark‐tolerant populations are shown in red. Samples for Illumina sequencing are noted with an “*” and PacBio with an “ǂ.” Prochlorococcus was grown in co‐culture with Alteromonas macleodii MIT1002 to enable survival of the initial dark exposure.
Genome sequences, as well as 6 mA and 4 mC methylation patterns, were also determined using Pacific Biosciences sequencing of triplicate parental (no extended darkness) and dark‐tolerant cultures from the seventh transfer, immediately before the first and seventh round of extended darkness (see “ǂ” Fig. 1). Culture samples were prepared by pelleting 90 mL of exponentially growing cultures by centrifugation at 7500 × g for 15 min. The pellet was resuspended into 200 μL of pH 8 TE and stored at − 80°C. DNA was extracted using the same method as previously described above. Library construction began with diluting 4 μg of intact genomic DNA in 150 μL of TE buffer (10 mM TrisHCl, 1 mM EDTA, pH 8.5) and fragmenting to 10–12 kb lengths using a gTube (Covaris Cat# 520079). Fragmented DNA was concentrated by a 0.45X SPRI bead cleanup (Beckman‐Coulter), eluted in 37 μL EB (10 mM TrisHCl pH 8.0) and processed using SMRTBellTM Template Prep kit 1.0 (PacBio Part# 100–259‐100) to SMRTbell libraries, following manufacturer guidelines. Indexed blunt‐end SMRTbell adapters (PacBio Part# 100‐4666‐000) were added for multiplexing. Multiple indexed SMRTbell libraries were assembled in a single pool, cleaned up using a Minelute reaction cleanup kit (QIAGEN Cat# 28204) to 100 μL volume in EB, followed by SPRI 0.4X cleanup, with final elution in 11 μL EB. Concentration and quality were assessed by Picogreen (ThermoFisher QuantIt Cat# P11496) and FEMTOpulse (Agilent). Pooled libraries were bound using Sequel Binding Kit 2.1 and sequenced for 10 h on the Pacific Biosciences Sequel I using a SMRTCell 1Mv2. Library construction and sequencing were carried out by the MIT BioMicro Center; detailed library statistics can be found in Supporting Information Table S2. The Pacific Biosciences sequences have been deposited to SRA under BioProject PRJNA669190 (Supporting Information Table S2). We looked for SNPs in the PacBio data based on mapping of consensus reads. We searched for structural variants in the Prochlorococcus and Alteromonas PacBio sequences as compared to reference genomes by running Sniffles (V1.0.11, https://github.com/fritzsedlazeck/Sniffles) on a median length subread for each polymerase read. Locations of structural variants called by Sniffles were manually examined to confirm the presence of a structural variant. Methylations in Prochlorococcus and Alteromonas Pacific Biosciences reads were identified in SMRT Link (V.6.0.0) using the base modification analysis module with default parameters. This analysis was run with a reference file that contained both the Prochlorococcus NATL2A and Alteromonas macleodii MIT1002 genomes (as above). GFF files containing the methylations identified were parsed to create separate files for the methylations identified in Prochlorococcus and Alteromonas. MotifMaker (V0.3.1, https://github.com/PacificBiosciences/MotifMaker) was used to identify methylated motifs, if any, in the Prochlorococcus and Alteromonas methylation GFF files separately.
Mass spectrometry‐based methylation analysis
Mass spectrometry‐based detection and quantification of 6 mA, 4 mC, and 5 mC in genomic DNA were carried out using previously published methods (Boulias and Greer 2021). Cells from exponentially growing axenic biological triplicate cultures (7 mL of Alteromonas and 50 mL of Prochlorococcus) were pelleted by centrifugation at 7412 × g for 20–30 min. DNA from cell pellets and seawater media blanks was exacted using the Qiagen DNeasy Blood & Tissue DNA extraction kit (Cat# 69504). To free nucleosides, 0.5–1 μg of gDNA was digested using 10 U of DNA Degradase Plus (Zymo Research) in 30 μL reactions incubated for 2 h at 37 °C. After digestion the sample volume was brought to 100 μL with ddH20 followed by filtration using 0.22 μm Millex Syringe Filters (EMD Millipore). 5 μL of the filtered solution was analyzed by LC–MS/MS.
The separation of nucleosides was performed using an Agilent 1290 UHPLC system with a C18 reversed‐phase column (2.1 × 50 mm, 1.8 m). The mobile phase A was water with 0.1% (v/v) formic acid and mobile phase B was methanol with 0.1% (v/v) formic acid. Online mass spectrometry detection was performed using an Agilent 6470 triple quadrupole mass spectrometer in positive electrospray ionization mode. Quantification of each nucleoside was accomplished in dynamic multiple reaction monitoring (dMRM) mode by monitoring the transitions of 252.1 → 136.0 for dA, 266.1 → 150.0 for 6 mA, 228.2 → 112.1 for dC, and 242.2 → 126.1 for 4 and 5 mC.
As a negative control in each UHPLC–ms/ms experiment, we included a “mock” digestion reaction, consisting of DNA Degradase Plus and digestion buffer in water, without any added DNA. This control established the background level of the nucleosides in the reagents, which was subtracted from the values obtained for each gDNA sample. The amounts of dA, 6 mA, dC, 4 mC, and 5 mC in the samples were quantified using corresponding calibration curves generated with pure standards and the ratios of 6 mA/dA, 4 mC/dC, and 5 mC/dC were calculated. Quantification of DNA methylation in samples required a measured value to be at least 2x above the mock background level.
Results and discussion
Prochlorococcus can adapt to extended dark exposure
To see whether repeated periods of extended darkness enhances their ability to recover from light energy deprivation, we subjected two strains of Prochlorococcus—MED4 (a HL‐adapted strain) and NATL2A (a LL‐adapted strain)—to total darkness for 3 d, brought them back into the light, allowed them to resume growth to late exponential phase, transferred them to fresh media, and then repeated this cycle for multiple rounds (Fig. 1). We henceforth define a “transfer” as encompassing this complete process of exposing a culture growing under normal light conditions to extended darkness, returning the cells to the light, and allowing them to resume growth and reach late exponential phase. As our previous study demonstrated that Prochlorococcus could not survive more than 1.5 d of darkness in pure culture (Coe et al. 2016), these initial studies were carried out in co‐culture with the heterotroph Alteromonas macleodii MIT1002 (hereafter referred to as Alteromonas). We measured the recovery time—i.e., the time it took for the culture to resume exponential growth as measured by bulk chlorophyll fluorescence (see Methods)—after each extended dark exposure.
As is typical in these types of experiments (Coe et al. 2016), when cells were re‐exposed to light bulk chlorophyll fluorescence of the cultures decreased until growth resumed (Fig. 1). Strikingly, after three rounds of repeated dark exposures and transfers, the time required to recover was reduced from 24 d to 2 d for Prochlorococcus MED4 and from 18 d to 1 d for Prochlorococcus NATL2A (Fig. 1). The three transfers reflected ~ 35 generations for MED4 and ~ 25 generations for NATL2A and there were no further changes in the recovery time after the 5th transfer. Both strains retained this “dark‐tolerant” phenotype following 6–7 transfers under standard 13:11 light:dark conditions (Fig. 1a). NATL2A cultures were monitored for a longer period—an additional 18 transfers, or 81 generations, (Fig. 1b, right)—under standard light:dark conditions. When then subjected to 3 d of darkness, these NATL2A cells still displayed the 1 d recovery time associated with the adapted, dark‐tolerant phenotype.
The shortened recovery times emerging from the “dark training” were not without a tradeoff: steady state growth rates (Fig. 1, red text) of the dark‐tolerant cells were significantly lower than the parental “untrained” culture (two‐tailed t test, p < 0.05 for both MED4 and NATL2A). To explore whether dark training might be a general feature of Prochlorococcus, we conducted a similar experiment with Prochlorococcus MIT9313—a LL‐adapted strain belonging to a different clade—and observed similar results (Supporting Information Fig. S1). The observation that a stable dark‐tolerant population was only achieved after three dark treatments could be consistent with multiple adaptive scenarios occurring within these cultures, including their being a result of: (1) competition among different dark‐tolerant subpopulations either present initially or which arise over the course of multiple rounds of selection; (2) a slow physiological adaptation process (e.g., perhaps resulting from gradual accumulation of a metabolite); or (3) feedback processes driving a progressive reinforcement of the dark‐tolerant phenotype in successive generations (Chai et al. 2010; Xue and Leibler 2016).
Heterotroph interactions are not required for the long‐term maintenance of the dark‐tolerant phenotype in Prochlorococcus
As described above, these experiments could not be conducted with axenic Prochlorococcus cultures because the cells do not survive the first exposure to > 1 d of extended darkness without the presence of a helper bacterium (Coe et al. 2016). We wondered if heterotroph interactions were required for the adaptive phenotype itself, or if they were only important for facilitating Prochlorococcus' survival in the dark long enough for them to adapt. To test this, we isolated axenic lineages of both the parental and dark‐tolerant NATL2A cultures and exposed them to extended darkness as above. The axenic strain isolated from the dark‐tolerant co‐culture retained its dark tolerance (Supporting Information Fig. S2, black line), whereas the axenic strain isolated from the parental co‐culture did not (Supporting Information Fig. S2, pink line). To further probe the role of the heterotroph we isolated pure cultures of Alteromonas from the parental and dark‐tolerant co‐cultures and added them back into axenic parent cultures of Prochlorococcus, and found that the heterotroph did not confer dark tolerance (Supporting Information Fig. S2, red, blue, and gray lines). Thus, the dark‐tolerance phenotype arises from changes within Prochlorococcus, and the presence of Alteromonas appears to be only important for extending dark survival long enough for the initial adaptation to occur.
Marine Synechococcus can also adapt to better tolerate extended darkness
We conducted a similar suite of experiments with axenic marine Synechococcus WH8102, which has been shown to survive long periods of darkness in the wild (Sohrin et al. 2011) and can survive up to 7 d of darkness even without “helper‐bacteria” (Supporting Information Fig. S3, red line). Further, when exposed to 3 d of darkness (Supporting Information Fig. S3, black line) it resumes growth within 2 d, which is in striking contrast to Prochlorococcus which took 14–26 d to resume growth in a similar experiment under the same conditions (Fig. 1). Synechococcus clearly has a better baseline tolerance of extended darkness, and as such required longer periods of time in darkness than Prochlorococcus did when we repeatedly exposed cells to extended darkness. After 6 d of darkness we observed the emergence of a dark‐tolerant phenotype in Synechococcus analogous to that seen in Prochlorococcus; dark recovery time decreased from 19 to 2 d after 3 cycles of darkness (Supporting Information Fig. S4). The 2 d‐recovery phenotype was stable through seven transfers under standard 13:11 light:dark growth conditions, after which it was further reduced to 1 d (Supporting Information Fig. S4, right side). The growth rate of the dark‐tolerant Synechococcus population was slightly lower than that of the parental cells, but not significantly so (two‐tailed t test, p = 0.2). Thus, while there are some differences between Prochlorococcus and Synechococcus vis a vis the details of the dark‐tolerance phenomenon, adaptation to repeated periods of extended darkness appears to be a general feature of picocyanobacteria.
Dark‐tolerance is associated with changes in population‐level dynamics
We have observed that after cells are placed in extended darkness and re‐exposed to light, chlorophyll fluorescence and light scatter of each cell (a proxy for cell size) decreases steadily until, eventually, a small population of ~ 100 cells mL−1 (0.00015% of the cells that were placed in the dark) with the same optical characteristics of the original population emerges (Coe et al. 2016). We hypothesize that this represents a “seed population” for the recovery of the culture, and that the remainder of the cells do not survive and/or recover. The “lag” time for regrowth, defined here as the time required for us to detect the resumption of growth based on fluorescence or flow cytometry, can be attributed to a combination of the biological lag phase of the seed population of viable cells and the instrument limit of detection. To probe this phenomenon in the dark‐tolerant cultures, we examined flow cytometric signatures over the first four consecutive extended darkness training cycles in Prochlorococcus MED4 (Fig. 2). As expected, during the first dark exposure and recovery (Fig. 2a–f), the light scatter and fluorescence per cell decreased steadily over time, and after 25 d (Fig. 2e) the bulk of the population was near the baseline of detection; as before, however, a small population of cells—here ~ 800 cells mL−1—was evident with the fluorescence and light scatter values of the original parental cells (Fig. 2e, red‐dotted circle). This population appeared at the same time as the bulk chlorophyll fluorescence of the culture began to increase (Fig.1a), our metric for determining the beginning of recovery. With successive cycles of dark exposure and recovery (transfers 2, 3, and 4, Fig. 2), the recovery time steadily decreased by halves, and an increasing percentage of the cells emerged from the low fluorescence/light scatter population. By the 4th cycle (Fig. 2s–v), the recovery time had been reduced to 1 d (Fig. 2u) and essentially the entire population retained the original “healthy” flow cytometric signature. This indicates that after repeated training cycles the vast majority of the population is able to maintain its chlorophyll and can seed the recovery, explaining the decreased lag in regrowth: the seed population increased from 800 cells mL−1 (or 0.0006% of the cells that were placed in the dark) after the first round, to 4.5 × 10⁶, 9 × 10⁷, and 1.1 × 10⁸ cells mL−1 (or 6.19%, 89.4%, and 73.1% of the cells that were placed in the dark) in the 2nd, 3rd, and 4th transfers, respectively.
The subpopulation with reduced chlorophyll fluorescence and light scatter likely reflects cells undergoing chlorosis, a degradation of the photosynthetic apparatus resulting in reduction of chlorophyll autofluorescence. Based on the regrowth patterns of the seed population and observations that similar populations of 30‐day old Prochlorococcus MIT9313 cells are inactive (Roth‐Rosenberg et al. 2020), we hypothesize that the low‐chlorophyll populations are likely non‐viable. Thus, the subpopulation that is able to maintain a typical flow cytometric signature during extended darkness appears to be cells with the dark‐tolerant phenotype.
Dark‐tolerant cells survive for longer periods of time in the dark
To examine whether dark‐tolerance—as measured by recovery time after extended dark exposure—confers the ability to survive longer periods of time in the dark, we compared the recovery dynamics of the parental Prochlorococcus MED4 co‐cultures we studied in our earlier study (Coe et al. 2016) and found they could survive 7, but not 10, days of darkness. In contrast, the dark‐tolerant MED4 cultures described here could survive at least 10 d of darkness (longer periods were not tested) (Fig. 3). Furthermore, the dark‐tolerant cultures recovered more quickly than the parental cultures (horizontal bars, Fig. 3). Thus, dark‐tolerant Prochlorococcus can survive longer periods of time in dark and resume growth more quickly upon re‐introduction to light than their “untrained” counterparts.
Fig. 3.
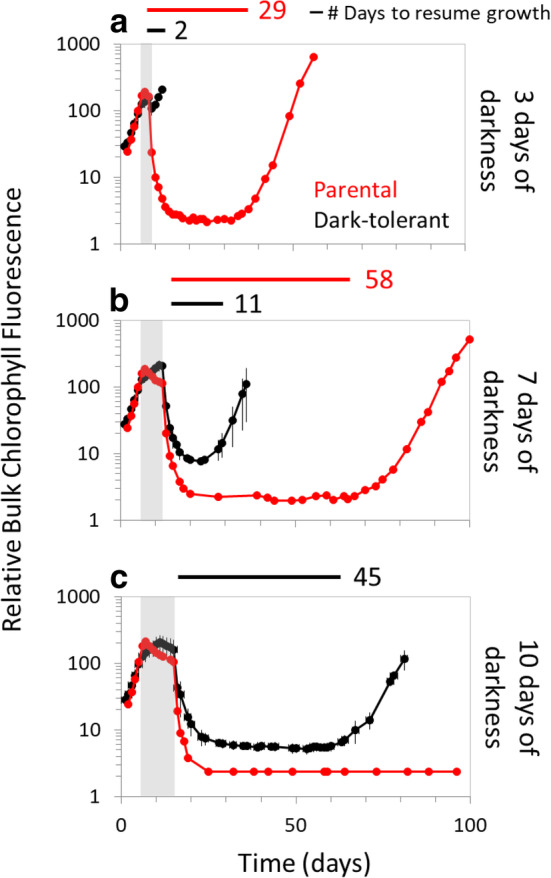
Response of dark‐tolerant cells to increased durations of extended darkness. Parental (red) and dark‐tolerant (black) cultures of Prochlorococcus MED4 grown in standard 13:11 light:dark conditions were subjected to either (a) 3, (b) 7, or (c) 10 d of extended darkness (vertical gray bars) and then returned to the light:dark cycle. The time needed to resume growth after dark exposure is indicated next to the horizontal bars. Prochlorococcus MED4 parental data (red lines) are from previously published data (Coe et al., 2016). Prochlorococcus was grown in co‐culture with Alteromonas macleodii MIT1002 to allow survival of the dark exposure.
Dark‐tolerance is not due to a genetic mutation in Prochlorococcus NATL2A
That the dark‐tolerant phenotype was stable and heritable suggested that we had possibly selected for a genetic mutation within Prochlorococcus. To explore this, we compared the genomes of replicate dark‐tolerant Prochlorococcus NATL2A strains sampled before extended darkness, after recovery from the initial dark exposure, and again after recovery from six additional transfers and rounds of extended darkness (~ 4, 17, and 49 generations) with those of the parental cultures (Supporting Information Table S1). To our surprise, there was no evidence of genetic changes including SNPs, indels, or genomic rearrangements in the dark‐tolerant cultures. We further asked whether there might be genetically distinct subpopulations within those dark‐tolerant cultures, as have been identified within phase‐variable populations of model heterotrophs and pathogens (Atack et al. 2018), but found no novel genetic subpopulations associated with the emergence of the dark‐tolerance phenotype (Supporting Information Fig. S5). Most potential polymorphisms identified within the dataset were found at low frequencies in both parental and dark‐tolerant cultures, likely reflecting systematic sequencing biases; none were validated to be both unique to the dark‐tolerant cultures and consistent with the observed dark‐tolerant population survival frequencies and regrowth dynamics (Figs. 1b and 2). We also found no differences among the small fraction of reads (< 1%) which failed to align to the reference genomes in the parental or dark‐tolerant libraries. The lack of large‐scale chromosomal rearrangements or insertions/deletions in the dark‐tolerant cells was further confirmed using Pacific Biosciences long‐read sequencing (Supporting information Table S2). Though we cannot completely rule out the presence of genetically distinct subpopulations maintained below our limit of detection (~ 1%–5% frequency), the evidence strongly suggests that the dark‐tolerance phenotype is due to a non‐genetic mechanism.
DNA methylation is not responsible for dark‐tolerance in Prochlorococcus NATL2A
To begin to explore the possibility of an epigenetic mechanism for dark‐tolerance, we looked for changes in DNA methylation. Many microorganisms contain DNA methyltransferases which add methyl groups to specific positions on DNA (Blow et al. 2016), thereby disrupting DNA‐protein interactions. Such modifications can serve to influence phage defense through restriction‐modification systems (Tock and Dryden 2005), and can also alter transcriptional regulation—and in this way mediate epigenetic changes in phenotype (Casselli et al. 2018; Mouammine and Collier 2018). Indeed, DNA methylation‐based changes in gene expression have been observed in Synechocystis in response to N‐starvation (Hu et al. 2018), and the cyanobacterial strains used here encode at least one putative DNA methyltransferase enzyme (Kettler et al. 2007; Stucken et al. 2013; Blow et al. 2016). The single‐molecule sequencing data, however, revealed no methylated sequence motifs in either the parental or dark‐tolerant Prochlorococcus NATL2A (see Fig. 1b, after both the 1st and 7th transfers); as an internal positive control, we note that methylated motifs indicative of an active Dam methylase were found in the co‐cultured Alteromonas genome.
To determine whether Prochlorococcus could have used a DNA modification that was not detectable by Pacific Biosciences sequencing, we extended our sequencing‐based analysis using a mass spectrometry approach (O'Brown et al. 2019). Again, methylated nucleotides were not detected in either the parental or dark‐tolerant Prochlorococcus NATL2A, while N6‐methyladenine (6 mA) methylations were detected in Alteromonas, the positive control (Table 1). Wondering if any Prochlorococcus strains methylate their DNA, we examined a diverse suite of strains and found both N6‐methyladenine (6 mA) and C5‐methylcytosine (5 mC) modifications (Table 1). Differences in the type of methylated nucleotides can be seen across the strains, as well as differences in the relative fraction of methylated nucleotides between members of the HL and LL clades (Table 1). Thus, while select Prochlorococcus are able to methylate their DNA, this does not appear to be the causal mechanism underlying the dark‐tolerance adaptation in the NATL2A strain used in our experiments.
DNA methylation is not the only type of epigenetic modification that could be responsible for the dark‐tolerance phenotype. Another possibility is that the change might arise through a protein‐based inheritance mechanism based on biased inheritance of protein abundance or modifications (Harvey et al. 2018), or systems with prion‐like properties (Yuan and Hochschild 2017). These types of systems function in cyanobacterial circadian clocks; for example, the cyanobacterium Synechococcus elongatus can pass on the “time” to daughter cells via heritable protein phosphorylation levels (Mihalcescu et al. 2004; Amdaoud et al. 2007). RNA modifications are yet another avenue for microbial epigenetics, as methylation of tRNAs has been implicated in bacterial translational regulation (Schwartz et al. 2018). Genetic feedback loops, in which initially small stochastic variation in gene expression from a “noisy” promoter is ultimately amplified (or repressed) to influence genetic regulation, are also a possibility (Turner et al. 2009). These all represent avenues for future investigation.
Maintenance of the dark‐tolerance phenotype
Finally, we wondered how long the dark‐tolerant phenotype might be stably maintained in the absence of the extended darkness stimulus. To address this, we maintained independent triplicate cultures of the NATL2A dark‐tolerant strain under standard 13:11 light:dark diel growth conditions and re‐tested them after 252 and 503 generations (14 and 31 months, respectively). After 14 months, we found that two of the three cultures had begun to revert to an intermediate dark‐tolerance phenotype; they were no longer able to recover as quickly from extended dark exposure (Fig. 4a, solid red lines) as they were after the initial training. This phenotypic reversion occurred only in the dark‐tolerant co‐cultures (Fig. 4,a,b, solid red lines) and not with the lineages that were rendered axenic (Fig. 4a, blue lines), raising the possibility that some co‐culture interactions facilitated an epigenetic switch back to the parental state—or that it simply has not yet occurred in the axenic triplicates. After 503 generations (Fig. 4b), the ability of these cultures to recover from extended darkness had further decreased and was now consistent with the original parental phenotype. These dynamics suggest that a subpopulation with the parental dark‐sensitive phenotype emerged at some point and increased in abundance within these populations due to amelioration of the fitness cost (decreased growth rate) associated with the dark‐tolerance phenotype. Indeed, an increase in growth rates to near‐parental levels was observed in the reverted cultures (Fig. 4b). The single non‐reverting replicate also increased its growth rate over time without loss of the dark‐recovery phenotype, hinting at the potential existence of alternative evolutionary pathways which increase the growth rate of Prochlorococcus while still maintaining dark‐tolerance under these particular conditions. Future study will be required to determine whether this revertant phenotype arose from a compensatory genetic mutation or a reversion of an epigenetic change, which may help to better understand the underlying costs and benefits incurred by phenotypic variation in Prochlorococcus.
Conclusions
Our findings highlight phenotypic variation within genetically identical lineages as a new dimension of Prochlorococcus diversity, with implications for the ecology and evolution of this group. While genetic diversity helps ensure that there is always an optimal variant available as the environment shifts (Biller et al. 2015a ), epigenetic mechanisms can serve to bridge different timescales of disturbance and selection within a genotype (Walworth et al. 2020), contributing to the remarkable stability of the collective population. The Prochlorococcus dark‐tolerance phenotype is notably more stable than examples of epigenetic inheritance in bacterial pathogens and soil microbes (Rando and Verstrepen 2007; Veening et al. 2008), likely reflecting differences in growth rate and the frequency of environmental change, phenotype costs, and the strength of the selection involved (Bayliss 2009).
Our data indicate that dark‐tolerance is a heritable yet reversible phenotype in Prochlorococcus which is most likely propagated across generations via a yet‐to‐be‐determined epigenetic mechanism. How might this phenotypic variation have come about in the first place? Two common strategies for generating offspring with a distinct phenotype in response to, or in anticipation of, environmental change are bet‐hedging, in which distinct subpopulations of cells with different phenotypes are generated and can be subject to selection, and transgenerational phenotypic plasticity, wherein an organism “senses” specific environmental cues that lead it to alter its phenotype in anticipation of future conditions (Joschinski and Bonte 2020). Bet‐hedging is expected to be favored in unpredictable environments where there could be a large fitness cost for making an “incorrect” decision; phenotypic plasticity, by contrast, is generally favored when environmental cues can be directly sensed to anticipate the most favored phenotype (Simons 2011; Joschinski and Bonte 2020). We think it unlikely that Prochlorococcus continually generates phenotypically distinct subpopulations under normal growth conditions to hedge against the chance of being brought into aphotic waters. Further, a pre‐existing subpopulation of dark‐tolerant cells would have been as readily isolated from the untrained axenic cultures as from the co‐cultures, but they were not. It is possible, however, that a bet‐hedging mechanism led to the observed subpopulation differentiation under the stress of extended darkness. Transgenerational phenotypic plasticity might also be in play in this system, as extended darkness could be reliably sensed by a phototroph like Prochlorococcus. This could in turn be tied into a low‐cost central metabolic signal and be passed on to subsequent generations through an epigenetic mechanism (Bell and Hellmann 2019). While we can only speculate at this point, uncovering the strategy used by Prochlorococcus to generate phenotypic variants represents an important area of future research.
We have demonstrated that dark‐tolerance is mediated by mechanisms within Prochlorococcus, but the fact that co‐culture with Alteromonas is required for the culture to survive long enough for this phenotype to emerge highlights the role that one organism can have in facilitating the adaptive response of another. Mutualistic interactions, in this case with heterotrophic bacteria, can thus influence plasticity and may perhaps lead to reciprocal changes over long periods of time (Agrawal 2001). In this way, the phenotypic variation we describe here could ultimately shape the demographics of the microbial community at large. While we did not observe any genetic or phenotypic changes in Alteromonas (Supporting Information Fig. S2, blue and gray lines), the possibility of unexamined phenotypic changes also warrants further exploration.
A field study that resonates with our observations showed that cells harvested from 397 m in Surgua Bay resumed growth within 2 d when exposed to light (Sohrin et al. 2011), suggesting that picocyanobacteria in the wild are sometimes dark‐tolerant. This makes us wonder whether typical culture conditions like continuous light or a diel light:dark cycle select for the “dark‐sensitive” state—i.e., the state of the parental strains in our experiments. And at what frequency does the dark‐tolerant phenotype occur in different habitats in the wild? One might expect that this phenotype benefits cells in regions where extended dark exposure is frequent, and would be absent in areas that are highly stratified throughout the year such that cells are sequestered in the euphotic zone. Perhaps more importantly, there may also be benefits accrued to the global Prochlorococcus “federation” (sensu Biller et al. 2015a ) through this mechanism; small subpopulations of dark‐tolerant cells could be transported by deep currents to new locations where they could seed surface populations with a new gene pool through upwelling. As there is evidence for frequent exchange of genes among these populations (Biller et al. 2015a ), these variants could contribute to the dispersal of genotypes across broad scales.
While our findings raise more questions than they answer, the dark‐tolerant phenotype is quite striking and consistent—leading one to wonder whether epigenetic phenomena might play a more general role in shaping the ecology and evolution of marine microbes (Walworth et al. 2020). The long generation times of bacteria from this habitat, coupled with the required length of these types of laboratory experiments means that progress will be slow. But it is well worth pursuing.
Conflict of interest
None declared.
Supporting information
DATA S1: Supporting information
Acknowledgments
The authors thank past and present the members of the Chisholm Lab for support and comments, especially Sean Kearney and Rogier Braakman for their valuable input. We also thank Daniel Fisher for valuable discussions that contributed to the interpretation of our data, Zev Cariani for technical assistance, and the MIT BioMicro Center for their role in sequencing efforts. This study was funded in part by grants from the Simons Foundation (Life Sciences Project Award ID 337262, S.W.C.; SCOPE Award ID 329108, S.W.C.). Study in the Greer lab was supported by a National Institutes of Health grant (DP2AG055947 to E.L.G.).
Associate editor: Tatiana Rynearson
Contributor Information
Allison Coe, Email: a_coe@mit.edu.
Sallie W. Chisholm, Email: chisholm@mit.edu.
References
- Agrawal, A. A. 2001. Phenotypic plasticity in the interactions and evolution of species. Science 294: 321–326. doi: 10.1126/science.1060701 [DOI] [PubMed] [Google Scholar]
- Amdaoud, M. , Vallade M., Weiss‐Schaber C., and Mihalcescu I.. 2007. Cyanobacterial clock, a stable phase oscillator with negligible intercellular coupling. Proc Natl Acad Sci USA 104: 7051–7056. doi: 10.1073/pnas.0609315104 [DOI] [PMC free article] [PubMed] [Google Scholar]
- Atack, J. M. , Tan A., Bakaletz L. O., Jennings M. P., and Seib K. L.. 2018. Phasevarions of bacterial pathogens: Methylomics sheds new light on old enemies. Trends Microbiol. 26: 715–726. doi: 10.1016/j.tim.2018.01.008 [DOI] [PMC free article] [PubMed] [Google Scholar]
- Bayliss, C. D. 2009. Determinants of phase variation rate and the fitness implications of differing rates for bacterial pathogens and commensals. FEMS Microbiol. Rev. 33: 504–520. doi: 10.1111/j.1574-6976.2009.00162.x [DOI] [PubMed] [Google Scholar]
- Bell, A. M. , and Hellmann J. K.. 2019. An integrative framework for understanding the mechanisms and multigenerational consequences of transgenerational plasticity. Annu. Rev. Ecol. Evol. Syst. 50: 97–118. doi: 10.1146/annurev-ecolsys-110218-024613 [DOI] [PMC free article] [PubMed] [Google Scholar]
- Berube, P. M. , Biller S. J., Kent A. G., and others . 2015. Physiology and evolution of nitrate acquisition in Prochlorococcus . ISME J. 9: 1195–1207. doi: 10.1038/ismej.2014.211 [DOI] [PMC free article] [PubMed] [Google Scholar]
- Biller, S. J. , Berube P. M., Lindell D., and Chisholm S. W.. 2015a. Prochlorococcus: The structure and function of collective diversity. Nat. Rev. Microbiol. 13: 13–27. doi: 10.1038/nrmicro3378 [DOI] [PubMed] [Google Scholar]
- Biller, S. J. , Coe A., Martin‐Cuadrado A.‐B., and Chisholm S. W.. 2015b. Draft genome sequence of Alteromonas macleodii strain MIT1002, isolated from an enrichment culture of the marine cyanobacterium Prochlorococcus . Genome Announc. 3: e00967–e00915. doi: 10.1128/genomeA.00967-15 [DOI] [PMC free article] [PubMed] [Google Scholar]
- Biller, S. J. , Coe A., Roggensack S. E., and Chisholm S. W.. 2018. Heterotroph interactions alter Prochlorococcus transcriptome dynamics during extended periods of darkness. mSystems 3:e00040‐18. 10.1128/mSystems.00040-18, 3, 3 [DOI] [PMC free article] [PubMed] [Google Scholar]
- Blow, M. J. , others 2016. The Epigenomic landscape of prokaryotes. PLoS Genet. 12: e1005854. doi: 10.1371/journal.pgen.1005854 [DOI] [PMC free article] [PubMed] [Google Scholar]
- Bolger, A. M. , Lohse M., and Usadel B.. 2014. Trimmomatic: a flexible trimmer for Illumina sequence data. Bioinformatics 30: 2114–2120. doi: 10.1093/bioinformatics/btu170 [DOI] [PMC free article] [PubMed] [Google Scholar]
- Boulias, K. , and Greer E. L.. 2021. Detection of DNA methylation in genomic DNA by UHPLC‐MS/MS. Methods Mol Biol (Clifton, NJ) 2198: 79–90. doi: 10.1007/978-1-0716-0876-0_7 [DOI] [PMC free article] [PubMed] [Google Scholar]
- Callieri, C. , and others. 2019. The mesopelagic anoxic Black Sea as an unexpected habitat for Synechococcus challenges our understanding of global “deep red fluorescence”. ISME J. 13: 1676–1687. doi: 10.1038/s41396-019-0378-z [DOI] [PMC free article] [PubMed] [Google Scholar]
- Casselli, T. , Tourand Y., Scheidegger A., Arnold W. K., Proulx A., Stevenson B., and Brissette C. A.. 2018. DNA methylation by restriction modification systems affects the global transcriptome profile in Borrelia burgdorferi . J. Bacteriol. 200: e00395–e00318. doi: 10.1128/JB.00395-18 [DOI] [PMC free article] [PubMed] [Google Scholar]
- Chai, Y. , Norman T., Kolter R., and Losick R.. 2010. An epigenetic switch governing daughter cell separation in Bacillus subtilis . Genes Dev. 24: 754–765. doi: 10.1101/gad.1915010 [DOI] [PMC free article] [PubMed] [Google Scholar]
- Coe, A. , Ghizzoni J., LeGault K., Biller S., Roggensack S. E., and Chisholm S. W.. 2016. Survival of Prochlorococcus in extended darkness. Limnol. Oceanogr. 61: 1375–1388. doi: 10.1002/lno.10302 [DOI] [Google Scholar]
- Cottrell, M. T. , and Kirchman D. L.. 2009. Photoheterotrophic microbes in the Arctic Ocean in summer and winter. Appl. Environ. Microbiol. 75: 4958–4966. doi: 10.1128/AEM.00117-09 [DOI] [PMC free article] [PubMed] [Google Scholar]
- Deatherage, D. E. , Traverse C. C., Wolf L. N., and Barrick J. E.. 2015. Detecting rare structural variation in evolving microbial populations from new sequence junctions using breseq. Front. Genet. 5: 468. doi: 10.3389/fgene.2014.00468 [DOI] [PMC free article] [PubMed] [Google Scholar]
- Dehning, I. , and Tilzer M. M.. 1989. Survival of Scenedesmus acuminatus (chlorophyceae) in darkness. J. Phycol. 25: 509–515. doi: 10.1111/j.1529-8817.1989.tb00256.x [DOI] [Google Scholar]
- DeLong, E. F. , and others. 2006. Community genomics among stratified microbial assemblages in the ocean's interior. Science 311: 496–503. doi: 10.1126/science.1120250 [DOI] [PubMed] [Google Scholar]
- Denman, K. L. , and Gargett A. E.. 1983. Time and space scales of vertical mixing and advection of phytoplankton in the upper ocean. Limnol. Oceanogr. 28: 801–815. doi: 10.4319/lo.1983.28.5.0801 [DOI] [Google Scholar]
- Eiler, A. 2006. Evidence for the ubiquity of mixotrophic bacteria in the upper ocean: Implications and consequences. Appl. Environ. Microbiol. 72: 7431–7437. doi: 10.1128/AEM.01559-06 [DOI] [PMC free article] [PubMed] [Google Scholar]
- Falkowski, P. G. , Ziemann D., Kolber Z., and Bienfang P. K.. 1991. Role of eddy pumping in enhancing primary production in the ocean. Nature 352: 55–58. doi: 10.1038/352055a0 [DOI] [Google Scholar]
- Flombaum, P. , and others. 2013. Present and future global distributions of the marine cyanobacteria Prochlorococcus and Synechococcus . Proc Natl Acad Sci USA 110: 9824–9829. doi: 10.1073/pnas.1307701110 [DOI] [PMC free article] [PubMed] [Google Scholar]
- Harvey, Z. H. , Chen Y., and Jarosz D. F.. 2018. Protein‐based inheritance: Epigenetics beyond the chromosome. Mol. Cell 69: 195–202. doi: 10.1016/j.molcel.2017.10.030 [DOI] [PMC free article] [PubMed] [Google Scholar]
- Hu, L. , Xiao P., Jiang Y., Dong M., Chen Z., Li H., Hu Z., Lei A., and Wang J.. 2018. Transgenerational epigenetic inheritance under environmental stress by genome‐wide DNA methylation profiling in cyanobacterium. Front. Microbiol. 9: 1479. doi: 10.3389/fmicb.2018.01479 [DOI] [PMC free article] [PubMed] [Google Scholar]
- Jiao, N. , Luo T., Zhang R., and others . 2014. Presence of Prochlorococcus in the aphotic waters of the western Pacific Ocean. Biogeosciences 11: 2391–2400. doi: 10.5194/bg-11-2391-2014 [DOI] [Google Scholar]
- Johnson, Z. I. , Zinser E. R., Coe A., McNulty N., Woodward E. M., and Chisholm S. W.. 2006. Niche partitioning among Prochlorococcus ecotypes along ocean‐scale environmental gradients. Science 311: 1737–1740. doi: 10.1126/science.1118052 [DOI] [PubMed] [Google Scholar]
- Joschinski, J. , and Bonte D.. 2020. Transgenerational plasticity and bet‐hedging: A framework for reaction norm evolution. Front. Ecol. Evol. 8: 413. doi: 10.3389/fevo.2020.517183 [DOI] [Google Scholar]
- Kettler, G. C. , and others. 2007. Patterns and implications of gene gain and loss in the evolution of Prochlorococcus . PLoS Genet. 3: e231. doi: 10.1371/journal.pgen.0030231 [DOI] [PMC free article] [PubMed] [Google Scholar]
- Ma, L. , Calfee B. C., Morris J. J., Johnson Z. I., and Zinser E. R.. 2017. Degradation of hydrogen peroxide at the ocean's surface: The influence of the microbial community on the realized thermal niche of Prochlorococcus . ISME J. 12: 473–484. doi: 10.1038/ismej.2017.182 [DOI] [PMC free article] [PubMed] [Google Scholar]
- Malmstrom, R. R. , Coe A., Kettler G. C., Martiny A. C., Frias‐Lopez J., Zinser E. R., and Chisholm S. W.. 2010. Temporal dynamics of Prochlorococcus ecotypes in the Atlantic and Pacific oceans. ISME J. 4: 1252–1264. doi: 10.1038/ismej.2010.60 [DOI] [PubMed] [Google Scholar]
- Mihalcescu, I. , Hsing W., and Leibler S.. 2004. Resilient circadian oscillator revealed in individual cyanobacteria. Nature 430: 81–85. doi: 10.1038/nature02533 [DOI] [PubMed] [Google Scholar]
- Miller, D. , Pfreundt U., Hou S., Lott S. C., Hess W. R., and Berman‐Frank I.. 2017. Winter mixing impacts gene expression in marine microbial populations in the Gulf of Aqaba. Aquat. Microb. Ecol. 80: 223–242. doi: 10.3354/ame01854 [DOI] [Google Scholar]
- Moore, L. R. , and Chisholm S. W.. 1999. Photophysiology of the marine cyanobacterium Prochlorococcus: Ecotypic differences among cultured isolates. Limnol. Oceanogr. 44: 628–638. doi: 10.4319/lo.1999.44.3.0628 [DOI] [Google Scholar]
- Moore, L. R. , Coe A., Zinser E. R., Saito M. A., Sullivan M. B., Lindell D., Frois‐Moniz K., Waterbury J., and Chisholm S. W.. 2007. Culturing the marine cyanobacterium Prochlorococcus . Limnol Oceanogr Methods 5: 353–362. doi: 10.4319/lom.2007.5.353 [DOI] [Google Scholar]
- Morris, J. J. , Johnson Z. I., Szul M. J., Keller M., and Zinser E. R.. 2011. Dependence of the cyanobacterium Prochlorococcus on hydrogen peroxide scavenging microbes for growth at the ocean's surface. PLoS One 6: e16805. doi: 10.1371/journal.pone.0016805 [DOI] [PMC free article] [PubMed] [Google Scholar]
- Morris, J. J. , Kirkegaard R., Szul M. J., Johnson Z. I., and Zinser E. R.. 2008. Facilitation of robust growth of Prochlorococcus colonies and dilute liquid cultures by “helper” heterotrophic bacteria. Appl. Environ. Microbiol. 74: 4530–4534. doi: 10.1128/AEM.02479-07 [DOI] [PMC free article] [PubMed] [Google Scholar]
- Morris, J. J. , Lenski R. E., and Zinser E. R.. 2012. The black queen hypothesis: Evolution of dependencies through adaptive gene loss. MBio 3: e00036–e00012. doi: 10.1128/mBio.00036-12 [DOI] [PMC free article] [PubMed] [Google Scholar]
- Mouammine, A. , and Collier J.. 2018. The impact of DNA methylation in Alphaproteobacteria. Mol. Microbiol. 110: 1–10. doi: 10.1111/mmi.14079 [DOI] [PubMed] [Google Scholar]
- Muñoz‐Marín, M. C. , Gómez‐Baena G., López‐Lozano A., Moreno‐Cabezuelo J. A., Díez J., and García‐Fernández J. M.. 2020. Mixotrophy in marine picocyanobacteria: Use of organic compounds by Prochlorococcus and Synechococcus . ISME J. 14: 1065–1073. doi: 10.1038/s41396-020-0603-9 [DOI] [PMC free article] [PubMed] [Google Scholar]
- O'Brown, Z. K. , Boulias K., Wang J., and others. 2019. Sources of artifact in measurements of 6 mA and 4 mC abundance in eukaryotic genomic DNA. BMC Genom 20: 445. doi: 10.1186/s12864-019-5754-6 [DOI] [PMC free article] [PubMed] [Google Scholar]
- Rando, O. J. , and Verstrepen K. J.. 2007. Timescales of genetic and epigenetic inheritance. Cell 128: 655–668. doi: 10.1016/j.cell.2007.01.023 [DOI] [PubMed] [Google Scholar]
- Rocap, G. , Distel D. L., Waterbury J. B., and Chisholm S. W.. 2002. Resolution of Prochlorococcus and Synechococcus ecotypes by using 16S‐23S ribosomal DNA internal transcribed spacer sequences. Appl. Environ. Microbiol. 68: 1180–1191. doi: 10.1128/AEM.68.3.1180-1191.2002 [DOI] [PMC free article] [PubMed] [Google Scholar]
- Roth‐Rosenberg, D. , Aharonovich D., Luzzatto‐Knaan T., and others . 2020. Prochlorococcus cells rely on microbial interactions rather than on chlorotic resting stages to survive long‐term nutrient starvation. mBio: 11. doi: 10.1128/mBio.01846-20 [DOI] [PMC free article] [PubMed] [Google Scholar]
- Saito, M. A. , Moffett J. W., Chisholm S. W., and Waterbury J. B.. 2002. Cobalt limitation and uptake in Prochlorococcus . Limnol. Oceanogr. 47: 1629–1636. doi: 10.4319/lo.2002.47.6.1629 [DOI] [Google Scholar]
- Schwartz, M. H. , and others. 2018. Microbiome characterization by high‐throughput transfer RNA sequencing and modification analysis. Nat. Commun. 9: 5353. doi: 10.1038/s41467-018-07675-z [DOI] [PMC free article] [PubMed] [Google Scholar]
- Shibl, A. A. , Thompson L. R., Ngugi D. K., and Stingl U.. 2014. Distribution and diversity of Prochlorococcus ecotypes in the Red Sea. FEMS Microbiol. Lett. 356: 118–126. doi: 10.1111/1574-6968.12490 [DOI] [PubMed] [Google Scholar]
- Simons, A. M. 2011. Modes of response to environmental change and the elusive empirical evidence for bet hedging. Proc. R. Soc. B Biol. Sci. 278: 1601–1609. doi: 10.1098/rspb.2011.0176 [DOI] [PMC free article] [PubMed] [Google Scholar]
- Smayda, T. J. , and Mitchell‐Innes B.. 1974. Dark survival of autotrophic, planktonic marine diatoms. Mar. Biol. 25: 195–202. doi: 10.1007/BF00394965 [DOI] [Google Scholar]
- Sohrin, R. , Isaji M., Obara Y., Agostini S., Suzuki Y., Hiroe Y., Ichikawa T., and Hidaka K.. 2011. Distribution of Synechococcus in the dark ocean. Aquat. Microb. Ecol. 64: 1–14. doi: 10.3354/ame01508 [DOI] [Google Scholar]
- Steglich, C. , Futschik M., Rector T., Steen R., and Chisholm S. W.. 2006. Genome‐wide analysis of light sensing in Prochlorococcus . J. Bacteriol. 188: 7796–7806. doi: 10.1128/JB.01097-06 [DOI] [PMC free article] [PubMed] [Google Scholar]
- Stucken, K. , Koch R., and Dagan T.. 2013. Cyanobacterial defense mechanisms against foreign DNA transfer and their impact on genetic engineering. Biol. Res. 46: 373–382. doi: 10.4067/S0716-97602013000400009 [DOI] [PubMed] [Google Scholar]
- Thorpe, S. A. 2004. Recent developments in the study of ocean turbulence. Annu. Rev. Earth. Planet. Sci. 32: 91–109. [Google Scholar]
- Tock, M. R. , and Dryden D. T.. 2005. The biology of restriction and anti‐restriction. Curr. Opin. Microbiol. 8: 466–472. doi: 10.1016/j.mib.2005.06.003 [DOI] [PubMed] [Google Scholar]
- Turner, K. H. , Vallet‐Gely I., and Dove S. L.. 2009. Epigenetic control of virulence gene expression in Pseudomonas aeruginosa by a LysR‐type transcription regulator. PLoS Genet. 5: e1000779. doi: 10.1371/journal.pgen.1000779 [DOI] [PMC free article] [PubMed] [Google Scholar]
- Veening, J.‐W. , Stewart E. J., Berngruber T. W., Taddei F., Kuipers O. P., and Hamoen L. W.. 2008. Bet‐hedging and epigenetic inheritance in bacterial cell development. Proc. Natl. Acad. Sci. USA 105: 4393–4398. doi: 10.1073/pnas.0700463105 [DOI] [PMC free article] [PubMed] [Google Scholar]
- Vilibić, I. , and Šantić D.. 2008. Deep water ventilation traced by Synechococcus cyanobacteria. Ocean Dyn. 58: 119–125. doi: 10.1007/s10236-008-0135-8 [DOI] [Google Scholar]
- Walter, B. , Peters J., and van Beusekom J. E. E.. 2017. The effect of constant darkness and short light periods on the survival and physiological fitness of two phytoplankton species and their growth potential after re‐illumination. Aquat. Ecol. 51: 591–603. doi: 10.1007/s10452-017-9638-z [DOI] [Google Scholar]
- Walworth, N. G. , Zakem E. J., Dunne J. P., Collins S., and Levine N. M.. 2020. Microbial evolutionary strategies in a dynamic ocean. Proc. Natl. Acad. Sci. USA 117: 5943–5948. doi: 10.1073/pnas.1919332117 [DOI] [PMC free article] [PubMed] [Google Scholar]
- West, N. J. , and Scanlan D. J.. 1999. Niche‐partitioning of Prochlorococcus populations in a stratified water column in the eastern North Atlantic Ocean. Appl. Environ. Microbiol. 65: 2585–2591. [DOI] [PMC free article] [PubMed] [Google Scholar]
- White, A. W. 1974. Growth of two Facultatively heterotrophic marine centric diatoms. J. Phycol. 10: 292–300. doi: 10.1111/j.1529-8817.1974.tb02717.x [DOI] [Google Scholar]
- Wilson, K. 2001. Preparation of genomic DNA from bacteria. Curr Protoc Mol Biol 56: 2.4.1–2.4.5. doi: 10.1002/0471142727.mb0204s56 [DOI] [PubMed] [Google Scholar]
- Xue, B. , and Leibler S.. 2016. Evolutionary learning of adaptation to varying environments through a transgenerational feedback. Proc Natl Acad Sci USA 113: 11266–11271. doi: 10.1073/pnas.1608756113 [DOI] [PMC free article] [PubMed] [Google Scholar]
- Yelton, A. P. , Acinas S. G., Sunagawa S., Bork P., Pedrós‐Alió C., and Chisholm S. W.. 2016. Global genetic capacity for mixotrophy in marine picocyanobacteria. ISME J. 10: 2946–2957. doi: 10.1038/ismej.2016.64 [DOI] [PMC free article] [PubMed] [Google Scholar]
- Yuan, A. H. , and Hochschild A.. 2017. A bacterial global regulator forms a prion. Science 355: 198–201. doi: 10.1126/science.aai7776 [DOI] [PMC free article] [PubMed] [Google Scholar]
- Zinser, E. R. , Coe A., Johnson Z. I., Martiny A. C., Fuller N. J., Scanlan D. J., and Chisholm S. W.. 2006. Prochlorococcus ecotype abundances in the North Atlantic Ocean as revealed by an improved quantitative PCR method. Appl. Environ. Microbiol. 72: 723–732. doi: 10.1128/AEM.72.1.723-732.2006 [DOI] [PMC free article] [PubMed] [Google Scholar]
- Zinser, E. R. , and others. 2009. Choreography of the transcriptome, photophysiology, and cell cycle of a minimal photoautotroph, Prochlorococcus . PLoS One 4: e5135. doi: 10.1371/journal.pone.0005135 [DOI] [PMC free article] [PubMed] [Google Scholar]
Associated Data
This section collects any data citations, data availability statements, or supplementary materials included in this article.
Supplementary Materials
DATA S1: Supporting information