

Abstract
In Uganda, the borders are highly porous to animal movement, which may contribute to zoonotic disease spread. We piloted an animal adaptation of an existing human‐focused toolkit to collect data on animal movement patterns and interactions to inform One Health programs. During January 2020, we conducted focus group discussions and key informant interviews with participatory mapping of 2 national‐level One Health stakeholders and 2 local‐level abattoir representatives from Kampala. Zoonotic disease hotspots changed in 2020 compared with reports from 2017–2019. In contrast to local‐level participants, national‐level participants highlighted districts rather than specific locations. Everyone discussed livestock species; only national‐level participants mentioned wildlife. Participants described seasonality differently. Stakeholders used the results to identify locations for zoonotic disease interventions and sites for future data collection. This implementation of an animal‐adapted population mobility mapping exercise highlights the importance of multisectoral initiatives to promote One Health border health approaches.
Keywords: One Health, Uganda, zoonoses
Impacts.
Uganda's borders are highly porous to animal movement.
Zoonotic disease outbreaks may result from cross‐border spread by animals.
Characterizing animal mobility can improve zoonotic disease prevention and control.
Uganda piloted a toolkit to characterize and map animal mobility.
1. INTRODUCTION
Addressing the spread of zoonotic diseases is a complex global health needs requiring interdisciplinary and multisectoral expertise and cooperation from governmental, non‐governmental and educational agencies. One Health is a collaborative, multisectoral and transdisciplinary approach—working at the local, regional, national and global levels—with the goal of achieving optimal health outcomes recognizing the interconnection between people, animals, plants and their shared environment (CDC, 2020). In Uganda, the One Health platform prioritized the following seven zoonoses in 2017 through a multisectoral, One Health Zoonotic Disease Prioritization workshop: anthrax, zoonotic influenza, viral haemorrhagic fevers, brucellosis, trypanosomiasis, plague and rabies (CDC, 2017; Sekamatte et al., 2018). Six of the 7 priority zoonotic diseases have been reported in Uganda in recent years, especially in the West Nile region of Uganda bordering South Sudan and the Democratic Republic of the Congo (DRC).
In Uganda, the borders are highly porous to informal animal and human movement, which is common in countries where animal production is not intensive (Valerio et al., 2020; JEE, 2017). Mitigating the importation, exportation or further spread of zoonoses requires their prevention, detection and control at ground crossings, along the porous land border and in border communities. This includes regular disease surveillance, the compulsory notification of prescribed zoonoses, animal inspection, movement quarantines, isolation of infected premises, testing, treatment or vaccination and the depopulation of infected animals or contaminated materials (OIE terrestrial code). All these interventions require knowledge of where, when and why animal populations move and interact with each other and with people (Merrill et al., 2017). This information is key in understanding areas at highest risk for spread of zoonotic disease and where preparedness, detection and response efforts should be focused (Munyua et al., 2016; Oyas et al., 2018). However, the movement and connections of animals and trade systems are highly complex and dynamic, and concrete data are often scarce (Valerio et al., 2020).
With technical support from the US Centers for Disease Control and Prevention (CDC), the Uganda National One Health Platform and the Infectious Diseases Institute (IDI) have implemented human population movement risk assessments in the districts of West Nile and other parts of Uganda using the Population Connectivity Across Borders (PopCAB) toolkit. The PopCAB package is a low‐burden tool used to characterize the formal and informal movement patterns and connectivity of mobile populations across and around borders. PopCAB facilitates the collection of qualitative, quantitative and geospatial data through national‐ and local‐level focus group discussions (FGD) or key informant interviews (KII) with participatory mapping (Merrill et al., 2021; Nakiire et al., 2020). This toolkit has been implemented in multiple African countries to address a variety of needs, including overall preparedness planning and to inform responses to Ebola and Lassa fever outbreaks (Kakaī et al., 2020; Merrill et al., 2021; Nanziri et al., 2020).
In line with their mission to support One Health, the Uganda Ministry of Agriculture, Animal Industries and Fisheries (MAAIF) collaborated with IDI and CDC to support the prevention of zoonotic disease spread in Uganda. Through planning discussions, the Ugandan districts of Arua and Moyo were selected to pilot the adaptation of PopCAB to characterize cross‐border and national‐level movement of animals that may spread zoonotic diseases across the tri‐state area of Uganda, South Sudan and DRC. The specific objectives were to collect preliminary data on animal movement patterns; generate maps illustrating animal movements and interactions; identify geographic areas for zoonoses prevention and control interventions, including areas for future local‐level animal‐adapted PopCAB; and disseminate results to stakeholders to facilitate discussions to strengthen multisectoral interventions and develop action plans. We present the initial results from our pilot, in advance of completing more in‐depth local‐level data collection, to inform others collecting animal movement data for the purposes of preventing cross‐border and intracountry spread of zoonotic diseases.
2. METHODS
The IDI and CDC conducted initial stakeholder engagement in 2018 and 2019 with MAAIF, the Uganda Ministry of Health (MOH) veterinary public health and surveillance teams, the Uganda country office of the Food and Agricultural Organization of the United Nations (FAO), Makarere University, the Uganda Wildlife Authority (UWA) and Veterinarians Without Borders (VSF). In preparation for these discussions, we identified recent zoonotic disease outbreaks in Uganda through desk review and facilitated discussions. Based on these discussions, we identified the Arua and Moyo districts for data collection activities, along with a plan for preliminary activities at both the national level and the local level in Kampala to evaluate the adapted toolkit. PopCAB materials, primarily the FGD and KII discussion guides, were adapted by MOH, CDC and IDI to tailor the guides to the zoonotic disease and animal movement context. We also made minor modifications to base maps, database structure and facilitator training materials as needed to match the discussion guides (Table S1). Changes were not made during this study to any materials, although after action discussions were used to identify areas for improvement. CDC and the Uganda agencies approved the project through formal review that determined that the initiative did not meet the definition of research.
Infectious Diseases Institute facilitated 1 national‐level FGD with 10 participants from MAAIF, 1 national‐level KII with 1 FAO representative and 2 local‐level FGD with the Wambizi pig abattoir (8 participants) and the City Market abattoir (5 participants). The City Market abattoir is one of the largest in the country, receiving animals from across Uganda and neighbouring countries.
Prior to the FGD or KII, participants were oriented to the purpose of the activity and given time to become familiar and comfortable with the map. Facilitators used the FGD and KII discussion guides and relevant maps to ask participants to identify and describe areas of interest where they take or see animals. Participants identified routes of interest, areas of animal interaction and areas that fit with criteria as having One Health priority (e.g., history of zoonotic disease outbreaks, large numbers of animals, busy marketplace). Probing questions were used to inquire about the why, when and how of the animal movement, and where animals go after they reach the identified locations. The FGD and KII discussion guides were modified to include probing questions specific to animals and zoonotic diseases, including animal species (large livestock, small ruminants, pigs and wildlife), animal dispositions (live animals, fresh animal products and other animal products), methods of animal transportation, unique events with animal movement and seasonality of movement.
Base maps were adapted to facilitate participatory mapping for animal locations and movement. National park boundaries, areas that might be used for grazing (e.g., large areas of grassland) and known markets and abattoirs were included in the base maps for Uganda, Kampala city and the Moyo and Arua districts. Facilitators from MOH and IDI recorded verbatim transcripts of the FGD and KII. Facilitators and notetakers collaborated to link specific locations and routes on the map with the verbatim notes using unique letter IDs. Additional map annotations were used, including animal species. After each FGD and KII, the notes were consolidated, unique IDs checked and map markings clarified for correctness. Using the typed notes and annotated map, each unique location and route were geocoded and listed in an Excel database.
We extracted information from the discussion notes about locations, animal species/type, seasonality/temporality, type of movement, reason for movement and number of animals. Results were analysed for major themes. Digital maps were created using ArcGIS and AdobePro software to reflect the animal PopCAB results and locations of previous and current zoonotic disease outbreaks (Figure 1) and key locations, routes and animal species/type (Figure 2). After the January pilot, MOH, CDC and IDI adapted the discussion guides and implementation process based on feedback from participants and facilitators.
FIGURE 1.
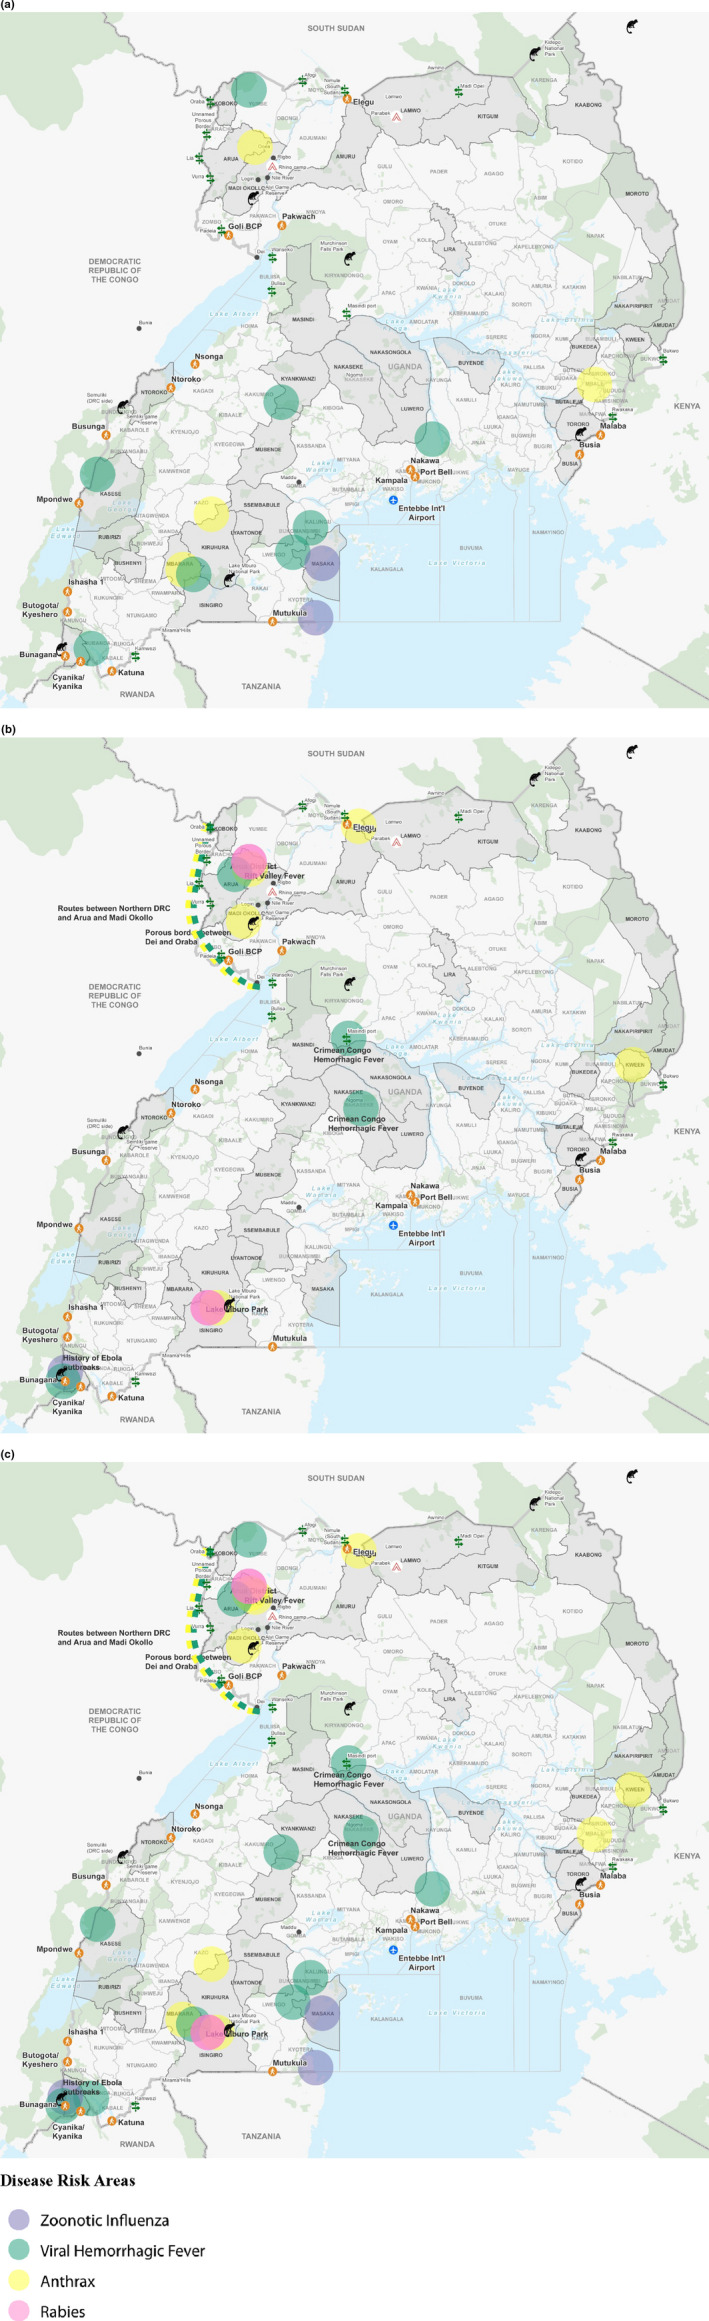
(a, b and c): Locations of zoonotic disease outbreaks between 2015 and 2018 (a), zoonotic disease outbreaks between 2019 and 2020 (b) and all zoonotic disease outbreaks (c) mentioned by participants from focus group discussions with the Ministry of Agriculture, Animal Industries and Fisheries, The Wambizi Abattoir and the City Market Abattoir and a key informant interview with the Food and Agricultural Organization. *Districts in grey with bold names were specifically mentioned by participants
FIGURE 2.
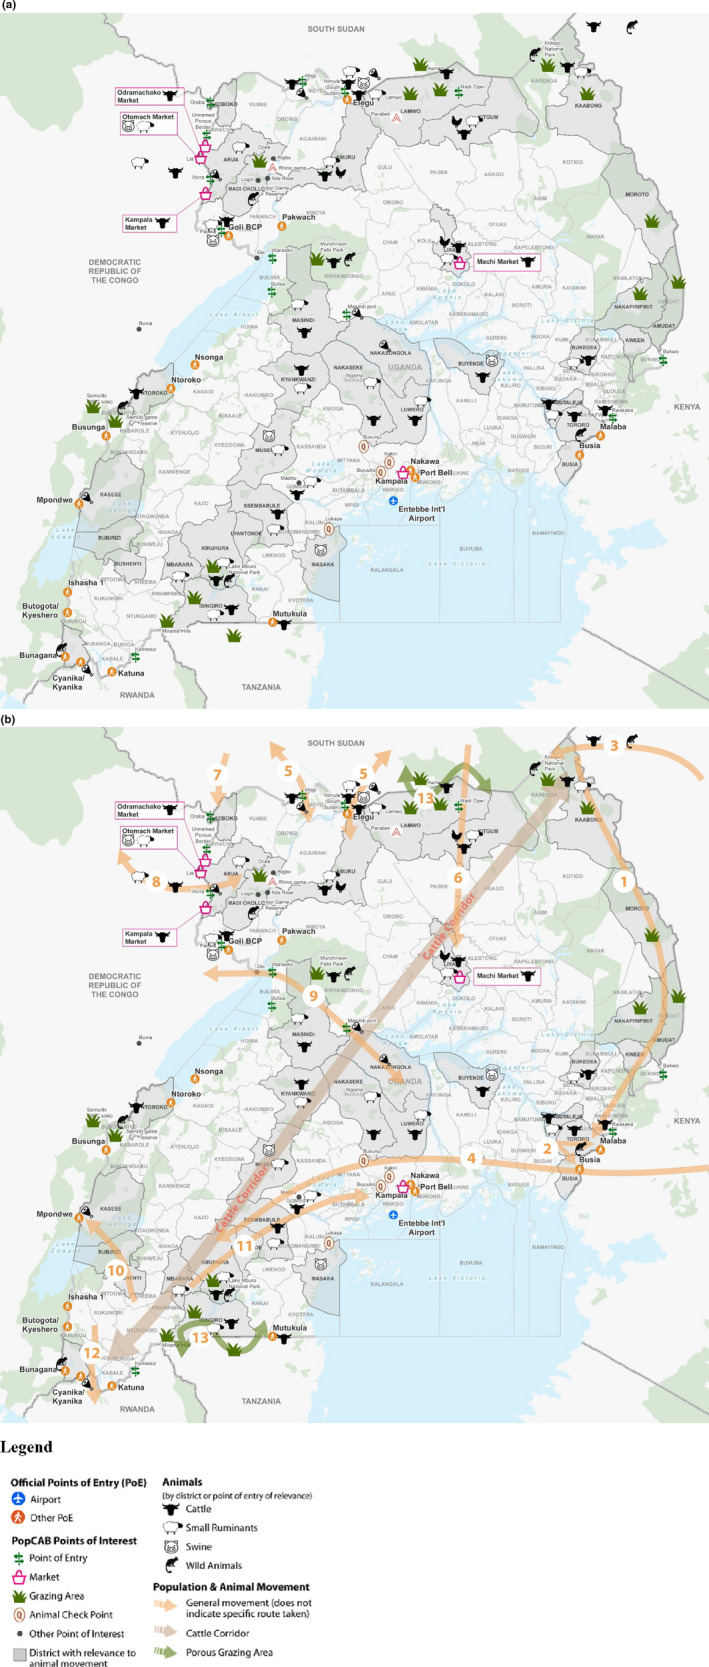
(a and b): Key locations, animal species and grazing areas (a) and major routes (b) mentioned by participants from focus group discussions with the Ministry of Agriculture, Animal Industries and Fisheries, The Wambizi Abattoir and the City Market Abattoir and a key informant interview with the Food and Agricultural Organization. *Districts in grey with bold names were specifically mentioned by participants
3. RESULTS
Districts, rather than specific locations and routes, were the most frequently mentioned locations, mentioned equally in number across the four stakeholder groups (Table 1). When describing movement patterns, participants at the national level highlighted districts, rather than specific locations, as destinations or points of origin. However, points of entry were mentioned 22 times, with MAAIF identifying 20 of these. MAAIF and FAO referenced grazing areas 18 times, but neither abattoir mentioned them; however, only the abattoirs highlighted other abattoirs in Uganda. Cross‐border routes to South Sudan, DRC, Kenya and Tanzania were mentioned primarily by MAAIF and FAO. The DRC was referenced the most (11 mentions).
TABLE 1.
Mentions of locations, species, zoonoses and types of and reasons for movement, mentioned by participants from focus group discussions with the Ministry of Agriculture, Animal Industries and Fisheries, The Wambizi Abattoir and the City Market Abattoir and a key informant interview with the Food and Agricultural Organization
|
All (24 participants) |
MAAIF a (10 participants) |
FAO b (1 participant) |
Wambizi abattoir (8 participants) |
City Market abattoir (5 participants) |
|
|---|---|---|---|---|---|
| Locations | |||||
| Districts | 40 | 15 | 4 | 6 | 15 |
| Routes | 34 | 11 | 9 | 5 | 9 |
| Point of entry | 22 | 20 | 1 | 0 | 1 |
| Grazing areas | 18 | 7 | 11 | 0 | 0 |
| Abattoirs | 12 | 0 | 0 | 4 | 8 |
| Butchers | 9 | 0 | 0 | 0 | 9 |
| Towns | 6 | 1 | 4 | 0 | 1 |
| Park/reserve | 6 | 2 | 4 | 0 | 0 |
| Animal check points | 4 | 0 | 0 | 0 | 4 |
| Cattle market | 1 | 1 | 0 | 0 | 0 |
| Refugee settlement | 1 | 1 | 0 | 0 | 0 |
| Water source | 1 | 1 | 0 | 0 | 0 |
| Cross‐border routes | |||||
| To/From DRC c | 11 | 4 | 7 | 0 | 0 |
| To/From Kenya | 9 | 5 | 4 | 0 | 0 |
| To/From South Sudan | 8 | 4 | 3 | 0 | 1 |
| To/From Tanzania | 3 | 1 | 2 | 0 | 0 |
| Species | |||||
| Cattle | 66 | 15 | 11 | 11 | 29 |
| Small ruminants | 45 | 3 | 4 | 9 | 29 |
| Swine | 17 | 3 | 0 | 14 | 0 |
| Wildlife | 10 | 6 | 4 | 0 | 0 |
| Animal products | 7 | 7 | 0 | 0 | 0 |
| Zoonoses | |||||
| Anthrax | 11 | 5 | 6 | 0 | 0 |
| Rift Valley Fever | 4 | 1 | 3 | 0 | 0 |
| Brucellosis | 4 | 1 | 3 | 0 | 0 |
| Trypanosomiasis | 2 | 1 | 1 | 0 | 0 |
| Rabies | 2 | 1 | 1 | 0 | 0 |
| CCHF d | 2 | 2 | 0 | 0 | 0 |
| Ebola | 2 | 2 | 0 | 0 | 0 |
| Production diseases e | 2 | 0 | 0 | 2 | 0 |
| Zoonotic influenza | 1 | 1 | 0 | 0 | 0 |
| Type of movement | |||||
| Moving by lorry/truck | 50 | 0 | 2 | 19 | 29 |
| Informal movement | 20 | 13 | 7 | 0 | 0 |
| Moving on foot | 5 | 0 | 5 | 0 | 0 |
| Moving by ferry | 5 | 5 | 0 | 0 | 0 |
| Moving by motorcycle | 5 | 0 | 0 | 0 | 5 |
| Controlled movement | 2 | 2 | 0 | 0 | 0 |
| Reason for moving | |||||
| Slaughter | 50 | 2 | 0 | 19 | 29 |
| Grazing/watering | 17 | 6 | 11 | 0 | 0 |
| Trade | 13 | 8 | 0 | 0 | 5 |
Ministry of Agriculture, Animal Industries and Fisheries.
Food and Agriculture Organization.
The Democratic Republic of the Congo.
Crimean Congo Hemorrhagic Fever.
Non‐zoonotic diseases.
Cattle were the most discussed animal (66 mentions). Small ruminants were mentioned more by the City Market abattoir (29 mentions) than any other stakeholder group. Only MAAIF and FAO referenced wildlife or animal products. The City Market abattoir mentioned all animal species with the highest frequency.
Anthrax was the most mentioned zoonotic disease, both in number and locations of outbreaks, and Rift Valley fever (RVF) was the second most mentioned disease. Brucellosis was the third most mentioned disease, but it was not mentioned by either abattoir stakeholder group. Informal movement (not through a monitored POE or check‐point) was the most common type of movement described (91% of movement) compared with controlled movement (9%). Slaughter was the most frequently mentioned reason for movement (50 mentions).
Locations of zoonotic disease events changed in 2020 from reports collected between 2017 and2019, as shown by Figure 1. New hotspots for zoonoses were identified (1B), and some previously identified hotspots (1A) were no longer mentioned by stakeholders.
Mapping of animal species by town and district highlighted the widespread farming and grazing land in Uganda and hotspots of particular species (Figure 2a). Stakeholders described the informal movement of animals from Kenya to Uganda and the formal movement of animal products back to Kenya (Figure 2b). National‐level stakeholders mentioned areas of national parks spanning 2 countries where moving livestock had heavy interaction with the wildlife populations. Particularly porous stretches of the border were described by MAAIF, both near and far from points of entry used for transboundary animal grazing. Additionally, numerous movement patterns and connection points between routes identified within Uganda.
Participants described seasonality of movement differently (Figure 3). MAAIF highlighted lower trade and pastoral movement during the May to September period, but FAO highlighted a longer period starting in February. Both abattoir groups discussed the higher abundance of animals in rainy seasons, which correlates well with the main selling season occurring in the dry season, as highlighted by MAAIF. No participants discussed ecological changes, nor the movement of vector species, such as mosquitoes or ticks.
FIGURE 3.
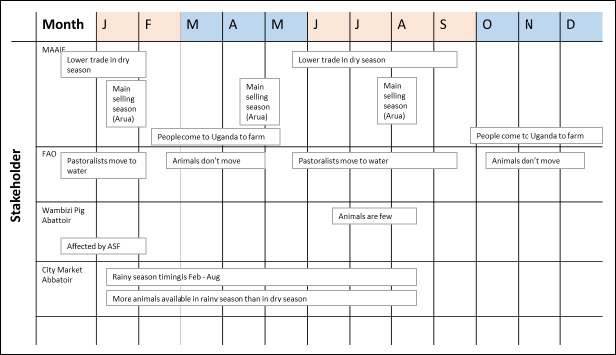
Seasonality patterns mentioned by participants from focus group discussions with the Ministry of Agriculture, Animal Industries and Fisheries (MAAIF), The Wambizi Abattoir and the City Market Abattoir and a key informant interview with the Food and Agricultural Organization (FAO). Known dry months are shown in beige and known rainy months shown in blue
4. DISCUSSION
The pilot demonstrated that the animal PopCAB adaptation can rapidly collect diverse and granular data to characterize animal movement. Also, this activity was a forum to bring together multiple One Health stakeholders, not just for sharing knowledge but also learning from colleagues through the process. Information on animal movements and interactions is critical in developing prevention, control and emergency plans for zoonotic diseases at the national, district and sub‐district levels. National‐ and local‐level knowledge of animal movement is expected to differ based on direct experience and animal or human health priorities. As locations became more granular (points of entry, abattoirs, markets), they were mentioned more favourably by distinct stakeholders, abattoirs mentioned most by the abattoirs and points of entry or grazing areas mentioned more by MAAIF and FAO. This reflects the importance of identifying multiple diverse stakeholders when the topic in question is as broad as animal movement.
The One Health approach to preventing the spread of zoonotic diseases, especially cross‐border, is an emerging topic of interest to multiple sectors and agencies. In response to Uganda's concern about the cross‐border spread of zoonotic disease and efforts to promote border health, population mobility mapping tools were adapted to the animal context to fill the knowledge gap about where animals are moving, how they move and interact and the reasons for moving. Pilot implementation and results highlight areas of strength or places for improvement for the animal adaption of PopCAB in facilitation, data collection and data management.
4.1. Results interpretation
In Uganda, cattle are the most prevalent livestock species, and it is unsurprising that they were most frequently mentioned across all 4 stakeholder groups (Uganda Bureau of Statistics, 2016). Given the findings that abattoirs mentioned all animal species with the highest frequency, stakeholders such as City Market are key in gathering large amounts of data about multiple species, as their daily experience encompasses that of many other stakeholders. Only the national‐level groups discussed wildlife consistently. Thus, a diverse assembly of stakeholders is key in gathering well‐rounded information.
Informal movement was the most common type of movement described (91%), and this correlates well with the national‐level information that the majority of cross‐border animal movement is informal. The ratio of animals mentioned is in line with animal population estimates for Uganda and the informal/formal movement percentages match expectations (Uganda Bureau of Statistics, 2016). This is supportive of the data well representing the big picture of animal movement for Uganda, although true representativeness is impossible. However, homogeny of results is not a reliable marker of quality data for this tool, as stakeholders may provide contrary data based on what information they both know and prioritize.
Anthrax and RVF were mentioned most frequently, which correlates with notable outbreaks in Uganda since 2017, including the anthrax hippopotamus outbreak, and RVF outbreaks in multiple districts (Cossaboom et al., 2019; Kisaakye et al., 2018; Nyakarahura et al., 2019). Of interest, brucellosis was the third most mentioned disease, but although it is a disease of concern to abattoir workers, it was not mentioned by either abattoir stakeholder group. This may be because FGD facilitation did not focus on this topic or the abattoir participants did not see this information as relevant. For either reason, the importance of engaging multiple diverse stakeholders cannot be overstated, as collecting data as representative as possible is unlikely if a narrow range of stakeholders is engaged. Also, locations of zoonotic disease hotspots can shift over time and this has substantial implications for resource allocation and intensity of surveillance efforts.
4.2. Implementation
The IDI facilitators were engaged early in the process of defining the project objectives. This early collaboration was key in successful adaptation of the FGD discussion guides and FGD and KII facilitation. Although a discussion guide can ensure key themes are discussed with participants, facilitators need to know how to guide the topics and details because time to conduct the FGD is limited. The discussion guides should always be adapted prior to use, ensuring local nuances are captured and that the discussion themes match the objectives. For example, the local‐level pilot activity clarified that the initial local‐level base maps, which reflected district‐level information, were challenging to use because animal movement was rarely restricted to the district. Future projects may need to consider a supplemental national‐level map for local‐level FGD and KII.
Advanced planning for more complex map annotation was critical in this project because there were more variables to consider in the animal context than the human context, including grazing areas, multiple animal species and complicated seasonal patterns. Although the map annotation was mostly successful, some discrepancies between the map and the written verbatim notes indicated that more facilitator and note‐taking training was required to ensure map annotations were correctly linked to the notes. Themes such as seasonality or number of animals were particularly challenging to capture in the verbatim notes and the Excel database. Because one 45‐min FGD often provides insufficient time to gather complete information about each component, prioritizing 2 or 3 themes for each discussion may reduce stress on the facilitators and participants and ensure higher quality and focused data.
4.3. Results application
Cognizant of the highly porous borders in Uganda, stakeholders were interested in learning how animals live and animal products move across these borders; frequency of animal inspection at points of entry; and how animals move in‐country. All stakeholders wanted to learn more about which areas were affected by priority zoonoses to target public health interventions. Identifying areas of interaction of wildlife, livestock and people were key priorities at the national level so that the results could assist in positioning screening or isolation facilities. Building on this, providing public health officers with a strategic view of animal movement in district‐ and local‐level contexts was important for resource allocation.
Feedback from facilitators and stakeholders indicated that a large amount of important data were collected through a relatively quick and easy process. Stakeholders felt that both the database and digital map provided key information on inter‐ and intracountry movement and areas of high animal density. Of note, they felt the information on why certain areas had high animal density or were places of connectivity were critical information for applying this data to targeted interventions. These interventions included targeted surveillance or risk communication in major animal trading and grazing districts.
This pilot indicated areas for improvement in the future iterations of this animal‐adapted tool. The diversity of results on the same topic between the stakeholder groups indicate that involvement of diverse non‐governmental stakeholders is necessary to collect comprehensive and representative information. Innovative adaptations were proposed, including expanding data collection to include ecological patterns and vector movement, both of which are related to the spread of zoonoses. Dissemination of results to districts is also needed to support zoonotic disease surveillance initiatives both in Uganda and within the region. In addition, the activity itself provides a unique forum to educate participants on zoonotic diseases and disease reporting, which was not a pre‐planned objective of this pilot, a need especially identified for participants at higher risk of zoonotic disease infections, such as abattoir workers.
Finally, due to COVID‐19 and the need to promote physical distancing or limit travel of facilitators, stakeholders suggested adapting the toolkit to support remote animal PopCAB activities. Training districts on the toolkit for routine data collection could replace the need for remote activities and bridge the gap of information scarcity.
4.4. Summary
This pilot of an animal‐adapted toolkit to gather information on population mobility highlights the importance of multisectoral initiatives to promote border health with a One Health approach, an emerging hot topic. Uganda is taking proactive steps to prevent cross‐border and inter‐district spread of priority zoonotic diseases. Results of the pilot and feedback from stakeholders and participants indicate that further use of this toolkit can provide granular and useful data at the national, district and sub‐district levels.
CONFLICT OF INTEREST
All authors state that they have no conflicts of interest to declare.
DISCLAIMER
The findings and conclusions in this report are those of the authors and do not necessarily represent the official position of the Centers for Disease Control and Prevention.
Supporting information
Table S1
ACKNOWLEDGEMENTS
The Uganda Ministry of Agriculture, Animal Industries and Fisheries, National animal Disease Diagnostic and Epidemiology Centre, the Uganda Ministry of Health, the Uganda Wildlife Authority, the Uganda country office of the Food and Agricultural Organization of the United Nations (FAO), the Infectious Diseases Institute, City Market Abattoir, Wambizi Swine Abattoir, David Muwanguzi, Issa Makumbi, Mabumba Eldard.
Medley AM, Gasanani J, Nyolimati CA, et al. Preventing the cross‐border spread of zoonotic diseases: Multisectoral community engagement to characterize animal mobility—Uganda, 2020. Zoonoses Public Health. 2021;68:747–759. 10.1111/zph.12823
Funding information
This work was supported by the Centers for Disease Control and Prevention [Global Health Security Agenda, 2019‐2020].
DATA AVAILABILITY STATEMENT
The data that support the findings of this study are available from the corresponding author upon reasonable request.
REFERENCES
- CDC . (2017). One health zoonotic disease prioritization for multi‐sectoral engagement in Uganda: Workshop summary. Accessible at: https://www.cdc.gov/onehealth/pdfs/uganda‐one‐health‐zoonotic‐disease‐prioritization‐report‐508.pdf [Google Scholar]
- CDC . (2020). One Health information webpage. Accessible at: https://www.cdc.gov/onehealth/index.html [Google Scholar]
- Cossaboom, C. M. , Khaiseb, S. , Haufiku, B. , Katjiuanjo, P. , Kannyinga, A. , Mbai, K. , Shuro, T. , Hausiku, J. , Likando, A. , Shikesho, R. , Nyarko, K. , Miller, L. A. , Agolory, S. , Vieira, A. R. , Salzer, J. S. , Bower, W. A. , Campbell, L. , Kolton, C. B. , Marston, C. , … Walke, H. (2019). Anthrax epizootic in wildlife, Bwabwata National Park, Namibia, 2017. Emerging Infectious Diseases, 25(5), 947–950. 10.3201/eid2505.180867 [DOI] [PMC free article] [PubMed] [Google Scholar]
- Kakaī, C. G. , Okunromade, O. F. , Dan‐Nwafor, C. C. Chabi, A. I. B. , Martial, G. T. P. , Dalhat, M. M. , Ward, S. , Tante, O. , Nguku, P. M. , Hamadi, A. , Ilori, E. , Lokossou, V. , Brito, C. , Ojo, O. E. , Kone, I. , Agbeko, T. T. , Ihekweazu, C. , & Merrill, R. D. (2020). Improving cross‐border preparedness and response: Lessons learned from 3 lassa fever outbreaks across Benin, Nigeria, and Togo, 2017–2019. Health Security, 18(S1), S105–S112. 10.1089/hs.2019.0080 [DOI] [PMC free article] [PubMed] [Google Scholar]
- Kisaakye, E. , Ario, A. R. , Bainomugisha, K. , Cossaboom, C. M. , Lowe, D. , Bulage, L. , Kadobera, D. , Sekamatte, M. , Lubwama, B. , Tumusiime, D. , Tusiime, P. , Downing, R. , Buule, J. , Lutwama, J. , Salzer, J. S. , Matkovic, E. , Ritter, J. , Gary, J. , & Zhu, B. P. (2020). Outbreak of anthrax associated with handling and eating meat from a cow, Uganda, 2018. Emerging Infectious Diseases, 26(12), 2799–2806. 10.3201/eid2612.191373 [DOI] [PMC free article] [PubMed] [Google Scholar]
- Merrill, R. D. , Chabi, A. I. B. , McIntyre, E. , Kouassi, J. V. , Alleby, M. M. , Codja, C. , Tante, O. , Martial, G. T. P. , Kone, I. , Ward, S. , Agbeko, T. T. , & Kakaı, C. G. (2021).An approach to integrate population mobility patterns and sociocultural factors in communicable disease preparedness and response. Humanities and Social Sciences Communications, 8, 23. 10.1057/s41599-020-00704-7 [DOI] [PMC free article] [PubMed] [Google Scholar]
- Merrill, R. , Rogers, K. , Ward, S. , Ojo, O. , Kakaī, C. G. , Agbeko, T. T. , Garba, H. , MacGurn, A. , Oppert, M. , Kone, I. , Bamsa, O. , Schneider, D. , & Brown, C. (2017). Responding to communicable diseases in internationally mobile populations at points of entry and along porous borders, Nigeria, Benin, and Togo. Emerging Infectious Diseases, 23(Suppl 1), S114–S120. 10.3201/eid2313.170520 [DOI] [PMC free article] [PubMed] [Google Scholar]
- Munyua, P. M. , Murithi, R. M. , Ithondeka, P. , Hightower, A. , Thumbi, S. M. , Anyangu, S. A. , Kiplimo, J. , Bett, B. , Vrieling, A. , Breiman, R. F. , & Njenga, M. K. (2016). Predictive factors and risk mapping for rift valley fever epidemics in Kenya. PLoS One, 11(1), e0144570. 10.1371/journal.pone.0144570 [DOI] [PMC free article] [PubMed] [Google Scholar]
- Nakiire, L. , Mwanja, H. , Pillai, S. K. , Gasanani, J. , Ntungire, D. , Nsabiyumva, S. , Mafigiri, R. , Muneza, N. , Ward, S. E. , Daffe, Z. , Ahabwe, P. B. , Kyazze, S. , Ojwang, J. , Homsy, J. , Mclntyre, E. , Lamorde, M. , Walwema, R. , Makumbi, I. , Muruta, A. , & Merrill, R. D. (2020). Population movement patterns among the Democratic Republic of the Congo, Rwanda, and Uganda during an outbreak of Ebola virus disease: Results from community engagement in two districts – Uganda, March 2019. MMWR. Morbidity and Mortality Weekly Report, 69, 10–13. 10.15585/mmwe.mm6901a3 [DOI] [PMC free article] [PubMed] [Google Scholar]
- Nanziri, C. , Ario, A. R. , Ntono, V. , Monje, F. , Aliddeki, D. M. , Bainomugisha, K. , Kadobera, D. , Bulage, L. , Nsereko, G. , Kayiwa, J. , Nakiire, L. , Walwema, R. , Tusiime, P. K. , Mabumba, E. , Makumbi, I. , Ocom, F. , Lamorde, M. , Kasule, J. N. , Ward, S. E. , & Merrill, R. D. (2020). Ebola virus disease preparedness assessment and risk mapping in Uganda, August‐September 2018. Health Security, 18(2), 105–113. 10.1089/hs.2019.0118 [DOI] [PMC free article] [PubMed] [Google Scholar]
- Nyakarahura, L. , Balinandi, S. , Mulei, S. , Jackson Kyondo, A. , Tumusiime, J. D. , Klena, J. J. , & Lutwama, T. S. (2019). Ten outbreaks of rift valley fever in Uganda 2016–2018: Epidemiological and laboratory findings. IJID, 79, 4. 10.1016/j.ijid.2018.11.029 30342249 [DOI] [Google Scholar]
- Oyas, H. , Holmstrom, L. , Kemunto, N. P. , Muturi, M. , Mwatondo, A. , Osoro, E. , Bitek, A. , Bett, B. , Githinji, J. W. , Thumbi, S. M. , Widdowson, M. A. , Munyua, P. M. , & Kariuki Njenga, M. (2018). Enhanced surveillance for Rift Valley Fever in livestock during El Niño rains and threat of RVF outbreak, Kenya, 2015–2016. PLoS Neglected Tropical Diseases, 12, e0006353. 10.1371/journal.pntd.0006353 [DOI] [PMC free article] [PubMed] [Google Scholar]
- Sekamatte, M. , Krishnasamy, W. , Bulage, L. , Kihembo, C. , Nantima, N. , Monje, F. , Ndumu, D. , Sentumbwe, J. , Mbolanyi, B. , Aruho, R. , Kaboyo, W. , Mutonga, D. , Basler, C. , Paige, S. , & Behravesh, C. B. (2018. ). Multisectoral prioritization of zoonotic diseases in Uganda, 2017: A One Health perspective. PLoS One, 13(5), e0196799. Published 2018 May 1. 10.1371/journal.pone.0196799 [DOI] [PMC free article] [PubMed] [Google Scholar]
- Uganda Bureau of Statistics . (2016). The National Population and Housing Census 2014 – Main Report: Uganda Bureau of Statistics. [Google Scholar]
- Valerio, V. C. , Walther, O. J. , Eilittä, M. , Cissé, B. , Muneepeerakul, R. , & Kiker, G. A. (2020). Network analysis of regional livestock trade in West Africa. PLoS One, 15(5), e0232681. 10.1371/journal.pone.0232681 [DOI] [PMC free article] [PubMed] [Google Scholar]
- WHO . (2017). Joint external evaluation of IHR core capacities of the Republic of Uganda: World Health Organization. License: CC BY‐NC‐SA 3.0 IGO. [Google Scholar]
Associated Data
This section collects any data citations, data availability statements, or supplementary materials included in this article.
Supplementary Materials
Table S1
Data Availability Statement
The data that support the findings of this study are available from the corresponding author upon reasonable request.