

Abstract
Background and Aims
Few meta‐analyses have been conducted to pool the most constant risk factors for problem gambling. The present meta‐analysis summarizes effect sizes of the most frequently assessed problem gambling risk factors, ranks them according to effect size strength and identifies any differences in effects across genders.
Method
A random‐effects meta‐analysis was conducted on jurisdiction‐wide gambling prevalence surveys on the general adult population published until March 2019. One hundred and four studies were eligible for meta‐analysis. The number of participants varied depending on the risk factor analyzed, and ranged from 5327 to 273 946 (52% female). Weighted mean odds ratios were calculated for 57 risk factors (socio‐demographic, psychosocial, gambling activity and substance use correlates), allowing them to be ranked from largest to smallest with regard to their association with problem gambling.
Results
The highest odds ratio (OR) was for internet gambling [OR = 7.59, 95% confidence interval (CI) = 5.24, 10.99, P < 0.000] and the lowest was for employment status (OR = 1.03, 95% CI = 0.87, 1.22, P = 0.718). The largest effect sizes were generally in the gambling activity category and the smallest were in the socio‐demographic category. No differences were found across genders for age‐associated risk.
Conclusions
A meta‐analysis of 104 studies of gambling prevalence indicated that the most frequently assessed problem gambling risk factors with the highest effect sizes are associated with continuous‐play format gambling products.
Keywords: Epidemiology, gambling, gambling disorder, general population, meta‐analysis, odds ratio, problem gambling, relative risk, risk factor
Introduction
The significant social costs associated with pathological gambling highlight the need for effective intervention programs. This study aims at establishing a rank order in the evidence‐based problem gambling (PG) individual‐level risk factors identified in the general population. PG is defined as an accumulation of negative consequences, spanning all aspects of life, related to one's gambling behavior in a given period. According to a systematic review of 202 international jurisdiction‐wide surveys, the prevalence of PG among adults ranges from 0.4–8.1% [1]. Numerous factors are associated with the risk of experiencing gambling problems, including environmental factors, such as access to gambling opportunities, and product characteristics, such as speed of reinforcement and individual risk factors. Although a wide range of individual‐level risk factors have been identified over the years, their relationship with PG has not always been consistent across studies. These factors can be of various types, such as socio‐demographic, psychosocial or substance‐ and gambling‐related. Young age and male gender are the most frequently observed risk factors [1]. Nonetheless, there is some indication that other demographic subgroups, such as middle‐aged women [2], are also vulnerable. They may, however, go unnoticed when participants are not split according to age and gender, because of the stronger effect size of being a young male.
Systematic reviews identifying the risk factors for PG have relied largely upon descriptive statistics and the pooling of results from varied methodologies including population and clinical samples of gamblers [3, 4]. Meta‐analyses are helpful for pooling results among independent studies to provide a single estimate that reflects not only its statistical significance but also the magnitude of the effect. Risk factors with large effects can then serve to guide prevention programs or target individuals needing treatment. However, only a handful of meta‐analyses were conducted on PG risk factors, with one limiting itself to longitudinal studies [5], two to a specific mental disorder or trait [6, 7] and others to treatment‐seeking populations [8, 9].
Population studies provide the opportunity to compare people with and without PG, and help to identify a constellation of risk factors that are associated with PG. This, in turn, may help circumscribe at‐risk subgroups and provide them with targeted prevention, or help clinicians to increase their understanding of PG etiology. Considering the variety and large number of potential PG risk factors, it is important to target efforts towards those that are most relevant and strongly associated with gambling problems. It should be noted that risk factors are best identified using longitudinal studies, where chronological antecedence can be tested relative to PG [10]. However, most population studies on PG are cross‐sectional in nature [1], which limits inferences on the directionality of the effects between PG and its correlates. The current study's objectives were fourfold:
Estimate weighted mean effect sizes for PG risk factors identified in the general population;
Rank these risk factors according to their relative strength;
Test the hypothesis that effect sizes differed across gender; and
Assess study quality and bias.
Methods
This study is reported according to the Preferred Reporting Items for Systematic Reviews and Meta‐Analyses (PRISMA) [11] and Meta‐analysis of Observational Studies in Epidemiology (MOOSE) guidelines [12]. The study was exempted from ethical approval because the data were aggregated, already collected and publicly available. The PROSPERO registration number is CRD42020149012. The PRISMA checklist is available in the Supporting information.
Study eligibility
Studies were initially screened based on title and abstract. Eligibility inclusion criteria were: reported one or more variables as a correlate of PG; quantitative study or technical report; published in English, French or Spanish; included any measure of PG, pathological gambling or gambling disorder as outcome variables; used a valid and reliable PG instrument; gambling was assessed during adulthood (age ≥ 18 years); the study was reported in a complete paper published between January 2012 and March 2019; and the study targeted the general population (e.g. studies of prisoners excluded) and did not target a small demographic subset of the population (e.g. only young adults). Studies were excluded if they provided insufficient detail on the assessment of PG or were an evaluation of a gambling intervention or prevention program. To be eligible for meta‐analysis, one of the following sets of statistics had to be reported: group sizes for all PG and variable level combinations (e.g. non‐PG and PG counts for all age groups); odds ratio, confidence interval and level; or χ2 value and total N. Non‐academic publications were included provided they satisfied the inclusion criteria.
Search strategy
All 202 studies identified in William et al.'s [1] review were included in the screening phase. The title and abstract of studies published since then (i.e. between January 2012 and March 2019) were identified using MEDLINE (PubMed) and PsycINFO. The full query is provided in the Supporting information. Furthermore, the Alberta Gambling Research Institute maintains a database of jurisdiction‐wide prevalence studies, and Gambling Research Exchange Ontario maintains a broader database of gambling research. Both these databases were manually browsed. Experts in the field were also consulted. Most studies were available on‐line or through the internet archive (www.archive.org). Authors of studies that could not be located or with incomplete data were contacted, if possible.
Data extraction
The following data were extracted: jurisdiction, year study was conducted, sample size and PG correlates (see Table 1 for a full list). These data were also previously extracted and made available in Williams et al. [1] for the 202 studies included in their review, which indirectly served as a double‐coding procedure.
Table 1.
Meta‐analysis estimates: odds ratios sorted from high to low, confidence intervals, number of studies, relative risk and effect size.
| Correlate | Category | OR | 95% CI | P | k | MCGR | RR | I 2 | Effect size |
|---|---|---|---|---|---|---|---|---|---|
| Internet gambling | GA | 7.59 | (5.24, 10.99) | 0.000 | 19 | 0.03 | 6.34 | 85% | Strong |
| EGM and slot machines (excluding casino) | GA | 7.20 | (5.82, 8.90) | 0.000 | 52 | 0.02 | 6.40 | 92% | Strong |
| EGM and slot machines (including casino) | GA | 6.78 | (5.57, 8.26) | 0.000 | 54 | 0.02 | 6.08 | 92% | Strong |
| Poker | GA | 5.39 | (4.27, 6.82) | 0.000 | 12 | 0.03 | 4.77 | 73% | Strong |
| Attempted suicide | PS | 4.92 | (2.15, 11.27) | 0.000 | 6 | 0.04 | 4.25 | 92% | Medium |
| Casino table games | GA | 4.91 | (4.34, 5.55) | 0.000 | 22 | 0.03 | 4.39 | 53% | Medium |
| Cardrooms | GA | 4.70 | (2.44, 9.04) | 0.000 | 5 | 0.05 | 3.96 | 89% | Medium |
| Daily lottery | GA | 4.69 | (3.45, 6.36) | 0.000 | 8 | 0.04 | 4.08 | 46% | Medium |
| Problems due to alcohol/drugs | SU | 4.66 | (3.26, 6.65) | 0.000 | 17 | 0.03 | 4.20 | 82% | Medium |
| Keno | GA | 4.62 | (3.42, 6.24) | 0.000 | 10 | 0.04 | 4.04 | 87% | Medium |
| Problems due to alcohol | SU | 4.53 | (2.96, 6.96) | 0.000 | 11 | 0.03 | 4.10 | 78% | Medium |
| Casino gambling (EGM, slots, table games) | GA | 4.51 | (3.95, 5.15) | 0.000 | 50 | 0.03 | 4.08 | 78% | Medium |
| Suicidal thoughts | PS | 4.32 | (2.88, 6.50) | 0.000 | 8 | 0.03 | 3.93 | 88% | Medium |
| Card games | GA | 4.30 | (3.13, 5.91) | 0.000 | 19 | 0.04 | 3.80 | 81% | Medium |
| Pulltabs | GA | 4.21 | (3.23, 5.50) | 0.000 | 12 | 0.04 | 3.73 | 64% | Medium |
| Pari‐mutual (sports/races) | GA | 4.06 | (1.56, 10.56) | 0.004 | 4 | 0.05 | 3.52 | 85% | Medium |
| Cocaine use | SU | 3.96 | (1.59, 9.86) | 0.003 | 7 | 0.05 | 3.45 | 80% | Medium |
| Sports (all) | GA | 3.90 | (3.36, 4.51) | 0.000 | 54 | 0.04 | 3.49 | 79% | Medium |
| Anxiety issues | PS | 3.76 | (2.90, 4.86) | 0.000 | 7 | 0.04 | 3.38 | 58% | Medium |
| Family member ever had a gambling problem | PS | 3.69 | (2.98, 4.58) | 0.000 | 32 | 0.04 | 3.33 | 74% | Medium |
| Games of skill | GA | 3.68 | (3.04, 4.45) | 0.000 | 24 | 0.04 | 3.32 | 58% | Medium |
| EGM and slot machines (casino only) | GA | 3.61 | (2.91, 4.48) | 0.000 | 4 | 0.03 | 3.35 | 27% | Medium |
| Ever been incarcerated | PS | 3.47 | (2.58, 4.68) | 0.000 | 5 | 0.04 | 3.16 | 49% | Medium |
| Horse, harness or greyhound races | GA | 3.44 | (2.86, 4.13) | 0.000 | 41 | 0.03 | 3.20 | 87% | Medium |
| Internalizing symptoms | PS | 3.40 | (2.86, 4.05) | 0.000 | 19 | 0.03 | 3.17 | 63% | Medium |
| Depression issues | PS | 3.29 | (2.73, 3.97) | 0.000 | 17 | 0.03 | 3.08 | 66% | Medium |
| Illicit drug use | SU | 3.21 | (2.63, 3.93) | 0.000 | 14 | 0.04 | 2.95 | 61% | Medium |
| Daily tobacco use | SU | 3.17 | (2.79, 3.60) | 0.000 | 27 | 0.02 | 3.04 | 67% | Medium |
| Ever been arrested or detained | PS | 3.17 | (2.65, 3.80) | 0.000 | 5 | 0.04 | 2.92 | 0% | Medium |
| Any mental health problem | PS | 3.17 | (2.67, 3.77) | 0.000 | 29 | 0.03 | 2.98 | 72% | Medium |
| Sports select | GA | 3.13 | (2.23, 4.37) | 0.000 | 3 | 0.06 | 2.77 | 0% | Medium |
| Binge drinking | SU | 3.05 | (2.52, 3.70) | 0.000 | 10 | 0.04 | 2.82 | 69% | Medium |
| Marijuana use | SU | 3.05 | (2.49, 3.74) | 0.000 | 16 | 0.04 | 2.82 | 66% | Medium |
| Private betting: card/board games with friends/family | GA | 2.99 | (2.60, 3.44) | 0.000 | 36 | 0.04 | 2.77 | 0% | Medium |
| Bingo | GA | 2.99 | (2.54, 3.52) | 0.000 | 45 | 0.03 | 2.82 | 75% | Medium |
| Sports pools | GA | 2.84 | (1.87, 4.33) | 0.000 | 12 | 0.03 | 2.69 | 77% | Small |
| Instant win/scratch | GA | 2.68 | (2.30, 3.11) | 0.000 | 43 | 0.03 | 2.55 | 79% | Small |
| Sports events | GA | 2.54 | (1.32, 4.87) | 0.005 | 4 | 0.06 | 2.32 | 91% | Small |
| Poor physical health | PS | 2.50 | (2.16, 2.88) | 0.000 | 19 | 0.04 | 2.35 | 23% | Small |
| Out‐of‐province casino | GA | 2.31 | (1.86, 2.87) | 0.000 | 7 | 0.04 | 2.20 | 12% | Small |
| Ethnicity | SD | 2.16 | (1.82, 2.57) | 0.000 | 51 | 0.04 | 2.07 | 85% | Small |
| Age | SD | 1.98 | (1.77, 2.21) | 0.000 | 87 | 0.04 | 1.91 | 79% | Small |
| Ever filed bankruptcy | PS | 2.04 | (1.23, 3.37) | 0.006 | 7 | 0.04 | 1.96 | 35% | Small |
| Gender | SD | 2.08 | (1.90, 2.29) | 0.000 | 92 | 0.03 | 2.02 | 78% | Small |
| All lottery games (weekly lottery, pulltabs, instant lottery) | GA | 1.96 | (1.67, 2.29) | 0.000 | 67 | 0.04 | 1.89 | 87% | Small |
| Marital status | SD | 1.83 | (1.68, 1.98) | 0.000 | 74 | 0.03 | 1.78 | 36% | Small |
| Education | SD | 1.59 | (1.47, 1.73) | 0.000 | 78 | 0.03 | 1.56 | 60% | Small |
| Stocks, options, commodities | GA | 1.47 | (1.09, 1.98) | 0.012 | 17 | 0.04 | 1.44 | 74% | Nil |
| Income | SD | 1.42 | (1.29, 1.57) | 0.000 | 78 | 0.04 | 1.40 | 65% | Nil |
| Weekly lottery (6/49 style) | GA | 1.36 | (1.14, 1.62) | 0.001 | 53 | 0.03 | 1.34 | 74% | Nil |
| Military status | SD | 1.30 | (0.65, 2.60) | 0.458 | 3 | 0.03 | 1.29 | 79% | Nil |
| Living in urban area (versus. rural) | SD | 1.18 | (0.90, 1.55) | 0.236 | 9 | 0.03 | 1.17 | 55% | Nil |
| Raffles or charity | GA | 1.09 | (0.90, 1.31) | 0.387 | 30 | 0.04 | 1.08 | 82% | Nil |
| Alcohol use | SU | 1.06 | (0.84, 1.33) | 0.630 | 23 | 0.05 | 1.05 | 85% | Nil |
| Employment status | SD | 0.97 | (0.82, 1.15) | 0.718 | 59 | 0.04 | 0.97 | 90% | Nil |
| Having children/dependents at home (versus no dependents) | SD | 0.87 | (0.69, 1.10) | 0.235 | 11 | 0.05 | 0.87 | 65% | Nil |
| Religion | SD | 0.69 | (0.35, 1.37) | 0.288 | 8 | 0.05 | 0.70 | 89% | Nil |
EGM = electronic gaming machine; GA = gambling activity; MCGR = median comparator group risk; OR = odds ratio; CI = confidence interval; PS = psychosocial; RR = relative risk; SD = socio‐demographic; SU = substance use.
When statistics that could be used for a meta‐analysis were reported, a separate data extraction procedure was conducted. A third of the studies were double‐coded by a research assistant using the data extraction guidelines available in the Supporting information, yielding an 84% agreement rate. The following polychotomous variables were dichotomized: age (under 30 years versus other), education (high school diploma or less versus other), employment status (employed or student versus other), ethnicity (all minority groups versus other), income (bottom‐third versus other), marital status (single, never married, separated, divorced, widowed versus other) and religion (any religion versus other).
As recommended by the MOOSE group and elsewhere [12, 13], the following key study design covariates (i.e. methodological features) were also extracted to assess the risk of bias at the correlate level in sensitivity analyses: PG assessment instrument, length of prevalence period; cut‐off score for defining PG; correlate prevalence period (e.g. past‐month or past‐year depression); and base group composition (e.g. whole population or past‐year gamblers).
Risk of bias assessment
A 10‐item instrument designed specifically for observational studies was used [13, 14]. Publication bias was examined with funnel plots when at least 10 studies were included in an analysis [15]. Study heterogeneity was examined with the I 2 statistic [16] and in meta‐regression analyses using study design covariates described in the previous section.
Data analysis
Pooled estimates were reported as odds ratios (ORs) because of their arithmetic versatility and risk ratios (RRs) because of their intuitiveness [17]. To ensure comparability across studies, estimates did not control for confounders, which were inconsistent across studies. As is the case with other effect size measures [18], guidelines exist for interpreting OR strength according to small, medium and large cut‐offs [19]. This interpretation also depends upon the median comparator group risk (MCGR) for the correlate of interest. For instance, when the PG prevalence is 2% in the reference group, ORs exceeding 1.61, 3.13 and 5.75 correspond to small, medium and large effect sizes, respectively.
Meta‐analyses and meta‐regressions were conducted using Comprehensive Meta‐Analysis version 3 [20]. Due to differences among studies on important characteristics, such as those included as study design covariates in the meta‐regression analyses, study heterogeneity (I 2) was expected to be high. Therefore, analyses were conducted using a random‐effects model.
Case–control groups were defined as having a PG score of at least three, which corresponds to the moderate‐risk gambling threshold on the Problem Gambling Severity Index (PGSI) [21], and the PG thresholds generally used in epidemiological studies using the National Opinion Research Center DSM Screen for Gambling Problems (NODS) [22] or the South Oaks Gambling Screen (SOGS) [23]. More stringent criteria targeting only clinical levels of PG would have reduced the number of studies, thus hindering the ability to conduct adequate meta‐regression analyses, which require a minimum of 10 studies per correlate [24] and four studies per covariate level [25]. Subgroup analyses were also conducted based on gender when possible.
Results
Study selection
Figure 1 shows the PRISMA flow diagram for our study selection process. Searching on‐line databases yielded 186 and 209 results on PubMed and PsycInfo, respectively. Additionally, 202 studies were obtained from the Williams et al. review [1], as well as 36 and 14 studies from the Alberta Gambling Research Institute and Gambling Research Exchange Ontario, respectively. Finally, three additional studies were identified on government websites while obtaining older reports on these same websites. A total of 618 studies remained after removing duplicates (i.e. either identical reports or different reports based on the same prevalence survey). Reasons for exclusion at the screening (n = 363) and eligibility (n = 139) phases are reported in the Supporting information. Finally, 104 were eligible for the general meta‐analysis, and nine were eligible for the age by gender subgroup meta‐analysis.
Figure 1.
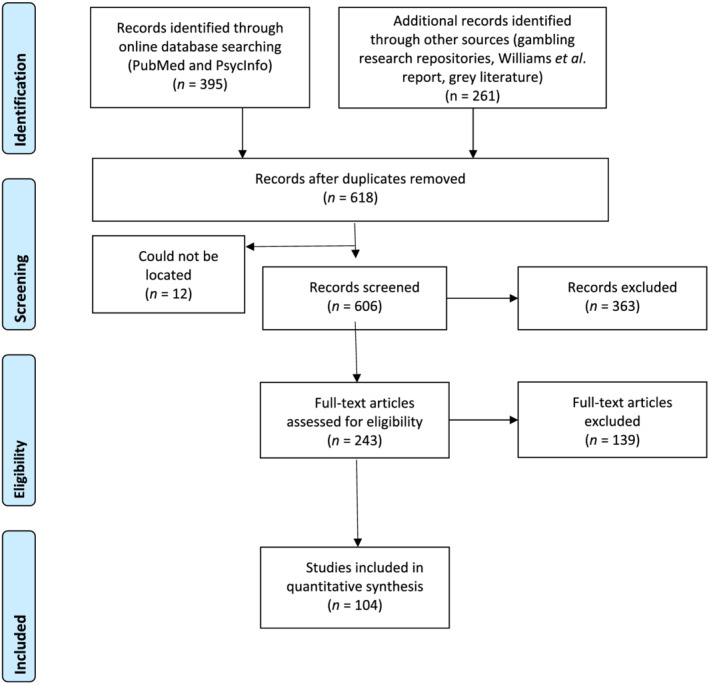
Preferred Reporting Items for Systematic Reviews and Meta‐Analyses (PRISMA) flow diagram
Gambling data were obtained from a variety of assessment measures, including the SOGS (k = 43), PGSI (k = 38), DSM‐based measures (k = 17) and the Problem and Pathological Gambling Measure (PPGM; k = 3) [26, 27]. Studies were either conducted in specific states and territories of the United States (k = 33), Canadian provinces (k = 32), whole countries (k = 25) or Australian states (k = 11). A total of 58 unique jurisdictions were included. Eighty‐three per cent of studies were commissioned reports, and the remaining 17% were papers published in academic journals. Sample sizes ranged from to 750 to 25 034. Full citations and study characteristics are provided in the Supporting information.
Risk of bias
Bias at the study level
When assessed on 10 criteria relevant to observational studies [14], risk of bias was found to be low for 95 studies and moderate for nine studies, out of a total of 104 (see Supporting information). These particularly good scores can be explained by the stringent inclusion and exclusion criteria used for study eligibility. Non‐response bias was the most frequently observed risk (79% of studies), followed by the appropriateness of shortest prevalence period (i.e. PG was assessed over participants’ life‐times in 22% of studies). Although non‐response bias was often observed, data weighting procedures were used in most studies to minimize this bias's effect and provide results representative of the target population.
Bias at the correlate level
Visual inspections of funnel plots revealed obvious signs of publication bias for only two variables (gambling in card games or raffles), suggesting that their estimated effect size might be overestimated. According to the I 2 statistic, heterogeneity was high for half (28 of 57), moderate for a third (19 of 57) and low for the rest (10 of 57) of the correlates. Funnel plots are available in the Supporting information.
Meta‐analysis estimates
The computed weighted mean effect sizes (i.e. ORs) ranged from 1.03 to 7.59. Table 1 shows ORs, confidence intervals (CIs) number of studies per correlate, MCGR, RRs and effect size strength. For gender and gambling on bingo or card games, one study showed an extreme OR value. However, its weight was small, and results remained the same when it was omitted. Considering the large number of correlates examined, and due to space limitations, forest plots summarizing individual studies’ effects for all correlates are reported in the Supporting information.
Gender subgroup analyses
Gender subgroup analyses could only be conducted on age due to the limited data in the available studies. Considering that male gender and young age are both risk factors for PG, we hypothesized that the effects from young men overshadow any increased risk that middle‐aged women might also have. Nine studies were retained because they reported PG prevalence rates for each gender across similar age groups (i.e. less than 35, 35–55 and 55+). Age groups were derived based on the cut‐offs used most frequently in the subset of studies.
The results of the meta‐analysis revealed that men remained at a higher risk compared to women in all age groups: under 35 (OR = 4.19, 95% CI = 2.77, 6.35, P < 0.000); aged 35–55 (OR = 3.81, 95% CI = 2.94, 4.93, P < 0.000); and aged over 55 (OR = 2.88, 95% CI = 1.69, 4.93, P < 0.000). Gamblers aged under 35 were at a higher risk compared to older gamblers for both genders (see Table 2). Our hypothesis was therefore not supported by the data.
Table 2.
Odds ratios for older age compared to gamblers aged under 35 years for both genders.
| 35–55 | Over 55 | |
|---|---|---|
| Male | 0.57 (95% CI = 0.49, 0.66, P < 0.000) | 0.24 (95% CI = 0.19, 0.30, P < 0.000) |
| Female | 0.59 (95% CI = 0.43, 0.80, P = 0.001) | 0.37 (95% CI = 0.26, 0.54, P < 0.000) |
CI = confidence interval.
Sensitivity analyses
Sensitivity analyses conducted using meta‐regression first assessed each study design covariate's effect on correlate ORs, independently from other study design covariates. Seventeen correlates were not analyzed because data were available for fewer than 10 studies. When multiple study design covariates were statistically significant for a given correlate, covariates were assessed concurrently to control for their overlapping effects. This could happen when, for example, all studies conducted in a particular country used the same PG assessment instrument. Table 3 displays statistically significant study design covariates, along with the direction of OR change for each affected correlate. A list of correlates excluded from the sensitivity analyses and P‐values for all meta‐regression analyses are available in the Supporting information.
Table 3.
Sensitivity analyses from meta‐regression results showing study design covariates moderating PG correlates.
| PG correlate | Study design covariate | Comparison group | Direction of OR change |
|---|---|---|---|
| Alcohol use | Correlate time‐framea | Past week | Increase |
| Casino gambling | PG assessment instrumentb | DSM‐IV | Decrease |
| Correlate time‐framea | Past week | Increase | |
| Gender | Jurisdictionc | Canada | Decrease |
| Income | PG assessment instrumentb | SOGS | Decrease |
| Lottery games (all) | PG assessment instrumentb | SOGS | Increase |
| Marital status | PG time‐framed | Lifetime | Increase |
| Private betting | Jurisdictionb | Canada | Decrease |
| Correlate time‐framea | Past week | Increase | |
| Race betting | Base groupe | General population | Increase |
DSM‐IV = Diagnostic and Statistical Manual of Mental Disorders, version IV; PG = problem gambling; PGSI = Problem Gambling Severity Index; SOGS = South Oaks Gambling Screen; OR = odds ratio.
Reference group: life‐time;
Reference: PGSI;
Reference: other than Canada;
Reference: past year;
Reference: gamblers.
Discussion
As a public health issue, PG is becoming the focus of an increasing number of risk factor analyses. Few meta‐analyses have been conducted to gather and summarize the evidence available to date. The current study aimed to (a) conduct the first comprehensive meta‐analysis of both academic and non‐academic population prevalence studies to quantify the effect size of suspected individual‐level risk factors associated with PG, (b) rank these risk factors according to effect size strength, (c) examine whether effect sizes differed depending on gender and (d) determine if the quality of studies would affect robustness of results.
In line with the first two study objectives, 104 prevalence studies reporting on 57 correlates were identified. Results for correlates in the socio‐demographic, psychosocial and substance use categories are consistent with previous meta‐analyses, which have also reported small‐ to medium‐sized effects [5, 6, 7]. The largest effect sizes were associated with types of gambling activities, specifically the continuous play formats (e.g. EGM or internet gambling). Curiously, none of the prior meta‐analyses included this category of risk factors. Type of gambling warrants inclusion in any future meta‐analytical research intended to inform responsible gambling initiatives. The third study objective, gender subgroup analyses, could only be conducted on age due to data limitations.
Finally, although studies varied in terms of populations and methodological characteristics, the low risk of bias observed at the correlate and study level suggests that our results are unlikely to be affected by most of these variations. The particularly low risk of publication bias is understandable considering that the vast majority of studies were commissioned reports, which are less prone to publication bias. High study heterogeneity, as assessed with the I 2 statistic, confirmed the choice of a random‐effects model. This study heterogeneity may have been due to differences in instruments used for assessing PG correlates.
Socio‐demographic factors
All socio‐demographic effect sizes were small. Interestingly, this was also the case for male gender and young age, even though these risk factors are the most frequently linked to PG [1]. These may actually be proxies [28] for another, stronger, causal factor. One possible candidate is impulsivity, which has shown medium‐sized associations with PG [7, 29].
Moreover, many of the identified socio‐demographic characteristics tend to co‐occur. For example, men under age 30 years tend to be single, and individuals without a high school degree tend to earn lower incomes. As is the case with overlapping risk factors [28], a subgroup determined by a combination of these characteristics (e.g. single young men) should separately display a higher risk for PG. However, due to the limited data in the available studies, subgroup analyses were only possible for age and gender effects. Although a previous study [2] has suggested that middle‐aged women may be particularly at risk for PG, results from our meta‐analysis did not support this claim. Rather, our results suggest that men and younger gamblers remain the most vulnerable groups in terms of these two socio‐demographic characteristics. Nevertheless, two studies included in our analysis showed trends towards higher levels of PG in middle‐aged women compared to their younger counterparts. Our results may partly be due to age interval constraints imposed by the available data (i.e. aged under 35, 35–55 and over 55). Also, no direct comparisons were made between middle‐ and older‐aged men or women, so no inferences could be made about whether these two age groups differ in risk.
Psychosocial factors
Individuals with mental health issues display a higher risk for PG compared to physical health problems. Mental distress or mental disorders represent highly modifiable conditions. The presence of a significant mental health problem (e.g. expressing suicidal thoughts) could be an important flag for health professionals to probe for PG as a comorbidity. Similarly, considering the medium‐size effect of having a family member with PG, treatment providers should explore the role of family environment in the developing and maintenance of PG in the identified patient and, inversely, provide services to patients' relatives.
Although statistically significant, filing for bankruptcy displayed a small effect size, which is surprising considering the financial implications inherent in PG. Bankruptcy may result from gambling, of course, but it can also be a motivator for increased gambling to solve financial problems. In addition, bankruptcy and gambling problems can both be related to risk‐taking personality characteristics. Regardless of the causal links, these results are consistent with other studies that thoroughly examined bankruptcy, and found rates to be two to four times higher among people with gambling problems [30].
Substance use
The moderate effect sizes observed for most substance use correlates underscore the important associations between PG and substance use, especially when it comes to alcohol or drug problems and PG. Similarities between PG and substance use disorders have been identified at biological and phenomenological levels [31], which might explain their probable co‐occurrence.
Our finding that alcohol use was not associated with PG can be partly explained by other findings suggesting that recreational gamblers (i.e. without significant problems) are more likely to have consumed alcohol in the past year compared to non‐gamblers [32], hence explaining its widespread occurrence in our studied samples. Another possible explanation could be that most life‐time or long‐term measures of alcohol consumption lack precision, with some authors recommending specific assessment tools depending on the time‐span covered [33].
Gambling activity
Moderate to large effect sizes were identified for a variety of gambling activities (e.g. EGM, casino gambling, poker and daily lotteries). Although all forms of gambling are more common in people with PG compared to controls, the continuous forms of gambling (characterized by high rate of play and short time between wagering and the outcome), notably EGMs and internet gambling, are associated with the largest effect sizes. The elevated potential for addiction associated with continuous forms of gambling has been flagged by many researchers [34, 35, 36, 37]. The present results provide additional evidence to highlight the risks associated with these forms of gambling. The only non‐significant correlate, i.e. gambling in raffles, was also the only one to be being generally community‐orientated rather than aimed toward one's personal gain.
Limitations
Limitations at study and correlate level
The concept of risk factors sometimes implies a causal influence of the correlate. Because our data are cross‐sectional (versus longitudinal), causality cannot be determined or assumed. For example, there is no way to determine if mental distress is a precursor or consequence of disordered gambling. More longitudinal research examining a wide array of risk factors is needed to feed future meta‐analyses and clarify the directionality of these effects. Nonetheless, identification of reliable correlates provides useful information for designing a public health response to gambling. Although cross‐sectional, we identified a large group of population studies from diverse jurisdictions. Even though our sensitivity analyses revealed that only a few correlates were affected by study characteristics (e.g. PG assessment instrument), these differences between studies warrant consideration. Some studies compared people with and without gambling problems, whereas others compared people with gambling problems to the rest of the population (including non‐gamblers). Non‐gamblers and low‐risk gamblers may differ in a variety of respects. Studies also varied in terms of how they reported levels of PG, with some reporting combined results for moderate‐ and high‐risk levels, while others reporting them separately. Using a high‐risk group to define PG may lead to larger effect sizes. Jurisdiction comparisons were only made between two groups: Canada and the rest of the world. Although studies were conducted on every continent, other possibly insightful comparisons (e.g. eastern versus western countries) were not made.
Moreover, some correlates were vaguely or inconsistently defined. For example, anxiety and depression issues were assessed differently across studies (sometimes with a single question), but were nonetheless combined in our study to estimate a single weighted mean effect size. Internet gambling showed the strongest effect size, but it is a modality of gambling that potentially encompasses a number of gambling activities (e.g. online sports betting or online poker) versus a specific type of gambling. These design differences may have contributed to the high study heterogeneity (i.e. I 2) observed with some correlates.
Finally, it should be noted that the use of unadjusted raw data from original studies makes the pooled estimates for PG correlates prone to various confounding variables. However, socio‐demographic variables, the most common confounding variables, displayed small effect sizes and may therefore only introduce minimal confounding bias.
Limitations at the meta‐analysis level
First, considering that our search strategy was limited to studies published since 2012, we relied upon the accuracy of search results reported in the review conducted by Williams et al. [1] for all prior studies. Although those authors are experts in gambling prevalence studies, this may have led to an under‐identification of eligible studies.
Secondly, even though we tried to increase the number of studies by using a liberal PG threshold, some sensitivity analyses could still not be adequately conducted because of a small number of studies per study design covariate level. This, however, is partly due to our data extraction methodology, in which we prioritized certain measures, rather than extracting all available (e.g. extracting only past‐year data when life‐time data were also available). Future meta‐analyses that plan on conducting meta‐regression should consider extracting all available covariate levels. Including other community‐level factors (e.g. availability of gambling) would also allow the examination of interactions between community and individual level factors.
Implications
Despite these limitations, our results have clear implications for a variety of stakeholders, particularly policymakers and health‐care providers. First, the largest effect sizes were generally in the gambling activity category, whereas the smallest effects were in the socio‐demographic category. Targeted prevention strategies and responsible gambling initiatives in general can make use of these results to identify populations most at risk for developing PG. Although there is merit in identifying at‐risk populations by socio‐demographic factors (e.g. younger, male), these characteristics are not modifiable. The focus on evidence‐based risk factors over which gamblers have control—notably, types of games, use of substances—may ultimately increase the efficiency and poignancy of prevention campaigns.
In terms of treatment delivery, people with gambling problems are more likely to be identified among individuals seeking help for mental health issues rather than physical ailments. The medium‐sized associations observed between PG and substance use problems reinforce the notion that both types of addictions share common underpinning vulnerabilities [31], which may have implications for transdiagnostic treatment approaches [38].
Conclusion
We have conducted the largest meta‐analysis on PG risk factors to date, to our knowledge. It showed that the frequency with which a particular risk factor was associated with PG did not necessarily reflect the strength of its effect size (e.g. gender). Risk factors with the largest effect sizes were generally in the gambling activity category, whereas socio‐demographic factors were small. Stakeholders should prioritize correlates with relatively larger effect sizes when building responsible gambling messages or screening people at high‐risk of PG.
Protocol registration
PROSPERO pre‐registration number CRD42020149012.
Declaration of interests
None.
Author contributions
Youssef Allami: Conceptualization; formal analysis; investigation; methodology; software. David Hodgins: Conceptualization; methodology; resources. Matthew Young: Conceptualization; funding acquisition; methodology; project administration. Natacha Brunelle: Conceptualization. Shawn Currie: Conceptualization. Magali Dufour: Conceptualization. Marie‐Claire Flores‐Pajot: Conceptualization; funding acquisition; project administration. Louise Nadeau: Conceptualization.
Supporting information
Data S1. Supporting information.
Acknowledgements
This study was funded by the Canadian Centre on Substance Use and Addiction through financial support from Mise sur Toi. The funder commissioned the study as part of a larger project of deriving Canada's first lower‐risk gambling guidelines. The contents of this paper are the responsibility of the authors and do not necessarily represent the official views of the funder. The authors would like to acknowledge the help of Rhys Stevens, librarian at the Alberta Gambling Research Institute, for his help locating studies, and Alana Guidry, research assistant at the University of Calgary, for her help locating and double‐coding studies for the meta‐analysis.
Allami Y., Hodgins D. C., Young M., Brunelle N., Currie S., Dufour M., Flores‐Pajot M.‐C., and Nadeau L. (2021) A meta‐analysis of problem gambling risk factors in the general adult population. Addiction, 116: 2968–2977. 10.1111/add.15449.
References
- 1. Williams R. J., Volberg R. A., Stevens R. M. The Population Prevalence of Problem Gambling: Methodological Influences, Standardized Rates, Jurisdictional Differences, and Worldwide Trends. Thunder Bay, ON: Ontario Problem Gambling Research Centre; 2012. [Google Scholar]
- 2. Hing N., Russell A., Tolchard B., Nower L. Risk factors for gambling problems: an analysis by gender. J Gambl Stud 2016; 32: 511–534. [DOI] [PMC free article] [PubMed] [Google Scholar]
- 3. Raylu N., Oei T. P. S. Pathological gambling: a comprehensive review. Clin Psychol Rev 2002; 22: 1009–1061. [DOI] [PubMed] [Google Scholar]
- 4. Johansson A., Grant J. E., Kim S. W., Odlaug B. L., Götestam K. G. Risk factors for problematic gambling: a critical literature review. J Gambl Stud 2009; 25: 67–92. [DOI] [PubMed] [Google Scholar]
- 5. Dowling N. A., Merkouris S. S., Greenwood C. J., Oldenhof E., Toumbourou J. W., Youssef G. J. Early risk and protective factors for problem gambling: a systematic review and meta‐analysis of longitudinal studies. Clin Psychol Rev 2017; 51: 109–124. [DOI] [PubMed] [Google Scholar]
- 6. Theule J., Hurl K. E., Cheung K., Ward M., Henrikson B. Exploring the relationships between problem gambling and ADHD: a meta‐analysis. J Atten Disord 2019; 23: 1427–1437. [DOI] [PubMed] [Google Scholar]
- 7. Ioannidis K., Hook R., Wickham K., Grant J. E., Chamberlain S. R. Impulsivity in gambling disorder and problem gambling: a meta‐analysis. Neuropsychopharmacology 2019; 44: 1354–1361. [DOI] [PMC free article] [PubMed] [Google Scholar]
- 8. Dowling N. A., Cowlishaw S., Jackson A. C., Merkouris S. S., Francis K. L., Christensen D. R. Prevalence of psychiatric co‐morbidity in treatment‐seeking problem gamblers: a systematic review and meta‐analysis. Aust NZ J Psychiatry 2015; 49: 519–539. [DOI] [PMC free article] [PubMed] [Google Scholar]
- 9. Dowling N. A., Cowlishaw S., Jackson A. C., Merkouris S. S., Francis K. L., Christensen D. R. The prevalence of comorbid personality disorders in treatment‐seeking problem gamblers: a systematic review and meta‐analysis. J Pers Disord 2014; 29: 735–754. [DOI] [PubMed] [Google Scholar]
- 10. Coie J. D., Watt N. F., West S. G., Hawkins J. D., Asarnow J. R., Markman H. J., et al. The science of prevention: a conceptual framework and some directions for a national research program. Am Psychol 1993; 48: 1013–1022. [DOI] [PubMed] [Google Scholar]
- 11. Moher D., Liberati A., Tetzlaff J., Altman D. G., PRISMA Group Preferred reporting items for systematic reviews and meta‐analyses: the PRISMA statement. Ann Intern Med 2009; 151: 264–269 W64. [DOI] [PubMed] [Google Scholar]
- 12. Stroup D. F., Berlin J. A., Morton S. C., Olkin I., Williamson G. D., Rennie D., et al. Meta‐analysis of observational studies in epidemiology: a proposal for reporting. Meta‐analysis of observational studies in epidemiology (MOOSE) group. JAMA 2000; 283: 2008–2012. [DOI] [PubMed] [Google Scholar]
- 13. Mueller M., D'Addario M., Egger M., Cevallos M., Dekkers O., Mugglin C., et al. Methods to systematically review and meta‐analyse observational studies: a systematic scoping review of recommendations. BMC Med Res Methodol 2018; 18: 44. [DOI] [PMC free article] [PubMed] [Google Scholar]
- 14. Hoy D., Brooks P., Woolf A., Blyth F., March L., Bain C., et al. Assessing risk of bias in prevalence studies: modification of an existing tool and evidence of interrater agreement. J Clin Epidemiol 2012; 65: 934–939. [DOI] [PubMed] [Google Scholar]
- 15. Page M. J., Higgins J. P., Sterne J. P., editors. Chapter 13. Assessing risk of bias due to missing results in a synthesis. In: Cochrane Handbook for Systematic Reviews of Interventions [internet]. 6.0. Cochrane; 2019. Available at: www.training.cochrane.org/handbook (accessed 24 May 2020). [Google Scholar]
- 16. Higgins J. P. T., Thompson S. G., Deeks J. J., Altman D. G. Measuring inconsistency in meta‐analyses. BMJ 2003; 327: 557–560. [DOI] [PMC free article] [PubMed] [Google Scholar]
- 17. Higgins J. P., Li T., Deeks J. J., editors. Chapter 6. Choosing effect measures and computing estimates of effect. In: Cochrane Handbook for Systematic Reviews of Interventions [internet]. 6.0. Cochrane; 2019. Available at: www.training.cochrane.org/handbook (accessed 24 May 2019). [Google Scholar]
- 18. Cohen J. Statistical Power Analysis for the Behavioral Sciences. Hillsdale, NJ: Erlbaum; 1988. [Google Scholar]
- 19. Chen H., Cohen P., Chen S. How big is a big odds ratio? Interpreting the magnitudes of odds ratios in epidemiological studies. Commun Stat Simul Comput 2010; 39: 860–864. [Google Scholar]
- 20. Borenstein M., Hedges L. V., Higgins J. P., Rothstein H. R. Comprehensive Meta‐Analysis. Englewood, NJ: Biostat; 2013. [Google Scholar]
- 21. Ferris J., Wynne H. The Canadian Problem Gambling Index: Final report. Ottawa, ON: Canadian Centre on Substance Abuse; 2001. [Google Scholar]
- 22. Hodgins D. C. Using the NORC DSM screen for gambling problems as an outcome measure for pathological gambling: psychometric evaluation. Addict Behav 2004; 29: 1685–1690. [DOI] [PubMed] [Google Scholar]
- 23. Lesieur H. R., Blume S. B. The south oaks gambling screen (SOGS): a new instrument for the identification of pathological gamblers. Am J Psychiatry 1987; 144: 1184–1188. [DOI] [PubMed] [Google Scholar]
- 24. Deeks J. J., Higgins J. P., Altman J. J., editors. Chapter 10: Analysing data and undertaking meta‐analyses. In: Cochrane Handbook for Systematic Reviews of Interventions [internet]. 6.0. Cochrane; 2019. Available at: www.training.cochrane.org/handbook (accessed 24 May 2020). [Google Scholar]
- 25. Fu R., Gartlehner G., Grant M., Shamliyan T., Sedrakyan A., Wilt T. J., Griffith L., Oremus M., Raina P., Ismaila A., Santaguida P., Lau J., Trikalinos T. A. Conducting quantitative synthesis when comparing medical interventions: AHRQ and the Effective Health Care Program. J Clin Epidemiol 2011; 64(11): 1187–1197. 10.1016/j.jclinepi.2010.08.010 [DOI] [PubMed] [Google Scholar]
- 26. Williams R. J., Volberg R. A.. Best Practices in the Population Assessment of Problem Gambling [internet]. Guelph, ON: Faculty of Health Sciences; 2010. Available at: https://opus.uleth.ca/handle/10133/1259 [Google Scholar]
- 27. Williams R. J., Volberg R. A. The classification accuracy of four problem gambling assessment instruments in population research. Int Gambl Stud 2014; 14: 15–28. [Google Scholar]
- 28. Kraemer H. C., Stice E., Kazdin A., Offord D., Kupfer D. How do risk factors work together? Mediators, moderators, and independent, overlapping, and proxy risk factors. Am J Psychiatry 2001; 158: 848–856. [DOI] [PubMed] [Google Scholar]
- 29. Browne M., Hing N., Rockloff M., Russell A. M. T., Greer N., Nicoll F., et al. A multivariate evaluation of 25 proximal and distal risk‐factors for gambling‐related harm. J Clin Med 2019; 8: 509. [DOI] [PMC free article] [PubMed] [Google Scholar]
- 30. Gerstein D., Volberg R. A., Toce M. T., Harwood H., Johnson R. A., Buie T., et al. Gambling Impact and Behavior Study: Report to the National Gambling Impact Study Commission. Chicago, IL: National Opinion Research Center; 1999. [Google Scholar]
- 31. Wareham J. D., Potenza M. N. Pathological gambling and substance use disorders. Am J Drug Alcohol Abuse 2010; 36: 242–247. [DOI] [PMC free article] [PubMed] [Google Scholar]
- 32. Potenza M. N., Maciejewski P. K., Mazure C. M. A. Gender‐based examination of past‐year recreational gamblers. J Gambl Stud 2006; 22: 41–64. [DOI] [PubMed] [Google Scholar]
- 33. Sobell L. C., Sobell M. B. Alcohol Consumption Measures. In: Allen J. P., Columbus M., editors. Assessing Alcohol Problems: A Guide for Clinicians and Researchers. Bethesda, MD: National Institute on Alcohol Abuse and Alcoholism; 2003: 75–100. [Google Scholar]
- 34. Breen R. B., Zimmerman M. Rapid onset of pathological gambling in machine gamblers. J Gambl Stud 2002; 18: 31–43. [DOI] [PubMed] [Google Scholar]
- 35. Delfabbro P., King D. L., Browne M., Dowling N. A. Do EGMs have a stronger association with problem gambling than racing and casino table games? Evidence from a decade of Australian prevalence studies. J Gambl Stud 2020; 36: 499–511. [DOI] [PubMed] [Google Scholar]
- 36. Binde P., Romild U., Volberg R. A. Forms of gambling, gambling involvement and problem gambling: evidence from a Swedish population survey. Int Gambl Stud 2017; 17: 490–507. [Google Scholar]
- 37. Dowling N., Smith D., Thomas T. Electronic gaming machines: are they the ‘crack‐cocaine’ of gambling? Addiction 2005; 100: 33–45. [DOI] [PubMed] [Google Scholar]
- 38. Kim H. S., Hodgins D. C., Kim B., Wild T. C. Transdiagnostic or disorder specific? Indicators of substance and behavioral addictions nominated by people with lived experience. J Clin Med 2020; 9: 334. [DOI] [PMC free article] [PubMed] [Google Scholar]
Associated Data
This section collects any data citations, data availability statements, or supplementary materials included in this article.
Supplementary Materials
Data S1. Supporting information.