

Summary
Rest–activity patterns are important aspects of healthy sleep and may be disturbed in conditions like circadian rhythm disorders, insomnia, insufficient sleep syndrome, and neurological disorders. Long‐term monitoring of rest–activity patterns is typically performed with diaries or actigraphy. Here, we propose an unobtrusive method to obtain rest–activity patterns using smartphone keyboard activity. The present study investigated whether this proposed method reliably estimates rest and activity timing compared to daily self‐reports within healthy participants. First‐year students (n = 51) used a custom smartphone keyboard to passively and objectively measure smartphone use behaviours and completed the Consensus Sleep Diary for 1 week. The time of the last keyboard activity before a nightly absence of keystrokes, and the time of the first keyboard activity following this period were used as markers. Results revealed high correlations between these markers and user‐reported onset and offset of resting period (r ranged from 0.74 to 0.80). Linear mixed models could estimate onset and offset of resting periods with reasonable accuracy (R 2 ranged from 0.60 to 0.66). This indicates that smartphone keyboard activity can be used to estimate rest–activity patterns. In addition, effects of chronotype and type of day were investigated. Implementing this method in longitudinal studies would allow for long‐term monitoring of (disturbances to) rest–activity patterns, without user burden or additional costly devices. It could be particularly interesting to replicate these findings in studies amongst clinical populations with sleep‐related problems, or in populations for whom disturbances in rest–activity patterns are secondary complaints, such as neurological disorders.
Keywords: circadian rhythm, digital biomarker, field assessment, monitoring, sleep diary, smartphone application
1. INTRODUCTION
Throughout nature, circadian rhythms interact with organisms’ behaviour, and humans are no exception (Wager‐Smith & Kay, 2000). Disturbances in these rhythms can have severe implications for wellbeing, health, and performance (Haraszti et al., 2014; Savvidis & Koutsilieris, 2012). A prominent circadian rhythm is the sleep–wake pattern. For homeostasis and health, the sleep–wake patterns should be entrained to the 24‐hr light–dark cycle. Despite similar timing of dawn and dusk, persons living in the same time zone show substantial inter‐individual differences in their preferred sleep–wake pattern (Roenneberg, 2015).
Intended rest and activity times may differ due to exterior causes, e.g. work shifts and social obligations (Wittmann et al., 2006). Individual characteristics such as age, sex, and preferences also influence timing of rest and activity episodes during the 24‐hr day, e.g. older people tend to go to bed earlier than young adults (Thomas et al., 2014). Given these external and internal deviances in rest–activity patterns, a person’s specific phase of entrainment (chronotype) is commonly defined as either early, late or intermediate, with early types going to bed and getting out of bed substantially earlier than late types (Wittmann et al., 2006). Assessment of deviances, causes and consequences of specific rest–activity patterns is relevant for research purposes and clinical practice.
Insights in inter‐ and intra‐individual rest–activity cycles over a prolonged time can facilitate strategies for boosting mental performance (Dijk et al., 1992; Valdez et al., 2008) and optimising diurnal activities (Volk et al., 2017). Particularly young adults may experience challenges regarding healthy entrainments and stable rest–activity patterns. Other clinical populations may benefit from long‐term rest–activity monitoring such as those with circadian rhythm disturbances, (self‐imposed) sleep deprivation, or even central nervous system diseases that include sleep or rest–activity disturbances (e.g. Alzheimer’s disease, Hahn et al., 2014; for a review, see Veatch et al., 2017).
Assessment of rest–activity patterns can be done using questionnaires asking participants to report their resting behaviour over a relatively broad lookback period, or by using “sleep diaries” asking about the previous sleep episode each day. These diaries are considered the “gold standard” for relatively precise subjective rest–activity rhythm monitoring, and standardised versions have been validated (e.g. the Consensus Sleep Diary; Carney et al., 2012; Maich et al., 2018). Digital sleep diaries have been developed to simplify completing and processing the data. However, for longitudinal studies it still requires significant effort from participants to complete these diaries daily. Additionally, people might forget or erroneously estimate the time they went to bed. Typing errors and omitted diary entries make daily diaries prone to missing data. Actigraphy is often included to compensate for these pitfalls and to attempt to monitor and quantify daily rest–activity patterns more objectively through monitoring movement activity captured via wrist‐worn devices. This method requires participants to wear sensors that can introduce discomfort during sleep (Duignan et al., 2019) and distributing the devices among (numerous) participants might be challenging.
Sleep diaries and actigraphy have been widely used in studies amongst healthy populations, and in clinical settings to investigate rest–activity patterns such as sleep–wake cycles (Sadeh & Acebo, 2002). However, given the extensive use of smartphones, especially in young adults (Aoki & Downes, 2003), one could exploit smartphone derived data sources to estimate rest–activity patterns, which would be less burdensome, given that people could use their own smartphones. This could be especially beneficial for longitudinal or demanding study designs.
Smartphones have previously been examined as tools to measure rest–activity patterns, although most studies rely on in‐phone accelerometers to measure movements. This method demands users to attach the smartphone to their body or have it besides them in bed (Fino et al., 2020; Gautam et al., 2015) and can require the apps to run in the background continuously. Alternatively, one could monitor smartphone interaction (e.g. using screen on–off patterns; Abdullah et al., 2014). However, smartphone screens might also light up due to notifications, leaving it unclear whether any actual smartphone interaction occurred.
In contrast, smartphone keyboard activity can prove human interaction and can therefore be more suited for unobtrusively monitoring daily rhythms than other smartphone‐based tools. In this study, we investigated whether a new, easy‐to‐use, and effortless rest–activity monitoring method utilising a custom smartphone keyboard (Neurokeys) proves useful as a proxy for rest–activity patterns in a student sample.
2. METHODS
2.1. Participants
Students from Eindhoven University of Technology were invited to join the project, ultimately generating data to use in class. In total, 51 students (age range 17–24 years, M = 19.06, SD = 1.83) installed the Neurokeys App and completed sleep diaries (38 females, 12 males, one participant undeclared). The average MSFsc (mid‐sleep time on work/lecture‐free days corrected for accumulated sleep debt on work/lecture days) was 5.02 (SD = 1.12; range: 2.70–7.63) as assessed with the Munich Chronotype Questionnaire (Roenneberg et al., 2003). On average, participants had 1.53 hr of social jetlag (SD = 1.04; range: 0.00–4.00 hr). The Pittsburgh Sleep Quality Index (PSQI; Buysse et al., 1989) indicated that the participants showed, on average, at least some sleep disturbances (M = 5.38, SD = 2.24; range: 2.00–12.00).
2.2. Instruments
2.2.1. Smartphone keyboard
The Neurokeys App was designed by the Dutch company Neurocast B.V. to collect keystroke data from smartphones. It replaces the native phone keyboard with a smart keyboard, available for iOS and Android, which measures typing behaviour securely and unobtrusively. Collected keyboard activity is temporarily stored locally and sent securely to cloud storage in batches. To guarantee privacy, information about the specific typed letters or words is not collected. In the present study, the timestamps of keystroke activities were used to estimate rest–activity patterns and explore the relation with user‐reported rest–activity timing.
2.2.2. Sleep diary
The Consensus Sleep Diary (Carney et al., 2012) was used to measure user‐reported sleep timing, duration, and sleep quality. Participants were asked to report sleep‐related information about the previous night: what time they went to bed (bedtime), tried to sleep (try to sleep time), woke up (sleep offset), and got out of bed (time out of bed). Additionally, they estimated how many minutes they needed to fall asleep (sleep latency). The sleep diary also questioned sleep quality, number and length of awakenings during the night, number and last moment of alcoholic and caffeinated drinks on the previous day, and whether people woke up by their alarms or not. Lastly, people could add comments to each day if desired.
2.2.3. Munich Chronotype Questionnaire
The Munich Chronotype Questionnaire (Roenneberg et al., 2003) was developed to assess timing of sleep in a quantitative manner. It asks people to indicate their regular sleep‐related times (e.g. wake‐up time and bedtime) for both workdays and work‐free days. Based on these responses, the mid‐sleep time on free days was calculated, as well as the sleep debt on workdays. The resulting mid‐sleep time on free days corrected for sleep debt on workdays (MSFsc) is widely used as a measure of chronotype (Wittmann et al., 2006).
2.2.4. Pittsburgh Sleep Quality Index
The PSQI (Buysse et al., 1989) aims to measure self‐reported sleep quality with a lookback period of 1 month. It consists of 19 questions from which seven component scores are computed. The sum of these components can be used as an indicator of overall subjective sleep quality, and the questionnaire has been psychometrically validated (Carpenter & Andrykowski, 1998).
2.3. Procedure
Students were informed and invited to participate during a lecture. Participation was voluntary, and written consent was collected. The study was approved by the Ethics Committee of the Eindhoven University of Technology. Within the study, participants installed the Neurokeys App on their smartphone, completed the sleep diaries daily, received eight notifications to complete experience sampling questionnaires at random moments throughout each day, and responded to app‐generated questions from 16 to 22 September 2019 (and an optional second week). In the present study, we report on the sleep diary and keystroke data. Students received a reward based on their response rates, with a maximum of 12.50 euro (€).
2.4. Data analysis
Data processing and modelling was performed using Python 3.7. Obvious mistakes in the sleep diaries were corrected (e.g. changing 12‐hr notation to 24‐hr notation if this was congruent with the other responses), and other improbable values were coded as missing.
Total bed period (TBP) in hours was computed by subtracting the bedtime to the time out of bed for each day. Sleep onset was calculated by adding sleep latency to the try to sleep time. User‐reported total sleep period (TSP) in hours was computed by subtracting sleep onset from sleep offset, and thus refers to the episode from sleep onset to the final wake up time. Midpoint TSP was determined as the midpoint between sleep onset and sleep offset.
Using the keystroke timestamps, the longest time interval without keyboard activity between 19:00 and 15:00 hours (on the next day) was considered the keystroke‐absence period (KAP). The timestamps of the last keyboard activity before, and the first keyboard activity after this interval were labelled last keyboard time and first keyboard time, respectively. Lastly, midpoint KAP was determined using the last and first keyboard times.
Correlation analyses were run between user‐reported estimates (bedtime, try to sleep time, sleep onset, sleep offset, time out of bed, TBP, TSP, midpoint TSP) and keyboard‐based estimates of resting time (first keystroke, last keystroke, KAP, midpoint KAP), for each day separately. In addition, Bland–Altman plots (Altman & Bland, 1983) adjusted for repeated measures (Myles & Cui, 2007) were created to visualise agreement between the user‐reported and keyboard‐based estimates. Linear mixed‐effects models (LMMs) were fitted using Pymer4 (version 0.7.0; Jolly, 2018), providing a Python interface to the lme4 package in R (Bates et al., 2015; R Core Team, 2017), whereas partial R 2 was calculated with the R package r2glmm (Jaeger, 2017). In these models, Participant ID was added as a random intercept to account for repeated measures over days within participants. Correlations between the predictors were investigated to prevent multicollinearity. Model residuals were investigated to see whether the models fitted the data properly.
To determine whether the time differences between user‐reported and keyboard‐based estimates differed significantly from zero, unconditional LMMs (null models, without predictors besides the intercepts) were performed with the differences between the two estimates used as outcome parameters. To predict user‐reported bedtime, sleep onset, sleep offset, time out of bed, TBP and TSP with keystroke data, a series of LMMs were fitted with the user‐reported estimates as outcomes. Each of these models included gender as a predictor based on earlier findings regarding gender differences in the timing of sleep (Roenneberg et al., 2004). For the LMMs predicting user‐reported bedtime and sleep onset, predictors included: the time of the last keyboard interaction and the number of hours the keyboard had been used on the day prior (to account for the regularity of keyboard use). The LMMs predicting user‐reported sleep offset and time out of bed also included the time of the first keyboard interaction and the number of hours the keyboard had been used on the following day. Finally, for the LMMs predicting user‐reported TBP and TSP, predictors included: KAP, number of hours with keystrokes on the previous day and number of hours with keystrokes on the following day.
Moreover, we investigated whether there were structural differences in the keyboard‐based and user‐reported estimates of rest–activity patterns as a function of type of day and chronotype by means of LMMs with either type of day (workdays versus weekend) or chronotype (early, intermediate versus late) as predictor.
3. RESULTS
The results section is organised as follows: after descriptions of the available amount of data and the average self‐reported timings within the sleep diaries, several types of analyses are described. The paragraphs regarding “Onset of Sleep Period”, “Onset of Active Period” and “Total Resting Period” are split into two parts. The first part quantifies differences between user‐reported estimates and keyboard‐based markers, while taking into account the clustered nature of the data. Within the second part, models are created that predict the user‐reported estimates from keyboard‐based markers and other relevant predictors. Lastly, we investigated whether differences in timing due to type of day and chronotype are reflected in the keyboard‐based markers.
3.1. Available data
In total, participants completed 291 sleep diaries, ranging from 47 entries on the first day to 36 entries on the last day of the study (82% completion rate). Rest timing estimates were possible for 91% of sleep diary entries. For the remaining 33 entries, either the keyboard had not been used between 19:00 and 15:00 hours on the following day, or information was available for one end of the interval only. Therefore, the timing of the last or first keyboard interaction could not be determined, and, probably, the keyboard had not been used on 1 of the 2 days. Participants typically used their keyboard throughout the day, indicated by the number of hours during which keyboard activity was detected on a day (M = 13.13 hr, SD = 2.94). Mostly, users used the keyboard across at least 11 hr (i.e. the smartphone was used at least once within each hour).
3.2. Sleep diaries
On average, students reported to have gone to bed at around 23:55 hours (M = 23:56, SD = 01:42, range 20:00–05:33 hours), tried to fall asleep at around 00:30 hours (M = 00:32, SD = 01:41, range 20:05–06:50 hours), fallen asleep at 00:50 hours (M = 00:50, SD = 01:43, range 20:10–7:50 hours), woken up at around 08:30 hours (M = 08:31, SD = 01:44, range 03:40–13:35 hours) and gone out of bed at around 09:00 hours (M = 09:04, SD = 01:47, range 06:00–14:15 hours). Average user‐reported TBP was 9.11 (SD = 1.77) hr and average user‐reported TSP was 7.70 (SD = 1.71) hr. On average, participants reported awakening once during the night (M = 1.03, SD = 1.43). On 56% of weekdays, participants woke using an alarm, compared to 36% of weekend days. For differences in timing of the resting period due to type of day (weekend versus weekdays) and chronotype, see corresponding results sections. For a visualisation of the congruence between user‐reported and keyboard‐based data see Figure 1. Note that keyboard‐based markers were calculated independently form the diary data, and that none of the keyboard data were removed based on the user‐reported data.
FIGURE 1.
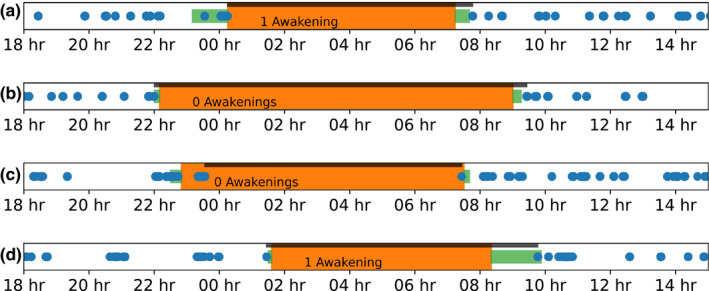
Visualisation of the user‐reported and keyboard‐based sleep estimates. The orange rectangles indicate total sleep period (TSP) and green rectangles time in bed according to the user. The blue dots denote keyboard activity, and the thick black line shows the keyboard‐absence period (KAP). The text indicates how often people woke up during the night, according to self‐reports. The top two panels show users who used the keyboard shortly before and after their sleeping time. The third user reported falling asleep around 23:00 hours, although used the smartphone afterwards. The last panel shows a user who did not use the smartphone’s keyboard directly after waking up
3.3. Onset of rest period
3.3.1. Keyboard‐based and user‐reported onset of rest period
The average last keyboard activity was at 00:01 hours, on average around 5 min later than user‐reported bedtimes (M = 0.08, SD = 1.18, in hr), 30 min earlier than user‐reported try to sleep times (M = −0.50, SD = 1.11, in hr) and 50 min earlier than user‐reported sleep onset (M = −0.81, SD = 1.15, in hr; Figure 2 depicts distributions of differences). Unconditional LMMs were used to investigate whether these differences significantly deviated from zero on a group level. The fixed intercept in the model for bedtime (estimate = 0.06, SE = 0.10) was not significantly different from zero, t (48.45) = 0.60, p = .552, indicating that, on average, no significant difference existed between the user‐reported bedtime and the last keyboard time (Figure S1 depicts individual variation in these differences). Regarding try to sleep time and sleep onset, statistically significant differences were found (both p < .001; Table S1). For correlations between user‐reported estimates of the resting period onset and last keyboard time for each day see Figure 3 (on average, rbedtime = 0.77, rtry to sleep time = 0.80, rsleep onset = 0.78). Bland–Altman plots indicating the level of agreement between user‐reported estimates and keyboard‐based markers are depicted in Figure S2.
FIGURE 2.
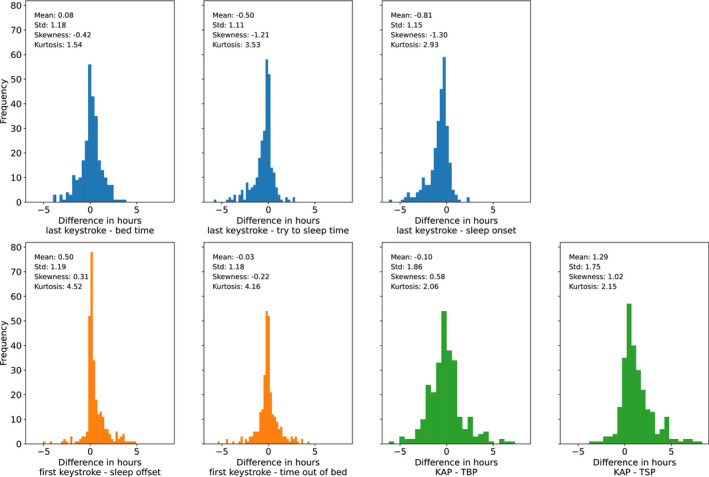
Distributions of difference scores between user‐reported and keyboard‐based estimates. Differences were computed by subtracting the user‐reported estimates from the last and first keyboard time or the keystroke‐absence period (KAP)
FIGURE 3.
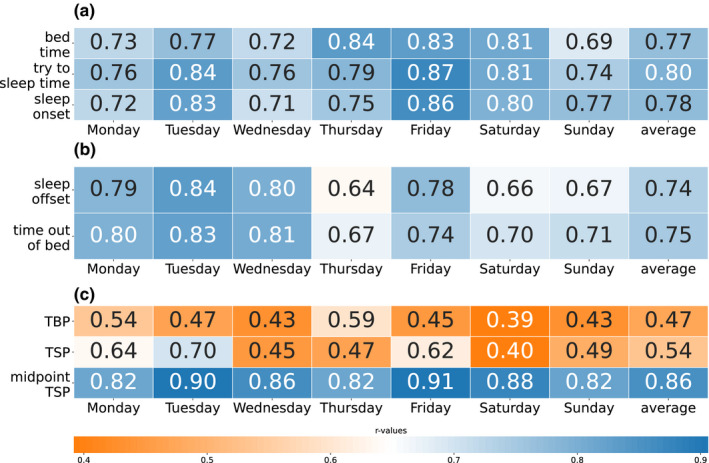
Correlations between last keyboard time and bedtime, try to sleep time, sleep onset (panel a), first keyboard time and sleep offset, time out of bed (panel b), and keystroke absence period (KAP) and total bed period (TBP), total sleep period (TSP) and midpoint TSP (panel c), all p < .05. The names of the days refer to the days on which the sleep diary was completed. The correlations are repeated for each day because of the dependencies in the data, and the results over the days should be seen as examples to show the stability of the relationships
3.3.2. Prediction of user‐reported onset of rest period
User‐reported bedtime was predicted using a LMM with last keyboard time, number of hours with keystrokes on the previous day, and gender as predictors. Last keyboard time and the number of hours with keystrokes on the previous day contributed significantly to the prediction (Table 1). In total, 70.2% of the variance in user‐reported bedtime could be explained (n = 273, 48 users). When only the fixed effects part of the model was used in prediction, 64.7% of the variance could be explained. Using these same predictors to estimate sleep onset, 75.0% of the variance could be explained in total, with 65.9% due to the fixed effects (coefficients in Table S2). For both bedtime and sleep onset, predictive power of keyboard‐based estimates increased when data were selected with at least 11 hr during which keyboard activity was detected on the previous day (Table S3).
TABLE 1.
Coefficients in the linear mixed‐effects model (LMM) predicting user‐reported bedtime
| Predictor | Coefficient | Confidence interval | T | df | p |
Partial R2 |
|---|---|---|---|---|---|---|
| Intercept | 0.64 | [0.12, 1.16] | 2.39 | 253.71 | .018 | |
| Last keyboard time | 0.73 | [0.66, 0.80] | 20.00 | 214.43 | <.001 | .62 |
| Hours with keystrokes previous day | −0.06 | [−0.10, −0.02] | −2.93 | 268.88 | .004 | .03 |
| Gender | 0.18 | [−0.18, 0.54] | 0.97 | 51.54 | .338 | .01 |
n = 273, 48 users. The unit of measurement is hr.
3.4. Onset of active period
3.4.1. Keyboard‐based and user‐reported onset of active period
The average first keyboard activity after the night was at 09:01 hours, which was, on average, around 30 min later than user‐reported sleep offset (M = 0.50, SD = 1.19, in hr) and 2 min earlier than user‐reported time out of bed (M = −0.03, SD = 1.18, in hr; Figure 2 depicts distributions of differences). LMMs investigating significance of these differences on a group level revealed that the intercept in the model for sleep offset did reach statistical significance (Table S1), whereas the intercept of the model for time out of bed (estimate = −0.04, SE = 0.10) was not significantly different from zero, t (46.10) = −0.37, p = .715. This indicates that no significant difference existed between user‐reported time out of bed and first keyboard time (Figure S1 shows individual variation in these differences). For correlations between user‐reported estimates for onset of the active period and the first keyboard activity for each day see Figure 3 (on average, rsleep offset = 0.74, rtime out of bed = 0.75).
3.4.2. Prediction of user‐reported onset of active period
User‐reported time out of bed was predicted using a LMM with first keyboard time, number of hours with keystrokes on the following day, and gender as predictors. First keyboard time and the number of hours on the following day contributed significantly to the prediction (Table 2). Overall, 73.4% of the variance could be explained (n = 274, 50 users). When only the fixed effects part of the model was used in prediction, 62.2% of the variance could be explained. The same predictors were used to estimate sleep offset, explaining 72.2% of the variance with random effects and 60.1% with only the fixed effects part (Table S4 describes coefficients). For both time out of bed and sleep offset, predictive power of keyboard‐based estimates increased when data were selected with at least 11 hr during which keyboard activity was detected on the following day (Table S5).
TABLE 2.
Coefficients in the linear mixed‐effects model (LMM) predicting user‐reported time out of bed
| Predictor | Coefficient | Confidence interval | t | df | p |
Partial R2 |
|---|---|---|---|---|---|---|
| Intercept | 0.72 | [−0.56, 1.96] | 1.15 | 259.22 | .252 | |
| First keyboard time | 0.81 | [0.73, 0.91] | 17.79 | 246.71 | <.001 | .56 |
| Hours with keystrokes | 0.07 | [0.02, 0.13] | 2.91 | 268.82 | .004 | .03 |
| Gender | 0.10 | [−0.35, 0.55] | 0.42 | 48.13 | .674 | .00 |
n = 274, 50 users. The unit of measurement is hr.
3.5. Total resting period
3.5.1. Keyboard‐based and user‐reported total resting period
Episodes without keyboard activity (KAP; M = 9.00, SD = 1.97) were, on average, smaller than user‐reported TBP (M = 9.11, SD = 1.77) and larger than TSP (M = 7.70, SD = 1.71). Difference scores were calculated by subtracting user‐reported estimates from KAP indicating an average difference with TBP of around 6 min (M = −0.10, SD = 1.86, in hr) and an average difference with TSP of around 75 min (M = 1.29, SD = 1.75, in hr; Figure 2 depicts distributions of differences). LMMs were used to investigate significance of these differences on a group level. The intercept of the model for TSP differed significantly from zero (Table S1), but the intercept for TBP did not (estimate = −0.09, SE = 0.18, t (46.20) = −0.52, p = .607), indicating that, on average, no statistically significant difference existed between the user‐reported TBP and the KAP (Figure S1 shows individual variation in these differences). For correlations between user‐reported estimates for the duration of the total resting period and KAP for each day see Figure 3 (on average, rTBP = 0.47, rTSP = 0.54).
3.5.2. Prediction of user‐reported total resting period
A LMM was applied to predict user‐reported TBP. Predictors were KAP, the number of hours with keyboard activity on the previous day, the number of hours with keyboard activity on the current day, and gender. KAP and the number of hours during which keyboard activity was detected on the previous day were significant predictors (Table 3). Overall, the model explained 54.2% of the variance in self‐reported TBP across 268 observations from 48 users. When only the fixed effects part of the model was used in prediction, 36.0% of the variance could be explained. Using the same predictors to estimate TSP, a total of 54.2% of the variance could be explained, and 36.2% with fixed effects only (Table S6 describes coefficients). For both TBP and TSP, predictive power of keyboard‐based estimates increased when data were selected with at least 11 hr of keyboard activity on the previous day (Table S7).
TABLE 3.
Coefficients in the linear mixed‐effects model (LMM) predicting user‐reported total bed period (TBP)
| Predictor | Coefficient | Confidence interval | t | df | p |
Partial R2 |
|---|---|---|---|---|---|---|
| Intercept | 1.96 | [0.13, 3.80] | 2.08 | 256.55 | .038 | |
| KAP | 0.57 | [0.47, 0.68] | 10.57 | 252.71 | <.001 | .27 |
| Hours with keystroke | 0.05 | [−0.03, 0.12] | 1.23 | 246.99 | .219 | .01 |
| Hours with keystrokes previous day | 0.11 | [0.06, 0.17] | 3.98 | 249.43 | <.001 | .05 |
| Gender | ‐ 0.20 | [−0.81, 0.42] | −0.63 | 48.90 | .535 | .00 |
n = 268, 48 users. The unit of measurement is hr. KAP, keystroke‐absence period.
3.5.3. Midpoint of total resting period
The average midpoint KAP was at 04:31 hours, which was, on average, 9.83 min earlier (M = −0.16, SD = 0.75, in hr) than the midpoint TSP. A LMM investigating the significance of this difference on a group level showed that the intercept reached significance (Table S1), indicating a statistically significant difference between the midpoints of user‐reported TSP and KAP. To facilitate later comparisons between the present study and that of Abdullah et al. (2014), 95% confidence intervals around the mean difference were also computed, resulting in a mean difference of 9.83 ± 5.40 min compared to the TSP midpoint. For correlations between midpoint TSP derived from user‐reported estimates and midpoint KAP for each day see Figure 3 (on average, rmidpoint TSP = 0.86).
3.6. Rest–activity patterns across days and chronotypes
3.6.1. Differences between types of day
Rest–activity patterns were compared between weekend and workdays. On average, bedtime, try to sleep time, sleep onset, last keyboard time, sleep offset, time out of bed, and first keyboard time were later during the weekend (Table 4 and Figure 4). LMMs were fitted to investigate whether type of day was a significant predictor for each of the time estimates, which was true for all user‐reported and keyboard‐based estimates (Table 5). See the Supplementary section on moderation analyses for the change in predictive power of the keyboard‐based markers due to type of day.
TABLE 4.
Mean and standard deviations for sleep timing estimates and keyboard use before and after keystroke‐absence period (KAP) on workdays and in the weekend. Times are calculated as the difference in hours from midnight (e.g. −0.25 refers to 23:45 hours)
| Estimate | Workday | Weekend | |||||
|---|---|---|---|---|---|---|---|
| M | SD | M | SD | ||||
| User‐reported | |||||||
| Time to bed | −0.23 | 1.59 | 0.45 | 1.89 | |||
| Try to sleep time | 0.34 | 1.56 | 1.10 | 1.92 | |||
| Sleep onset | 0.66 | 1.59 | 1.39 | 1.94 | |||
| Sleep offset | 8.23 | 1.59 | 9.40 | 1.85 | |||
| Time out of bed | 8.76 | 1.64 | 9.96 | 1.86 | |||
| Keyboard‐based | |||||||
| Last keyboard time | −0.11 | 1.79 | 0.41 | 2.09 | |||
| First keyboard time | 8.71 | 1.50 | 9.97 | 2.03 | |||
FIGURE 4.
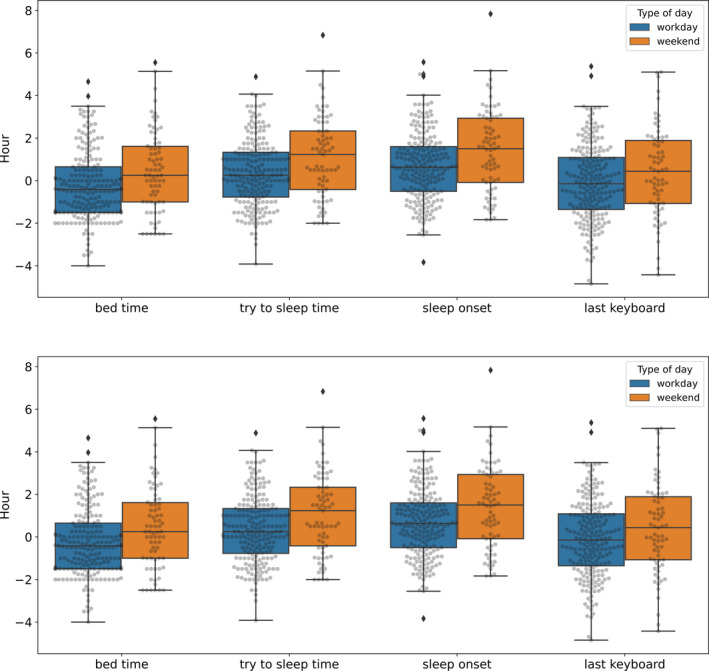
Boxplots of estimates for bedtime, try to sleep time, sleep onset, sleep offset and time out of bed (self‐reported) and first and last keyboard time (keyboard‐based) for both workdays and weekend days. All data points are added in grey on top of the boxplots
TABLE 5.
Coefficients in the linear mixed‐effects models (LMMs) predicting user‐reported and keyboard‐based estimates from type of day (weekend versus workdays)
| Estimate | Confidence interval | t | df | p | |
|---|---|---|---|---|---|
| Bedtime | |||||
| Intercept | 0.26 | [−0.58, 0.05] | −1.63 | 58.48 | .108 |
| Type of day | 0.70 | [0.32, 1.09] | 3.58 | 242.00 | <.001 |
| Try to sleep time | |||||
| Intercept | 0.30 | [−0.03, 0.63] | 1.79 | 57.09 | .079 |
| Type of day | 0.81 | [0.44, 1.18] | 4.30 | 239.21 | <.001 |
| Sleep onset | |||||
| Intercept | 0.62 | [0.28, 0.95] | 3.65 | 58.09 | <.001 |
| Type of day | 0.76 | [0.38, 1.13] | 3.99 | 239.96 | <.001 |
| Last keyboard time | |||||
| Intercept | −0.17 | [−0.57, 0.22] | −0.87 | 56.12 | .387 |
| Type of day | 0.52 | [0.13, 0.91] | 2.61 | 240.81 | <.001 |
| Time out of bed | |||||
| Intercept | 8.72 | [8.38; 9.06] | 50.91 | 60.46 | <.001 |
| Type of day | 1.91 | [0.83, 1.55] | 6.442 | 244.27 | <.001 |
| Sleep offset | |||||
| Intercept | 8.18 | [7.84, 8.51] | 48.23 | 60.05 | <.001 |
| Type of day | 1.16 | [0.81, 1.50] | 6.51 | 243.93 | <.001 |
| First keyboard time | |||||
| Intercept | 8.66 | [8.32, 9.00] | 50.62 | 58.25 | <.001 |
| Type of day | 1.24 | [0.29, 0.70] | 7.13 | 242.55 | <.001 |
The unit of measurement is hr.
3.6.2. Differences between chronotypes
To compare different chronotypes, MSFsc scores were divided into three equally‐sized groups. People with MSFsc <4.54 (M = 3.86, SD = 0.62, n = 16) were considered early, MSFsc 4.54–5.54 were intermediate (M = 4.99, SD = 0.31, n = 15), and the remainder (M = 6.29, SD = 0.53, n = 15) late types. These group boundaries are similar to the ones suggested by Roenneberg et al. (2003). Visual inspection and descriptive statistics indicate that differences in chronotypes (early, intermediate, and late) were reflected in user‐reported and keyboard‐based estimates (Table 6 and Figure 5). Examples of how keyboard data can serve as an actigraphy tool are shown in Figure 6, depicting a person with a relatively early, and a person with a relatively late chronotype.
TABLE 6.
Mean and standard deviations for sleep timing estimates and keyboard use before and after keystroke‐absence period (KAP) for different chronotypes. Times are calculated as the difference in hours from midnight (e.g. −0.25 refers to 23:45 hours)
| Estimate | Early | Intermediate | Late | |||
|---|---|---|---|---|---|---|
| M | SD | M | SD | M | SD | |
| User‐reported | ||||||
| Time to bed | −0.75 | 1.70 | −0.15 | 1.64 | 0.77 | 1.56 |
| Try to sleep time | −0.15 | 1.76 | 0.43 | 1.63 | 1.42 | 1.40 |
| Sleep onset | 0.12 | 1.76 | 0.80 | 1.66 | 1.73 | 1.44 |
| Sleep offset | 7.96 | 1.17 | 8.48 | 1.71 | 9.38 | 1.90 |
| Time out of bed | 8.44 | 1.26 | 8.94 | 1.74 | 9.98 | 1.95 |
| Keyboard‐based | ||||||
| Last keyboard time | −0.80 | 1.78 | −0.14 | 1.78 | 1.21 | 1.62 |
| First keyboard time | 8.55 | 1.50 | 8.75 | 1.54 | 9.86 | 1.86 |
FIGURE 5.
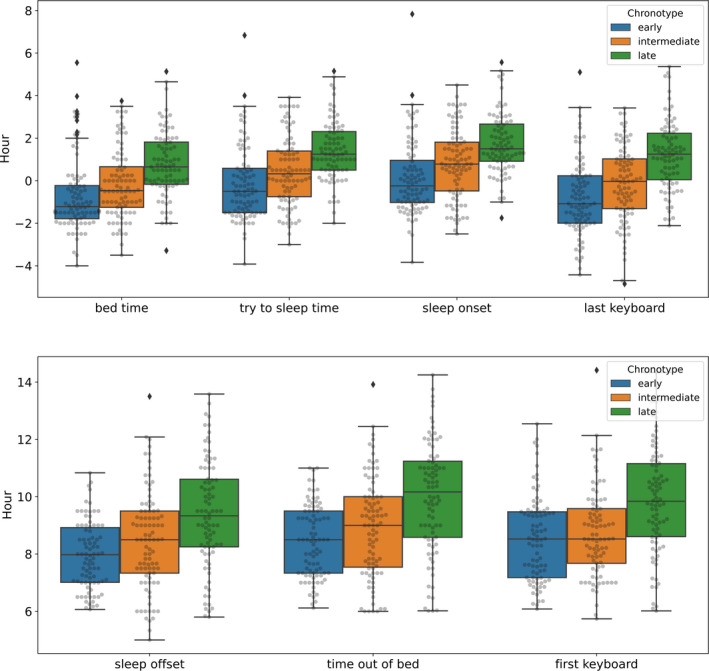
Boxplots of estimates for bedtime, try to sleep time, sleep onset, sleep offset and time out of bed (self‐reported) and first and last keyboard time (keyboard‐based) for early, intermediate and late chronotypes. All data points are added in grey on top of the boxplots
FIGURE 6.
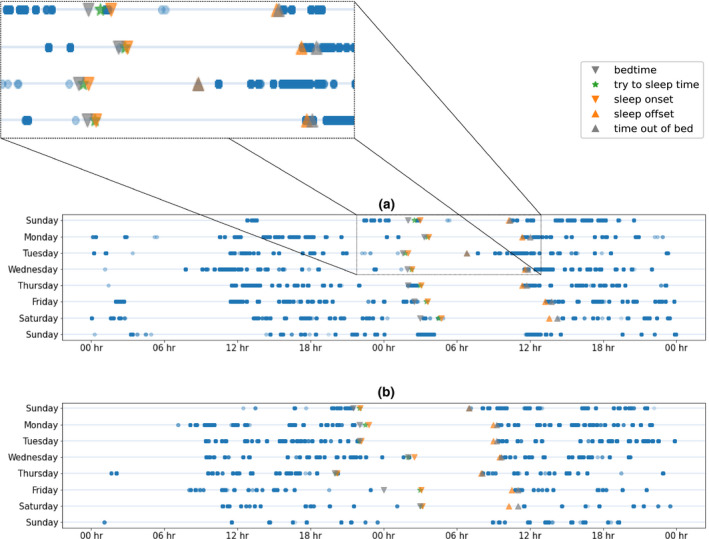
Keyboard data for two users are depicted as double actograms. The first row in each panel shows data of Sunday and Monday, the second row data of Monday and Tuesday. Data points are plotted with transparency, with a more opaque colour indicating more points. Grey downward facing triangles indicate user‐reported bedtime, upward facing user‐reported time out of bed. Orange downward facing triangles indicate sleep onset, upward facing sleep offset as reported by the participant. Green stars denote user‐reported try to sleep time. The actograms in the upper panel (a) and lower panel (b) refer to the data of participants with a relatively late and early chronotype, respectively
LMMs were fitted to investigate whether chronotype was a significant predictor for each time estimate. The intermediate chronotype was used as the baseline to compare early and late types. Late, but not early chronotype was significantly different compared to the intermediate chronotype for user‐reported and keyboard‐based estimates (Table 7). See the Supplementary section on moderation analyses for the change in predictive power of the keyboard‐based markers due to chronotype.
TABLE 7.
Coefficients in the linear mixed‐effects models (LMMs) predicting user‐reported and keyboard‐based estimates from chronotype (early and late compared to intermediate)
| Estimate | Confidence interval | t | df | p | |
|---|---|---|---|---|---|
| Bedtime (n = 263, 45 users) | |||||
| Intercept | −0.19 | [−0.64, 0.27] | −0.79 | 41.39 | .436 |
| Chronotype (early) | −0.59 | [−1.23, 0.06] | −1.75 | 41.67 | .087 |
| Chronotype (late) | 0.94 | [0.29, 1.60] | 2.80 | 42.18 | .008 |
| Try to sleep time (n = 262, 45 users) | |||||
| Intercept | 0.39 | [−0.09, 0.86] | 1.58 | 41.83 | .121 |
| Chronotype (early) | −0.56 | [−1.23, 0.11] | −1.61 | 42.14 | .114 |
| Chronotype (late) | 1.02 | [0.35, 1.69] | 2.92 | 42.94 | .005 |
| Sleep onset (n = 262, 45 users) | |||||
| Intercept | 0.75 | [0.27, 1.23] | 3.00 | 42.50 | .004 |
| Chronotype (early) | −0.64 | [−1.32, 0.05] | −1.80 | 42.84 | .079 |
| Chronotype (late) | 0.95 | [0.26, 1.65] | 2.67 | 43.65 | .011 |
| Last keyboard time (n = 263, 46 users) | |||||
| Intercept | −0.23 | [−0.80, 0.35] | −0.76 | 40.86 | .450 |
| Chronotype (early) | −0.63 | [−1.44, 0.18] | −1.50 | 41.89 | .141 |
| Chronotype (late) | 1.41 | [0.59, 2.23] | 3.34 | 41.49 | .002 |
| Time out of bed (n = 264, 46 users) | |||||
| Intercept | 8.85 | [8.32, 9.38] | 32.39 | 41.85 | <.001 |
| Chronotype (early) | −0.39 | [−1.14, 0.36] | −1.02 | 43.46 | .315 |
| Chronotype (late) | 1.06 | [0.30, 1.81] | 2.70 | 42.77 | .010 |
| Sleep offset (n = 264, 46 users) | |||||
| Intercept | 8.40 | [7.96, 8.93] | 30.67 | 41.89 | <.001 |
| Chronotype (early) | −0.42 | [−1.16, 0.33] | −1.07 | 43.66 | .289 |
| Chronotype (late) | 0.90 | [0.15, 1.66] | 2.31 | 42.94 | .026 |
| First keyboard time (n = 263, 46 users) | |||||
| Intercept | 8.70 | [8.13, 9.27] | 29.59 | 40.71 | <.001 |
| Chronotype (early) | −0.13 | [−0.93, 0.68] | −0.30 | 41.75 | .764 |
| Chronotype (late) | 0.99 | [0.17, 1.79] | 2.35 | 41.36 | .023 |
The unit of measurement is hr.
4. DISCUSSION
The present study investigated whether smartphone keyboard activity could be used to estimate rest–activity patterns. Both correlational analyses and LMMs showed that the detection of simple, unobtrusive markers such as the first and last keyboard interaction can be powerful predictors of the onset of resting and active periods among students. Thus, smartphone keyboard activity can be employed as a proxy for rest–activity cycles within this population.
Regarding comparison between keyboard‐based estimates and user‐reported estimates, keyboard‐based estimates for both the onset and offset of the total resting period were closer to user‐reported bed‐related estimates than user‐reported sleep‐related estimates. Specifically, the last keyboard time was closer to bedtime than to sleep onset, and the first keyboard time closer to time out of bed than to sleep offset. This indicates that keyboard activity patterns correspond with the smartphone users’ intended start and end of resting periods, which could be monitored longitudinally using keystroke logging without extra effort for users. Regarding the duration of the resting period, the length of the interval without keyboard activity lay between the TBP and TSP, indicating the value of keyboard‐based estimation as a rest–activity indicator.
The present results indicate that regularity of smartphone keyboard activity on the previous or following day improves the prediction of user‐reported estimates from the keyboard estimates. When data with a high number of hours during which keyboard activity was detected were selected in additional analyses, predictive power increased. Moreover, additional exploratory analyses revealed that keyboard‐based estimates had higher predictive power for markers of the timing of the active period during weekdays compared to weekends and for relatively late compared to relatively early and intermediate chronotypes (see Supplementary materials). Differences in rest–activity timing due to type of day and (partly) chronotypes were reflected in the keyboard‐based markers.
A limitation of using keyboard interactions as a proxy for activity is that the passive monitoring app may not capture situations where people interact with their smartphone without using the keyboard, for example turning off an alarm. Smartphone unlock or touch events would prove interactions with their device, although gathering this information is not technologically feasible for iOS devices. An alternative would be to monitor whether the smartphone screen is lit. However, this may be generated by a notification and therefore cannot prove active smartphone interaction, or corresponding wakefulness. Abdullah et al. (2014) used screen on–off events rather than keystrokes and achieved a 23.8 ± 11.0 min deviation from user‐reported mid‐sleep time. The present study improved on this estimate, showing an average difference of 9.83 ± 5.40 min, indicating a 41.3% decrease in difference. This could facilitate improved estimation of circadian rhythm discrepancies from mid‐sleep times within studies (Roenneberg et al., 2003). To our knowledge only one previous study has used a similar keyboard‐based method, although this focussed on mood disturbances (Zulueta et al., 2018).
Compared with other smartphone‐based attempts of rest–activity monitoring, the Neurokeys keyboard does not require continuous sensor monitoring, which might drain batteries (used by e.g. Abdullah et al., 2014), but instead replaces a native component (the keyboard) on the smartphone. Additionally, the present study was conducted on the participants’ own smartphones (contrary to e.g. Zulueta et al., 2018), making implementation for users easier.
Demographically students are an interesting sub‐group in which to study rest–activity behaviour and smartphone use given their technological connectedness. Young people use their smartphone keyboards more often (Forgays et al., 2014) and might also be more likely to use their smartphones in the evening compared to other ages. A caveat is that while frequent smartphone use makes them more suited to monitor, this could potentially reduce comparability of the student‐based data to other populations. However, students’ atypical rest–activity patterns make them a population of interest for keyboard activity markers in their own right. Generally students have large social jetlag (i.e. different rest patterns on days with and without social obligations; Wittmann et al., 2006), in that respect the student population forms a good test: there is more variation in e.g. the offset of the resting period, so the keyboard markers do not simply indicate the average offset of the resting period. It should be noted, however, that the majority of participants in the present study were students within the same study programme who were studied in the same week, so cohort effects could limit generalisability.
In addition to replication among students as well as other populations, data collection should be prolonged to increase reliability of found effects. Adding collection of smartphone interactions to longitudinal studies would allow for long‐term rest–activity monitoring without requiring people to wear actigraphy devices or complete numerous sleep diaries. Additionally, one could combine sleep diaries with the keyboard data at the start of a longitudinal study to make user‐specific models and then continue data collection without the sleep diaries to estimate rest–activity patterns for a longer period (Abdullah et al., 2014 performed a similar approach). Building models per participant like that would potentially be more accurate than population‐level models.
In the present study, keyboard markers were compared to self‐reports completed after waking. Keyboard activity inherently proves active interaction, but can only estimate which periods of inactivity indicate resting. Comparing keyboard‐based estimates to those made by another objective method, such as actigraphy, would be an interesting next step; however, comparison is difficult given actigraphy measures a conceptually different construct. Actigraphy assesses physical, indeliberate movements, whereas smartphone keyboards record intended behaviour.
Keyboard‐based markers could enable research into disrupted rest–activity patterns and encourage the implementation of longitudinal study designs taking advantage of data gathered objectively and unobtrusively in a real‐world setting. This might be helpful within clinical sleep populations (e.g. to monitor treatment effects), or other populations benefiting from longitudinal rest–activity based insights such as neurological populations. For these patients, resting patterns are often altered and can be important secondary outcomes. Especially for secondary outcomes, unobtrusive monitoring should be preferred to limit user‐burden. For example, the tool could be included in studies investigating changes in resting patterns over the course of multiple sclerosis.
To conclude, the present study is the first into the use of smartphone keyboard activity to estimate rest–activity patterns. Results showed that keyboard‐based markers have the potential be used as a proxy for the onset and the offset of resting periods within a student sample, and generalisation to other samples should be investigated. Given their effortless monitoring method (users merely install a different smartphone keyboard); these markers could be gathered in longitudinal studies or clinical practice without extra burden for participants. Keystroke timing, and other smartphone interaction‐based data could also be used as a monitoring tool alongside treatment of diseases that involve sleep difficulties, the accuracy of which could improve with increasing monitoring durations and addition of user‐based modelling.
CONFLICT OF INTEREST
GD, HM and GL are employed by Neurocast B.V.. SO, KS, CZ and YK declare no conflict of interest.
AUTHOR CONTRIBUTIONS
KS, CZ and YK designed the study; KS and CZ collected the data; GD analysed the data under supervision of GL; HM, KS and SO helped interpret the analysed data; GD and HM drafted the manuscript; all authors contributed to the revision of the manuscript and approved the final manuscript.
Supporting information
Druijff‐van de Woestijne GB, McConchie H, de Kort YAW, et al. Behavioural biometrics: Using smartphone keyboard activity as a proxy for rest–activity patterns. J Sleep Res. 2021;30:e13285. 10.1111/jsr.13285
DATA AVAILABILITY STATEMENT
Research data are not shared.
REFERENCES
- Abdullah, S. , Matthews, M. , Murnane, E. L. , Gay, G. , & Choudhury, T. (2014). Towards circadian computing: "Early to bed and early to rise" makes some of us unhealthy and sleep deprived. Proceedings of the 2014 ACM international joint conference on pervasive and ubiquitous computing, 673‐684. 10.1145/2632048.2632100 [DOI] [Google Scholar]
- Altman, D. G. , & Bland, J. M. (1983). Measurement in medicine: The analysis of method comparison studies. Journal of the Royal Statistical Society: Series D (The Statistician), 32(3), 307–317. 10.2307/2987937 [DOI] [Google Scholar]
- Aoki, K. , & Downes, E. J. (2003). An analysis of young people’s use of and attitudes toward cell phones. Telematics and Informatics, 20, 349–364. 10.1016/S0736-5853(03)00018-2 [DOI] [Google Scholar]
- Bates, D. , Mächler, M. , Bolker, B. , & Walker, S. (2015). Fitting Linear Mixed‐Effects Models Using lme4. Journal of Statistical Software, 67, 1–48. 10.18637/jss.v067.i01 [DOI] [Google Scholar]
- Buysse, D. J. , Reynolds, C. F. III , Monk, T. H. , Berman, S. R. , & Kupfer, D. J. (1989). The Pittsburgh Sleep Quality Index: A new instrument for psychiatric practice and research. Psychiatry Research, 28(2), 193–213. 10.1016/0165-1781(89)90047-4 [DOI] [PubMed] [Google Scholar]
- Carney, C. E. , Buysse, D. J. , Ancoli‐Israel, S. , Edinger, J. D. , Krystal, A. D. , Lichstein, K. L. , & Morin, C. M. (2012). The consensus sleep diary: Standardizing prospective sleep self‐monitoring. Sleep, 35, 287–302. 10.5665/sleep.1642 [DOI] [PMC free article] [PubMed] [Google Scholar]
- Carpenter, J. S. , & Andrykowski, M. A. (1998). Psychometric evaluation of the Pittsburgh Sleep Quality Index. Journal of Psychosomatic Research, 45, 5–13. 10.1016/S0022-3999(97)00298-5 [DOI] [PubMed] [Google Scholar]
- Dijk, D. J. , Duffy, J. F. , & Czeisler, C. A. (1992). Circadian and sleep/wake dependent aspects of subjective alertness and cognitive performance. Journal of Sleep Research, 1(2), 112–117. 10.1111/j.1365-2869.1992.tb00021.x [DOI] [PubMed] [Google Scholar]
- Duignan, C. , Slevin, P. , Sett, N. , & Caulfield, B. (2019). Consumer Wearable Deployments in Actigraphy Research: Evaluation of an Observational Study. JMIR mHealth and uHealth, 7(6), e12190. 10.2196/12190 [DOI] [PMC free article] [PubMed] [Google Scholar]
- Fino, E. , Plazzi, G. , Filardi, M. , Marzocchi, M. , Pizza, F. , Vandi, S. , & Mazzetti, M. (2020). (Not so) Smart sleep tracking through the phone: Findings from a polysomnography study testing the reliability of four sleep applications. Journal of Sleep Research, 29, e12935. 10.1111/jsr.12935 [DOI] [PubMed] [Google Scholar]
- Forgays, D. K. , Hyman, I. , & Schreiber, J. (2014). Texting everywhere for everything: Gender and age differences in cell phone etiquette and use. Computers in Human Behavior, 31, 314–321. 10.1016/j.chb.2013.10.053 [DOI] [Google Scholar]
- Gautam, A. , Naik, V. S. , Gupta, A. , Sharma, S. K. , & Sriram, K. (2015). An smartphone‐based algorithm to measure and model quantity of sleep. In 2015 7th International Conference on Communication Systems and Networks (COMSNETS) (pp. 1‐6). IEEE. [Google Scholar]
- Hahn, E. A. , Wang, H. X. , Andel, R. , & Fratiglioni, L. (2014). A change in sleep pattern may predict Alzheimer disease. The American Journal of Geriatric Psychiatry, 22, 1262–1271. 10.1016/j.jagp.2013.04.015 [DOI] [PubMed] [Google Scholar]
- Haraszti, R. Á. , Ella, K. , Gyöngyösi, N. , Roenneberg, T. , & Káldi, K. (2014). Social jetlag negatively correlates with academic performance in undergraduates. Chronobiology International, 31(5), 603–612. 10.3109/07420528.2013.879164 [DOI] [PubMed] [Google Scholar]
- Jaeger, B. (2017). R2glmm: computes R squared for mixed (multilevel) models. R package. Retrieved from https://cran.r‐project.org/package=r2glmm [Google Scholar]
- Jolly, E. (2018). Pymer4: Connecting R and Python for Linear Mixed Modeling. Journal of Open Source Software, 3, 862. 10.21105/joss.00862 [DOI] [Google Scholar]
- Maich, K. H. , Lachowski, A. M. , & Carney, C. E. (2018). Psychometric properties of the consensus sleep diary in those with insomnia disorder. Behavioral Sleep Medicine, 16, 117–134. 10.1080/15402002.2016.1173556 [DOI] [PubMed] [Google Scholar]
- Myles, P. S. , & Cui, J. (2007). I. Using the Bland‐Altman method to measure agreement with repeated measures. British Journal of Anaesthesia, 99(3), 309–311. 10.1093/bja/aem214 [DOI] [PubMed] [Google Scholar]
- R Core Team (2017). R: A Language and Environment for Statistical Computing. R Foundation for Statistical Computing. http://www.R‐project.org/ [Google Scholar]
- Roenneberg, T. (2015). Having trouble typing? What on earth is chronotype? Journal of Biological Rhythms, 30(6), 487–491. 10.1177/0748730415603835 [DOI] [PubMed] [Google Scholar]
- Roenneberg, T. , Kuehnle, T. , Pramstaller, P. P. , Ricken, J. , Havel, M. , Guth, A. , & Merrow, M. (2004). A marker for the end of adolescence. Current Biology, 14(24), R1038–R1039. 10.1016/j.cub.2004.11.039 [DOI] [PubMed] [Google Scholar]
- Roenneberg, T. , Wirz‐Justice, A. , & Merrow, M. (2003). Life between clocks: Daily temporal patterns of human chronotypes. Journal of Biological Rhythms, 18, 80–90. 10.1177/0748730402239679 [DOI] [PubMed] [Google Scholar]
- Sadeh, A. , & Acebo, C. (2002). The role of actigraphy in sleep medicine. Sleep Medicine Reviews, 6(2), 113–124. 10.1053/smrv.2001.0182 [DOI] [PubMed] [Google Scholar]
- Savvidis, C. , & Koutsilieris, M. (2012). Circadian rhythm disruption in cancer biology. Molecular Medicine, 18(9), 1249–1260. 10.2119/molmed.2012.00077 [DOI] [PMC free article] [PubMed] [Google Scholar]
- Thomas, S. J. , Lichstein, K. L. , Taylor, D. J. , Riedel, B. W. , & Bush, A. J. (2014). Epidemiology of bedtime, arising time, and time in bed: Analysis of age, gender, and ethnicity. Behavioral Sleep Medicine, 12(3), 169–182. 10.1080/15402002.2013.778202 [DOI] [PubMed] [Google Scholar]
- Valdez, P. , Reilly, T. , & Waterhouse, J. (2008). Rhythms of mental performance. Mind, Brain, and Education, 2(1), 7–16. 10.1111/j.1751-228X.2008.00023.x [DOI] [Google Scholar]
- Veatch, O. J. , Keenan, B. T. , Gehrman, P. R. , Malow, B. A. , & Pack, A. I. (2017). Pleiotropic genetic effects influencing sleep and neurological disorders. The Lancet Neurology, 16(2), 158–170. 10.1016/S1474-4422(16)30339-8 [DOI] [PMC free article] [PubMed] [Google Scholar]
- Volk, S. , Pearsall, M. J. , Christian, M. S. , & Becker, W. J. (2017). Chronotype diversity in teams: Toward a theory of team energetic asynchrony. Academy of Management Review, 42(4), 683–702. 10.5465/amr.2015.0185 [DOI] [Google Scholar]
- Wager‐Smith, K. , & Kay, S. A. (2000). Circadian rhythm genetics: From flies to mice to humans. Nature Genetics, 26(1), 23–27. 10.1038/79134 [DOI] [PubMed] [Google Scholar]
- Wittmann, M. , Dinich, J. , Merrow, M. , & Roenneberg, T. (2006). Social jetlag: Misalignment of biological and social time. Chronobiology International, 23, 497–509. 10.1080/07420520500545979 [DOI] [PubMed] [Google Scholar]
- Zulueta, J. , Piscitello, A. , Rasic, M. , Easter, R. , Babu, P. , Langenecker, S. A. , McInnis, M. , Ajilore, O. , Nelson, P. C. , Ryan, K. , & Leow, A. (2018). Predicting mood disturbance severity with mobile phone keystroke metadata: A biaffect digital phenotyping study. Journal of Medical Internet Research, 20(7), e241. 10.2196/jmir.9775 [DOI] [PMC free article] [PubMed] [Google Scholar]
Associated Data
This section collects any data citations, data availability statements, or supplementary materials included in this article.
Supplementary Materials
Data Availability Statement
Research data are not shared.