

Abstract
To obtain a wide variety of green materials, numerous investigations have been undertaken on industrial waste that can act as sustainable resources. The use of hazardous wastes derived from wastewater treatment plants (WWTPs), especially the activated carbon used in odor control systems, is a highly abundant, scalable, and cost‐effective strategy. The reuse of waste materials is a key aspect, especially for the sustainable development of emerging energy storage systems, such as lithium‐sulfur (Li−S) batteries. Herein, granular active carbons from two WWTP treatment lines were regenerated in air at low temperature and utilized as the sulfur host with micro‐/mesoporous framework. The resulting regenerated carbon and sulfur composites were employed as cathodes for Li−S cells. The SL‐ACt3@S composite electrode with 60 wt% loaded sulfur exhibited a remarkable initial capacity of 1100 mAh g−1 at C/10 rate and higher than 800 mAh g−1 at C/2. Even at a rate of 1C, it maintained a high capacity of almost 700 mAh g−1 with a capacity retention of 85.4 % after 350 cycles, demonstrating a very low capacity fading of only 0.042 % per cycle. It is essential to note that the coulombic efficiency was always higher than 96 % during all the cycles. In this proposal, the only used source material was expired carbon from WWTP that was obtained with a simple and effective regeneration process. This “trash into treasure” strategy leads to a new way for using hazardous waste material as high‐performance and environmentally safe electrodes for advanced Li−S batteries.
Keywords: activated carbon, biomass, lithium-sulfur batteries, thermal regeneration, wastewater treatment plant
Smells like energy: A sustainable Li−S battery exploiting a hazardous waste derived from the odor control filter of a wastewater treatment plant delivers a high capacity for an extended number of charge/discharge cycles.
Introduction
Lithium‐sulfur (Li−S) batteries have been postulated as the next‐generation rechargeable battery system owing to a high theoretical energy density (2552 Wh kg−1), a high theoretical capacity (1672 mAh g−1), its low cost, and an abundance of sulfur in nature. Furthermore, it is considered an environmentally benign element compared to some transition metals used in lithium‐ion batteries (LIBs).[ 1 , 2 , 3 , 4 ] However, certain barriers must be overcome in order to avoid capacity fading during cycling and to achieve its commercialization, such as the following: (a) sulfur and solid reduction products (Li2S2 and Li2S) are poor electrical conductors, leading to poor electrochemical utilization of S and lithium polysulfides (LiPSs); (b) the formation of intermediate polysulfides causes a huge volume expansion of the cathode during lithiation; and (c) the dissolution of some formed polysulfides (Li2S x , 2≤x≤8) in the electrolyte gives rise to unfavorable reactions of the LiPSs with the Li anode due to the formation of an insulating layer of Li2S2/Li2S, which increases the resistance of the Li−S batteries and decreases the amount of active components in the cathode and, therefore, the life cycle of the cells.[ 5 , 6 ] To address these challenges, the impregnation of sulfur into non‐polar porous conductive carbons and other functionalized carbons was first attempted to improve its development because they possess good conductivity and large surface areas.[ 7 , 8 , 9 , 10 ]
Among various nanostructured carbon‐based materials, carbon nanotubes, [11] microporous carbons, [12] porous hollow carbons, [13] hollow carbon spheres, [14] graphenes, [15] and graphenes doped with heteroatoms [16] can be highlighted as sulfur scavenging/trapping materials with good performance in this battery technology. Although this type of carbonaceous material has been highly efficient as a sulfur host and its study has contributed to the development of Li−S batteries, its design is usually not carried out using sustainable or low‐cost methods. In most cases, the preparation of nanostructured carbons involves complex synthesis processes (such as soft templates, hard templates, and multiple templates) and expensive and non‐renewable precursors, consequently limiting its commercial applications.[ 17 , 18 ] Hence, considerable efforts have been devoted to design activated carbons (ACs) from biomass residues, wherein the raw material is normally cheap and abundant, and in addition, its usual manufacturing methods are fast and simple.[ 19 , 20 , 21 ]
Nevertheless, the processes used for the production of carbons derived from biomass as Li−S electrodes usually require three basic conditions: (1) high pyrolysis temperature, (2) use of physical or chemical activating agents, and (3) inert atmospheres to avoid combustion. [22] Table 1 shows some of the most relevant studies reported on this type of carbons, its main synthesis conditions, textural properties, and electrochemical performance in Li−S batteries.
Table 1.
Production process, textural properties, and electrochemical behavior of biomass‐derived carbons from industrial treatments.
|
Biomass source |
Production process conditions |
Textural properties |
Electrochemical performance |
Ref. |
|||||||
|---|---|---|---|---|---|---|---|---|---|---|---|
|
T [°C] |
t [h] |
Activating agent |
Gas flow |
S BET [m2 g−1] |
V T [cm3 g−1] |
S loading [mg cm−2] |
Rate |
Capacity [mAh g−1] |
Cycle |
||
|
sawdust |
800 |
1 |
K2CO3 |
N2 |
2988 |
1.94 |
2.7 |
C/10 |
980 |
50th |
[23] |
|
rice husk |
900 |
– |
– |
Ar |
525 |
0.49 |
1.0 |
C/2 |
600 |
500th |
[24] |
|
rice straw |
800 |
3 |
KOH |
Ar |
1187 |
– |
1.2 |
2C |
584 |
500th |
[25] |
|
wheat straw |
800 |
2 |
KOH |
N2 |
3102 |
1.92 |
1.0–1.2 |
1C |
455 |
500th |
[26] |
|
soybean hull |
700 |
2 |
KOH |
N2 |
1232 |
0.54 |
1.5 |
C/2 |
450 |
200th |
[27] |
|
spent coffee |
800 |
12 |
– |
N2 |
1037 |
0.54 |
– |
C/5 |
474 |
400th |
[28] |
|
paper |
700 |
2 |
KOH |
Ar |
2970 |
1.4 |
2.0 |
1C |
540 |
200th |
[29] |
|
tobacco stem |
700 |
2 |
KOH |
N2 |
833 |
0.65 |
1.1 |
C/2 |
754 |
400th |
[30] |
|
brewing waste |
900 |
1 |
– |
N2 |
414 |
0.28 |
1.0 |
1C |
800 |
450th |
[31] |
|
WWTP (WL‐ACt4) |
350 |
4 |
– |
air |
569 |
0.35 |
2.0 |
1C |
410 |
350th |
this work |
|
WWTP (SL‐ACt3) |
250 |
3 |
– |
air |
606 |
0.35 |
2.0 |
1C |
646 |
350th |
this work |
In the few cases where activating agents are not used, such as rice husk, spent coffee, and brewing waste, temperatures above 800 °C are necessary to obtain carbons with appropriate textural properties to act as a sulfur matrix. Thus, high values of specific surface and pore volume are required of the carbons for this application, and the use of activating agents, such as potassium hydroxide or potassium carbonate, helps to fulfil this objective in the synthesis process. Likewise, the inert atmosphere with a stream of argon or nitrogen is an essential requirement to achieve the synthesis of activated carbon. These conditions and basic operations complicate the valorization process of biomass by‐products or residues to obtain suitable porous carbons for low‐cost and sustainable Li−S batteries.
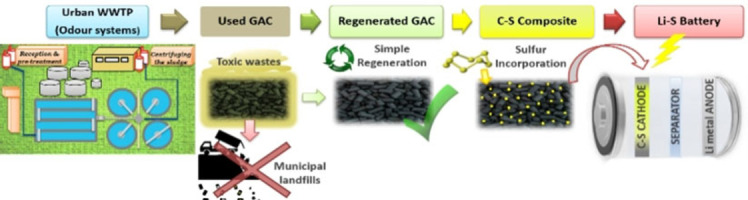
This work presents an activated carbon obtained by a simple, low‐cost, and sustainable process, which also does not involve high temperatures, inert flow, or the incorporation of chemical agents for its thermal regeneration, resulting in an effective material for use as an electrode matrix for Li−S batteries. Specifically, the selected material is a granular activated carbon (GAC) from the odor control system of an urban wastewater treatment plant (WWTP). After a certain time of use, the replacement of the GAC beds is necessary to ensure the correct functioning and effectiveness during the odor adsorption process. Regarding the fate of the contaminated GACs, it is worth noting that they are classified as hazardous industrial waste (code: 06 13 02) by the European Commission (2018), and therefore, they are transported and stored in landfills. [32] In this context, an environmental and ecological problem arises due to the accumulation of this waste from WWTP in garbage piles that, a priori, have not been used for other applications.
In the present study, for the first time, a second useful life was provided for carbon residue from WWTP through a simple thermal regeneration process. Herein, we report the electrochemical results obtained using regenerated activated carbons as a sulfur matrix. AC@S composites were prepared by an effective and easily scalable process, achieving electrodes with a high sulfur loading that demonstrated remarkable electrochemical performance. Within this framework, the results demonstrate an approach to not only reduce the accumulation of carbon residues from WWTP in landfills through a simple thermal regeneration process under oxidizing atmosphere, but also to revalue it in a new application as an effective component for Li−S cells. Therefore, the insights from this study are important for further development of sustainable cathodes applied to high‐performance Li−S batteries.
Results and Discussion
The structural properties of the samples were analyzed by X‐ray diffraction (XRD). Figure 1a, b compares the diffractograms of the pristine GAC (P‐AC) sample with the regenerated samples at different resting times, WL‐ACt and SL‐ACt, respectively. All samples present two dominant broad signals characteristic of activated carbons corresponding to reflection peaks (002) and (100) at 2θ values of 26 and 43°, respectively, which are attributed to the crystallographic planes of graphite (PDF #41‐1487). Additional peaks due to the presence of minor phases are observed, such as SiO2, Na2SO4, or CaO, which are formed after the regeneration process since silicon and sodium and calcium salts are present in the composition of the coconut shell itself, as confirmed by X‐ray fluorescence (XRF analyses are not shown). [33] In addition, activated carbons derived from the water line (WL‐ACt) contain more impurities than activated carbons derived from the sludge line (SL‐ACt), which is verified by the greater number of peaks present in their diffractogram that are associated with the phase of Na2SO4.
Figure 1.

XRD pattern of pristine GAC (P‐AC) compared to (a) WL‐ACtx (x=0, 1, 4, 5), and (b) SL‐ACtx (x=0, 1, 3, 5).
Figure 2 shows a summary of the textural properties of the different samples obtained by regeneration in an oxidizing atmosphere. After carrying out the nitrogen adsorption‐desorption isotherms of all the regenerated samples, different textural parameters were analyzed. The values of Brunauer‐Emmett‐Teller surface area (S BET) in blue, micropore area (S micro) in green, total pore volume (V T) in red, and micropore volume (V micro) in pink are represented in Figure 2. In the case of the WL‐ACtx sample, the best results were obtained after regeneration at 350 °C for 4 h, providing a surface area of 569 m2 g−1 and a total pore volume of 0.35 cm3 g−1. However, for the SL‐ACtx sample, the best characteristics were obtained after regeneration at 250 °C for 3 h, with the activated carbon acquiring a surface area of 606 m2 g−1 and a total pore volume of 0.35 cm3 g−1, the latter being the same value as for the previous sample (WL‐ACt4).
Figure 2.

Graphical representation of the textural properties (S BET, S micro, V T, V micro) of the WL‐ACtx (represented with a circle) and SL‐ACtx (represented with a triangle) samples for different regeneration times (0–5 h).
The shape of the isotherm obtained for each material provides information about the porosity of the solid. The profiles of the nitrogen adsorption and desorption isotherms corresponding to the selected samples (WL‐ACt4 and SL‐ACt3) are illustrated in Figure 3a. Both samples are attributed to type IV isotherms according to the BDDT (Brunauer‐Deming‐Deming‐Teller) classification, mainly mesoporous solid characteristics. [34] Furthermore, at intermediate relative pressure values, the samples show an increase in the amount adsorbed as observed by the hysteresis loop that appears in the isotherms, which is due to capillary condensation. However, the SL‐ACt3 sample at low relative pressure values has a shape that can be associated with a type I isotherm, indicating the presence of micropores. Thus, the slope of volume adsorbed at low relative pressures is higher for SL‐ACt3 than WL‐ACt4. After the incorporation of sulfur into the carbonaceous matrices, the samples were analyzed again using gas adsorption–desorption isotherms, confirming in both cases that the WL‐ACt4@S and SL‐ACt3@S samples belong to type II isotherms, that is, non‐porous samples. This result affirms the correct preparation of the composite samples.
Figure 3.

(a) Nitrogen (77 K) adsorption–desorption isotherms for WL‐ACt4 and SL‐ACt3 samples and their corresponding composites. (b) Pore size distribution by DFT of WL‐ACt4 and SL‐ACt3 activated carbons.
Figure 3b shows the pore size distribution by density functional theory (DFT) of the carbonaceous matrices. The WL‐ACt4 sample presents a porosity composed mostly of mesopores (2–50 nm), while the SL‐ACt3 sample contains a mixture of micro‐ (<2 nm) and mesopores.[ 35 , 36 ] These results corroborate the presence of micropores in the SL‐ACt3 sample, confirming the evidence deduced from Figure 3a.
Figure 4 shows thermogravimetric analysis (TGA) of the samples. Since the regeneration of the activated carbons was done in an oxidizing atmosphere, the TGA experiments for the WL‐ACt4 and SL‐ACt3 samples were carried out under a mixture of oxygen and nitrogen gases from room temperature to 900 °C at a heating rate of 10 °C min−1, as represented in Figure 4a,b, respectively. Both samples consist of 75 % by weight of C, but their thermal behavior is different because the thermal decomposition of the activated carbon from the water line begins around 350 °C and ends at 500 °C, while the sample from the sludge line decomposes at a lower temperature, starting around 250 °C. This variation is justified by the temperature limit that was set during the regeneration of both samples, which was 350 °C for the WL‐ACt4 sample and 250 °C for the SL‐ACt3 sample. The temperature limit for the regeneration of each sample was already explained in our previous work, [33] and it was due to the fact that the adsorbent from pretreatment header deodorization (WL) led to a mass loss of 25 % at 350 °C, while the adsorbent coming from sludge dewatering deodorization (SL) resulted in a higher mass loss at 350 °C, close to 80 % by weight.
Figure 4.

TGA curves for (a) WL‐ACt4 and WL‐ACt4@S samples and (b) SL‐ACt3 and SL‐ACt3@S samples. (c) DTG curves for WL‐ACt4@S and SL‐ACt3@S samples. (d) Deconvolution of DTG curves of the same composite samples.
The results obtained from the TGA measurements for the composite samples are also shown in Figure 4. These experiments were carried out under a nitrogen atmosphere, and for both the WL‐ACt4@S and SL‐ACt3@S samples, the presence of a 60 % by weight of sulfur was confirmed, corresponding to the mass ratio used in the preparation of composites by the wet ball milling route.
Additionally, the TG curves were processed by calculating their derivatives to analyze the loss of mass corresponding to sulfur. Figure 4c,d shows differential thermogravimetric curves (dW/dT, DTG) to obtain more information about the sulfur contained in the composites. In general, the sulfur environments can be classified into three categories depending on the temperature range: S outside the pore (30–280 °C), S inside the pore (280–400 °C), and S interacting with carbon (400–600 °C). [37] Focusing on Figure 4d, the deconvolution of the S peak is shown for the WL‐ACt4@S and SL‐ACt3@S samples. Two sulfur environments can be observed. In the WL‐ACt4@S sample, there is a greater amount of surface sulfur (red line around 245 °C, marked as “S Outside” in Figure 4d) than pore sulfur (green line around 280 °C, marked as “S Inside”), while the opposite occurs in the SL‐ACt3@S sample. Based on these results, the SL‐ACt3@S composite has a priori better characteristics for use as an electrode for Li−S batteries since most of the sulfur has been incorporated into the porosity of the carbonaceous matrix, making the dissolution of lithium polysulfides in the electrolyte more difficult, thus mitigating the shuttle effect.
The structural properties of the composite samples were studied by XRD and Raman spectroscopy. XRD measurements were also performed for the composites containing sulfur (Figure 5a). Intense and narrow diffraction peaks ascribed to the orthorhombic phase of sulfur (PDF #08‐0247) were observed. It should be noted that although most of the S is contained within the porosity of the carbonaceous matrix for the SL‐ACt3 sample, there is a certain excess of S that remains lodged on the surface. This fact justifies the presence of signals attributed to S orthorhombic in the XRD measurements. [38] Furthermore, in both diffractograms, it is possible to observe the two broad bands at 26 and 43° (2θ) corresponding to (002) and (100) reflections of amorphous carbon and disordered graphitic structure, respectively. The Raman spectra of the composite samples confirmed the presence of amorphous carbon and sulfur in the structure. The first signals to appear in the spectrum are associated with the Raman vibrations of S8 at room temperature and correspond to the bands at 471 (υ, a1+e2), 430 (υ, e3), 245 (δ, e3), 215 (δ, a1), and 150 (δ, e2) cm−1. [39] Advancing in the spectrum, two broad and intense bands appear at 1350 and 1599 cm−1, which correspond to the D and G bands of graphite, respectively. The degree of graphitization of the materials can be estimated by examining the relative intensity between the D band (for disordered carbons) and the G band (for graphitized carbons). [40] The intensity ratio (I D/I G) for the WL‐ACt4@S and SL‐ACt3@S composites is close to 1, which confirms the high degree of disorder in the samples.
Figure 5.

(a) XRD patterns and (b) Raman spectra of WL‐ACt4@S and SL‐ACt3@S composites; SEM images and elemental mapping of C and S for (c) WL‐ACt4@S and (d) SL‐ACt3@S composites.
Figure 5c,d shows scanning electron microscopy (SEM) images recorded at the same magnification for WL‐ACt4@S and SL‐ACt3@S samples, respectively. To the right of each SEM image, the results obtained from the elemental mapping of C (red) and S (green) for both images are collected. Comparing the analysis of both samples, clear differences can be observed. For the WL‐ACt4@S composite, a heterogeneous distribution of elements is observed on the surface of the particle chosen in the analysis. However, for the SL‐ACt3@S composite, the placement of the elemental components on the particle is uniformly distributed along the porous surface, indicating an effective incorporation of sulfur into the porosity of the carbonaceous‐based material. These results are in agreement with those obtained through the analysis and treatment of the TG data, where it was already possible to verify that the WL‐ACt4 sample had a greater amount of surface sulfur, while the SL‐ACt3 sample mainly presents sulfur located within the pores (Figure 4d).
After the characterization of the materials, the electrodes were prepared and the Li−S cells were assembled to study the electrochemical behavior of both composites. Sequentially, different electrochemical measurements in the potentiostatic and galvanostatic regime were performed.
In Figure 6a,b, cyclic voltammograms (CVs) at increasing scan rates from 0.1 to 1.0 mV s−1 of the WL‐ACt4@S and SL‐ACt3@S cathodes are shown, respectively. They were used to check the reversibility of the reaction of sulfur to short‐chain polysulfides, and vice versa. The CV data of both samples exhibit two cathodic (C1 and C2) and anodic peaks (A1 and A2). C1 between 2.1 and 2.4 V represents the cathodic reduction process of S8→Li2S x (3≤x≤8), and C2 between 1.7 and 2.1 V represents the cathodic reduction: Li2S x →Li2S2/Li2S (3≤x≤8). Similarly, during the charging process, the A1 peak appearing between 2.1 and 2.4 V represents the anodic oxidation process and corresponds to Li2S2/Li2S→Li2S x (3≤x≤8), while the corresponding A2 peak between 2.4 and 2.8 V is related to Li2S x (3≤x≤8)→S8+Li. A displacement of the anodic and cathodic peaks takes place towards lower potentials with increasing current density, implying a decrease in cell polarization and an increase in the participation of active materials in the redox reaction.
Figure 6.

(a, b) CV measurements performed at various scan rates (0.1, 0.2, 0.4, 0.8, and 1.0 mV s−1). (c, d) Linear fitting of the peak currents obtained from the voltammograms located above for Li/1 m LiTFSI(DOL/DME)/WL‐ACt4@S and Li/1 m LiTFSI(DOL/DME)/SL‐ACt3@S cells, respectively. LiTFSI: lithium bis(trifluoromethanesulfonyl)imide. DOL/DME: 1,3‐dioxolane/1,2‐dimethoxyethane.
Considering these four peaks (C1, C2, A1, and A2), the Randles–Sevcik equation was used to calculate the diffusion coefficient of Li+ (D Li +) in the WL‐ACt4@S‐based and SL‐ACt3@S‐based electrodes. Slope values when plotting I P versus ν 0.5 are fitted and calculated in Figure 6c,d. The Randles–Sevcik equation is as follows [Eq. 1]:
| (1) |
where I P is the peak current, n represents the electron number, A represents the electrode area, D Li is the Li ion diffusion coefficient, C Li is the Li ion concentration in the electrochemical reaction, and ν is the scan rate.
For WL‐ACt4@S, the values are: D Li(C1)=1.92 ⋅ 10−8 cm2 s−1, D Li(C2)=5.15 ⋅ 10−7 cm2 s−1, D Li(A1)=4.46 ⋅ 10−7 cm2 s−1, and D Li(A2)=1.30 ⋅ 10−8 cm2 s−1. For SL‐ACt3@S, the values are: D Li(C1)=4.13 ⋅ 10−8 cm2 s−1, D Li(C2)=3.52 ⋅ 10−7 cm2 s−1, D Li(A1)=5.30 ⋅ 10−8 cm2 s−1, and D Li(A2)=8.25 ⋅ 10−8 cm2 s−1. These values are comparable to those calculated in our previous works[ 41 , 42 ] and confirm that both cathodes can provide high capacity values during cycling.
Analyzing the electrochemical impedance spectroscopy (EIS) measurements recorded at open circuit voltage (OCV) and after 3 voltammetric cycles, more information was obtained on the electrochemical behavior of the cells. A two‐electrode setup is exploited, where Li metal performs as both the counter and reference electrodes. As shown in Figure 7a,b, the charge transfer resistance at OCV of the WL‐ACt4@S composite electrodes (R ct=129 Ω) is higher than the SL‐ACt3@S electrodes (R ct=36.4 Ω), indicating a lower electron conductivity. After several cycles of CV, a change in the semi‐circles can be observed, showing a pronounced decrease in the charge transfer resistance for the WL‐ACt4@S and SL‐ACt3@S electrodes, providing values of 12.56 and 4.18 Ω, respectively.
Figure 7.

Nyquist plots recorded by EIS at OCV of the cell and after 3 cycles of CV at 0.1 mV s−1 for (a) Li/1 m LiTFSI(DOL/DME)/WL‐ACt4@S and (b) Li/1 m LiTFSI(DOL/DME)/SL‐ACt3@S cells. The fitting results are shown together with the equivalent circuits in the inset for OCV and after the third CV cycle.
Focusing on Figure 7b, the behavior of the Li/1 m LiTFSI(DOL/DME)/SL‐ACt3@S cell is associated with an equivalent circuit of type R e(R1Q1)Q2, where R e is the electrolyte resistance that appears at high frequency and whose values are very similar for OCV and after CV (6.45 and 6.91 Ω, respectively). At medium‐high frequency and in series with Re, the element R1Q1 appears where a semicircle is observed and is assigned to the resistance (R1: 36.4 Ω for OCV and R1: 4.18 Ω after CV) and capacitance of the electrode/electrolyte interface (Q1), including the solid electrolyte interphase layer (SEI) formed on the surface electrodes. At the low‐frequency region, the last capacitive element (Q2) can explain the diffusion of lithium ions at the electrode/electrolyte interface.
Figure 8a,b shows the registered charge and discharge profiles for Li/1 m LiTFSI(DOL/DME)/WL‐ACt4@S and Li/1 m LiTFSI(DOL/DME)/SL‐ACt3@S cells, respectively. Both tests were carried out under the same conditions, that is, the cells were cycled during the first 5 cycles at a slow rate (C/10) as an activation step, and subsequently, the cycling was maintained at C/2 within a potential range of 1.8–2.6 V up to 150 cycles. In both cases, the profiles are very similar, showing two plateaus around 2.35 and 2.05 V at C/2 during the discharge process. Similarly, two plateaus are differentiated during the charging process at 2.25 and 2.45 V, confirming the reversibility of the electrochemical process.
Figure 8.

Discharge and charge profiles for (a) Li/1 m LiTFSI(DOL/DME)/WL‐ACt4@S and (b) Li/1 m LiTFSI(DOL/DME)/SL ACt3@S cells using a constant rate of C/2 for 150 cycles after activating the cells during the first 5 cycles at a rate of C/10 (1C=1672 mA g−1) within a potential range of 1.8–2.6 V vs. Li+/Li. Electrochemical performance of WL‐ACt4@S and SL‐ACt3@S cathodes (c) at C/2 for 150 cycles and (d) at a high rate of 1C during 350 cycles within a potential range of 1.8–2.6 V vs. Li+/Li.
Figure 8c,d shows the comparative electrochemical results between both cells when cycled at C/2 and 1C rates, respectively. At a moderate rate of C/2, an appropriate electrochemical behavior is shown for both materials, achieving a coulombic efficiency close to 100 % and good stability during 150 cycles (Figure 8c). The WL‐ACt4@S electrode provided average capacity values of 676.5 mAh g−1, while the SL‐ACt3@S electrode provided better performance, reaching an average capacity value of 842 mAh g−1. However, at a high rate of 1C, the behavior of both materials is different, as shown in Figure 8d. In this test, the WL‐ACt4@S electrode loses stability during cycling, starting with values of 575 mAh g−1 and decreasing its capacity to 410 mAh g−1 after 350 cycles. While the average capacity for the WL‐ACt4@S electrode is 506 mAh g−1, the value for the SL‐ACt3@S electrode is 698 mAh g−1, which is 27.5 % higher, with a capacity retention of 85.4 % after 350 cycles, demonstrating a very low capacity fading of only 0.042 % per cycle.
Figure 9 represents a graph in which the electrochemical results collected in Table 1 for different wastes used as a conductive cathode matrix for Li−S cells are compared. Li−S cells prepared with spent coffee were cycled at a slower rate of C/5. [28] The retention capacity of the electrochemical measurements for the coffee residue was also low (32.5 %). However, the textural properties obtained after the activation process were excellent, accommodating 80 % sulfur in the matrix. At the C/2 rate, three residues (rice husk, soybean hull, and tobacco stem) were cycled. After activating the soybean hull with KOH, [27] textural properties very similar to those of activated carbon derived from spent coffee were obtained. In this case, the composite had a load of almost 64 % sulfur, and the retention capacity was close to the previous residue, with values around 36.5 %. Rice husk [24] and tobacco stems [43] obtained retention capacity values of 72 and 67 %, respectively, similar to 71 % in the WL‐ACt4 sample, but the sulfur load per electrode in both cases was 1.0 mg cm−2, that is, half of that used for our Li−S cells. Although the wheat straw and paper residues were cycled at the same rate of 1C as the ACs studied in this work, to obtain these activated carbons, the use of KOH and carbonizations at high temperatures of 700–800 °C under an inert atmosphere (nitrogen or argon flow) were required. On the one hand, the electrochemical measurements for wheat straw were carried out during 500 cycles, obtaining a fading capacity per cycle of 0.088 % and working with a sulfur loading of 1.0–1.2 mg cm−2. [26] On the other hand, the results obtained for the paper working with a sulfur loading of 2.0 mg cm−2 had a fading capacity per cycle of 0.14 % after 200 cycles. [29] Although the results obtained were successful in the aforementioned works, the SL‐ACt3 sample managed to improve the cyclical stability at 1C for 350 cycles working with a sulfur load of 2.0 mg cm−2. The Li−S cells assembled with WL‐ACt4 and SL‐ACt3 achieved a retention capacity of 71 and 85.4 %, respectively. Furthermore, the fading capacity per cycle was 0.083 % for WL‐ACt4 and only 0.042 % for SL‐ACt3, confirming the excellent electrochemical performance provided by these residues from activated carbon used in the odor control systems of WWTPs.
Figure 9.

Electrochemical performance of WL‐ACt4@S and SL‐ACt3@S cathodes compared to other wastes used as a cathodic matrix.
The post‐mortem analysis of Li/1 m LiTFSI(DOL/DME)/WL‐ACt4@S and Li/1 m LiTFSI(DOL/DME)/SL‐ACt3@S cells are carried out inside an argon‐filled glovebox. Figure 10a, b makes it possible to compare the surface of both electrodes after cycling. Thus, it can be verified that for the WL‐ACt4 cathode, the chemical and electrochemical reactions at the interface caused more cracks with a more pronounced thickness than for the SL‐ACt3 cathode, which could explain why the Li/1 m LiTFSI(DOL/DME)/WL‐ACt4@S cell will show lower capacity values to the Li/1 m LiTFSI(DOL/DME)/SL‐ACt3@S cell in all electrochemical tests. The deterioration of the electrode surface and the appearance of cracks causes the sulfur to be less retained in the porosity of the carbonaceous matrix, putting the electrolyte in contact with more active material and favoring the shuttle effect. Furthermore, the dissolution of the polysulfides in the electrolyte entails an irreversible loss of active material and therefore, a decrease in the capacity that the cell is capable of supplying.
Figure 10.

SEM images post‐mortem for (a) WL‐ACt4@S and (b) SL‐ACt3@S electrodes at different magnifications. Scale bars: 100 μm (left) and 10 μm (middle and right).
Finally, to evaluate the adsorption capability of activated carbons, the lithium polysulfide adsorption measurements were carried out. Specifically, 5 mm of Li2S6 solution was prepared by mixing Li2S and S in anhydrous DME and DOL (1 : 1 v/v) in an Ar‐filled glovebox. [44] In the adsorption tests shown in Figure 11a, a 2 mL Li2S6 solution was added to 5 mg of WL‐ACt4 and SL‐ACt3 materials, respectively. Initially, the samples showed an orange coloration, but after 12 h of impregnation of Li2S6 with the different activated carbons, the solution gradually became discolored and had a light‐yellow color. At first glance, it can be confirmed that the SL‐ACt3 sample had a greater ability to adsorb polysulfides than the WL‐ACt4. However, UV/Vis measurements were performed to get a more accurate result of the adsorption behavior. As shown in Figure 11b, a broad band is observed between 190 and 450 nm relative to the absorption of lithium polysulfides.[ 45 , 46 , 47 , 48 ] Three characteristic peaks at 233, 264, and 280 nm correspond to the S6 2− species. After absorption for 12 h, color changes of the polysulfide solution with the WL‐ACt4 and SL‐ACt3 samples from light yellow to colorless were observed (inset of Figure 11b). To perform the absorbance measurements, all samples were diluted ten times.
Figure 11.

(a) Photographs showing the color changes of the Li2S6 solution (Li PS) after exposure to WL‐ACt4 and SL‐ACt3 for 12 h. (b) The UV/Vis spectra of the Li2S6 solution after absorption. The inserted photograph shows the dilutions that were analyzed by the absorbance measurements.
Conclusions
Cathodes for Li−S batteries were developed through a facile and efficient method that allows the activated carbons used in the odor systems of a wastewater treatment plant (WWTP) to be regenerated. The regeneration process of the contaminated granular activated carbon (GAC) consisted of carbonization at moderate temperatures of 250 and 350 °C without the need to use an inert gas stream, which reduces the cost of manufacturing. The sample from the head pre‐treatment point of the water line (WL) presented a lower electrochemical performance than the sample obtained from the sludge dewatering point of the sludge line (SL). The exhaustive analysis of both samples led us to the following conclusions:
The WL‐ACt4 sample is representative of the chemical adsorption of H2S; therefore, it has a higher proportion of impurities and requires a higher temperature and time for its regeneration than the SL‐ACt3 sample, which is representative of the physical adsorption of volatile organic compounds.
The textural properties obtained for both samples were similar, indicating an effective regeneration process. Although both were mainly mesoporous activated carbons, the SL‐ACt3 sample also contained micropores, which favor the adsorption of lithium polysulfides, as confirmed by absorption tests.
The WL‐ACt4@S and SL‐ACt3@S composites were successfully prepared by a simple wet milling method. The presence of sulfur was verified by various characterization techniques, such as X‐ray diffraction, Raman spectroscopy, scanning electron microscopy energy‐dispersive X‐ray spectroscopy (EDX), and thermogravimetric analysis (TGA). Thus, TGA revealed the existence of two different sulfur environments in the composites (inside and outside the pore). The sulfur deposited within the pores contributed to the high electrochemical activity and cycling stability, as verified by the Li−S cells prepared with the SL‐ACt3@S sample. In addition, by mapping the C and S elements by EDX, it was confirmed that the distribution of sulfur in the WL‐ACt4@S composite was more heterogeneous, and sulfur agglomerations that would be harmful during cycling were observed.
SL‐ACt3@S composite‐based cells provided lower charge transfer resistance and higher specific capacity than WL‐ACt4@S composite‐based cells. Furthermore, the stability was maintained for an appropriate number of cycles at different cycling rates.
Additionally, the post‐mortem study of the electrodes corroborated a higher quality in the materials from the sludge line because the surface of these electrodes suffered fewer alterations during the charge and discharge measurements in prolonged cycles.
Therefore, it can be concluded that the SL material after regeneration offered excellent characteristics for use as a cathodic matrix in Li−S batteries. Furthermore, this study contributes to reducing the amount of this type of waste in landfills by providing it with a new utility and promoting a sustainable and circular economy.
Experimental Section
GACs from WWTP
Commercial GACs from coconut shells and impregnated in NaOH are used as pristine GAC (P‐AC) in the odor adsorption process carried out in the urban wastewater plant of Seville (Spain). [32] During the deodorization process, GACs are used as adsorbent beds for odorants, such as volatile organic compounds (VOCs), mercaptans, ammonia, and hydrogen sulfide, among others. After a certain time of use, the porosity of the adsorbents is saturated with these compounds, and the GAC beds must be replaced. As previously mentioned, contaminated GACs are considered hazardous waste and destined for landfills. For this study, contaminated GACs were collected from two different points of the odor control system to regenerate them and turn them into a by‐product. Specifically, the treated samples were: (a) WL is a contaminated GAC sample from the head pre‐treatment point of the water line and (b) SL is a contaminated GAC sample from sludge dewatering point of the sludge line.
Thermal regeneration process
The contaminated WL and SL samples were subjected to a thermal regeneration process to transform them into WL‐AC and SL‐AC, respectively. [33] In general, the regeneration process was carried out in a tube furnace (Carbolite Gero CTF, Parsons Lane, Hope Valley, UK) using a constant flow of air. The heat treatment conditions were analyzed in this study, keeping the heating ramp at 15 °C min−1, selecting the target temperature of 350 °C for WL‐AC samples and 250 °C for SL‐AC samples, and varying the rest time at the set temperature. After the regeneration treatment, the samples were identified as WL‐ACtx or SL‐ACtx, where x is the value of the resting time maintained during heating (x=1, 2, 3, 4, or 5 h). The samples were weighed before and after the heat treatment to calculate the efficiency of the regeneration process. A schematic illustration of the thermal regeneration process is shown in Scheme 1.
Scheme 1.

Schematic diagram of the thermal regeneration and composites preparation processes.
Composites and cathodes preparation
The two composites studied (WL‐ACt4@S and SL‐ACt3@S) were prepared by grinding the corresponding AC and commercial sublimated sulfur in a 4 : 6 mass ratio using ethanol as a wetting agent in a Retsch PM100 planetary ball mill (Scheme 1). The wet milling conditions to achieve a homogeneous mixture were a rotation speed of 300 rpm for 3 h, including a rotation inversion every 15 min with a pause time of 5 min prior to each rotation inversion, as was demonstrated in our previous work. [49] After this process, the obtained product was dried at 50 °C overnight.
In the next stage, the positive electrodes were prepared by mixing the composites with polyvinylidene fluoride (PVDF 6020, binder, Solvay) and carbon Super P (conducting agent, Timcal) in a weight proportion of 80 : 10 : 10 in a manual agate mortar and adding 1‐methyl‐2‐pyrrolidone (Sigma Aldrich, 0.5 mL per 100 mg). The slurry was ground to the proper consistency and cast on a carbon cloth (GDL, ELAT LT1400 W) as an effective current collector by doctor blading to an areal sulfur loading of 2.0 mgs cm−2. [50] The electrodes were allowed to dry at ambient conditions, cut into circular discs of the desired size (13 mm in diameter), and dried again in a vacuum oven (Buchi, Flawil, Switzerland) at 45 °C for 3 h before transferring them to the Ar‐filled glovebox (M‐Braun 150, M‐Braun, Garching, Germany).
Materials characterization
XRD patterns were recorder on a BrukerD8 Discover A25 X‐ray diffractometer by using filtered CuKα radiation within a 2θ angle range between 10 and 80° at a rate of 1.05 s per step with a step size of 0.04° in continuous mode. Specific surface areas and total pore volumes were examined from the N2 adsorption–desorption isotherms using a Micromeritics ASAP 2020 M apparatus. The pore size distribution was calculated by the DFT method applied to the adsorption branch of the isotherms. The samples were previously outgassed under vacuum at 120 °C overnight. TGA was performed in a Mettler Toledo TGA/DSC (Mettler‐Toledo, Columbus, OH, USA) under a nitrogen or oxygen atmosphere and heating the samples from 30 to 900 °C at 10 °C min−1. Raman spectra were recorded in a Renishaw Raman instrument (InVia Raman Microscope) equipped with a Leica microscope and a Renishaw CCD Camera detector (578×400) using a spectral range of 100–2500 cm−1. A total of 10 scans per spectrum were acquired to improve the signal‐to‐noise ratio. The exposure time was 10 s, and the laser power was set at 0.5 % over the maximum provided using a green laser (532 nm) excitation source. The morphology of the powder and electrode was determined with a JEOL JSM‐7800F SEM equipped with EDX to analyze images of the surface topography. Finally, the absorption power of the samples was evaluated by UV/vis spectra recorded in a wavelength range of 190–600 nm with an UV/Vis double beam spectrophotometer (Zuzi model 4260/50) equipped with two detectors.
Cells assembly and electrochemical measurements
Li−S batteries were systematically assembled into CR2032 coin cells inside a glovebox with the previously prepared electrodes as the cathode and a lithium metal foil as the anode. The electrolyte was a mixture of DOL and DME (1 : 1, v/v) by dissolving 1 mol L−1 LiTFSI with 0.4 mol L−1 lithium nitrate (LiNO3) as an additive. A polyethylene membrane (PE, 25 μm thick, Celgard 2400) was used as a separator, and it was soaked in 50 μL of the electrolyte solution (electrolyte/sulfur ratios around 19 μL mgS −1).
The galvanostatic tests were carried out using an Arbin BT2143 potentiostat–galvanostat system within a voltage range of 1.8–2.8 V vs. Li+/Li. Specific capacity values are referred to the mass of elemental sulfur in the electrodes. CV curves and EIS spectra were recorded on an Autolab PGSTAT‐204 equipment. CV measurements were recorded at variable rates of 0.1, 0.2, 0.4, 0.8, and 1.0 mV s−1 between 1.8 and 2.8 V vs. Li+/Li. Impedance spectra were recorded at OCV condition and after the 5th CV cycle by applying an alternative voltage signal of 10 mV amplitude within the 500 kHz to 0.1 Hz frequency range.
Conflict of interest
The authors declare no conflict of interest.
Acknowledgements
This work was supported by the Spanish Ministry of Economy, Industry, and Competitiveness (MINECO), the Spanish State Research Agency (AEI) and the European Regional Development Fund (FEDER) through Projects CTM2017‐88723‐R, MAT2017‐87541‐R, PID2020‐113931RB−I00, and the Ministry of Education, Culture, and Sport of Spain (Grant FPU2016). The European Regional Development Fund (Project UCO‐FEDER‐1262384‐R) and the Chelonia Association (Mares Circulares Project) also supported the work. A.B. thanks the financial support from the European Social Fund and Junta de Andalucía. Also, the authors wish to acknowledge the technical staff from the University Institute of Nanochemistry (IUNAN) and the Central Service for Research Support (SCAI) of the University of Cordoba. Finally, we wish to express our gratitude to Juan Amaro‐Gahete for his contribution to this research by performing Raman spectroscopy measurements, and to Inmaculada Bellido and María Luisa López for their contribution to this research. Funding for open access charge: Universidad de Córdoba/CBUA
A. Benítez, P. Márquez, M. Á. Martín, A. Caballero, ChemSusChem 2021, 14, 3915.
References
- 1. Wujcik K. H., Wang D. R., Teran A. A., Nasybulin E., Pascal T. A., Prendergast D., Balsara N. P. in Electrochemical Engineering, Wiley, 2018, pp. 41–74. [Google Scholar]
- 2. He J., Manthiram A., Energy Storage Mater. 2019, 20, 55–70. [Google Scholar]
- 3. Yan Y., Xiaobo J., Hongjin F., Green Energy & Environ. 2018, 3, 1. [Google Scholar]
- 4. Zhu J., Zou J., Cheng H., Gu Y., Lu Z., Green Energy & Environ. 2019, 4, 345–359; Environ. 2019, 4, 345–359. [Google Scholar]
- 5. Li S., Zhang W., Zheng J., Lv M., Song H., Du L., Adv. Energy Mater. 2021, 11, 2000779. [Google Scholar]
- 6. Shin H., Baek M., Gupta A., Char K., Manthiram A., Choi J. W., Adv. Energy Mater. 2020, 10, 2001456. [Google Scholar]
- 7. Manthiram A., Fu Y., Su Y.-S., Acc. Chem. Res. 2013, 46, 1125–1134. [DOI] [PubMed] [Google Scholar]
- 8. Fan X., Sun W., Meng F., Xing A., Liu J., Green Energy & Environ. 2018, 3, 2–19; Environ. 2018, 3, 2–19. [Google Scholar]
- 9. Zhang L., Wang Y., Niu Z., Chen J., Carbon 2019, 141, 400–416. [Google Scholar]
- 10. Zhao J., Yang M., Yang N., Wang J., Wang D., Chem. Res. Chin. Univ. 2020, 36, 313–319. [Google Scholar]
- 11. Li M., Carter R., Douglas A., Oakes L., Pint C. L., ACS Nano 2017, 11, 4877–4884. [DOI] [PubMed] [Google Scholar]
- 12. Wang Q., Wang Z.-B., Li C., Gu D.-M., J. Mater. Chem. A 2017, 5, 6052–6059. [Google Scholar]
- 13. Yan Y., Shi M., Wei Y., Zhao C., Chen L., Fan C., Yang R., Xu Y., J. Nanopart. Res. 2018, 20, 260. [Google Scholar]
- 14. Wang J., Yang H., Chen Z., Zhang L., Liu J., Liang P., Yang H., Shen X., Shen Z. X., Adv. Sci. 2018, 5, 1800621. [DOI] [PMC free article] [PubMed] [Google Scholar]
- 15. Benítez A., Di Lecce D., Elia G. A., Caballero Á., Morales J., Hassoun J., ChemSusChem 2018, 11, 1512–1520. [DOI] [PubMed] [Google Scholar]
- 16. Benítez A., Di Lecce D., Caballero Á., Morales J., Rodríguez-Castellón E., Hassoun J., J. Power Sources 2018, 397, 102–112. [Google Scholar]
- 17. Imtiaz S., Zhang J., Zafar Z. A., Ji S., Huang T., Anderson J. A., Zhang Z., Huang Y., Sci. China Mater. 2016, 59, 389–407. [Google Scholar]
- 18. Wang M., Xia X., Zhong Y., Wu J., Xu R., Yao Z., Wang D., Tang W., Wang X., Tu J., Chem. Eur. J. 2019, 25, 3710–3725. [DOI] [PubMed] [Google Scholar]
- 19. Yan L., Yu J., Houston J., Flores N., Luo H., Green Energy & Environ. 2017, 2, 84–99; Environ. 2017, 2, 84–99. [Google Scholar]
- 20. Liu P., Wang Y., Liu J., J. Energy Chem. 2019, 34, 171–185. [Google Scholar]
- 21. Li Q., Liu Y., Wang Y., Chen Y., Guo X., Wu Z., Zhong B., Ionics 2020, 26, 4765–4781. [Google Scholar]
- 22. Yuan H., Liu T., Liu Y., Nai J., Wang Y., Zhang W., Tao X., Chem. Sci. 2019, 10, 7484–7495. [DOI] [PMC free article] [PubMed] [Google Scholar]
- 23. Schneidermann C., Kensy C., Otto P., Oswald S., Giebeler L., Leistenschneider D., Grätz S., Dörfler S., Kaskel S., Borchardt L., ChemSusChem 2019, 12, 310–319. [DOI] [PubMed] [Google Scholar]
- 24. Rybarczyk M. K., Peng H.-J., Tang C., Lieder M., Zhang Q., Titirici M.-M., Green Chem. 2016, 18, 5169–5179. [Google Scholar]
- 25. Zhang J., You C., Wang J., Guo S., Zhang W., Yang R., Fu P., ChemElectroChem 2019, 6, 5051–5059. [Google Scholar]
- 26. Chen F., Ma L., Ren J., Zhang M., Luo X., Li B., Song Z., Zhou X., Materials 2018, 11, 989. [DOI] [PMC free article] [PubMed] [Google Scholar]
- 27. Zhu Y., Xu G., Zhang X., Wang S., Li C., Wang G., J. Alloys Compd. 2017, 695, 2246–2252. [Google Scholar]
- 28. Kim B., Park J., Baik S., Lee J. W., J. Porous Mater. 2020, 27, 451–463. [Google Scholar]
- 29. Li L., Huang L., Linhardt R. J., Koratkar N., Simmons T., Sustain. Energy Fuels 2018, 2, 422–429. [Google Scholar]
- 30. Zhong M., Guan J., Sun J., Guo H., Xiao Z., Zhou N., Gui Q., Gong D., Electrochim. Acta 2019, 299, 600–609. [Google Scholar]
- 31. Tesio A. Y., Gómez-Cámer J. L., Morales J., Caballero A., ChemSusChem 2020, 13, 3439–3446. [DOI] [PubMed] [Google Scholar]
- 32. Márquez P., Benítez A., Caballero Á., Siles J. A., Martín M. A., Sci. Total Environ. 2021, 754, 142237. [DOI] [PubMed] [Google Scholar]
- 33. Márquez P., Benítez A., Hidalgo-Carrillo J., Urbano F. J., Caballero Á., Siles J. A., Martín M. A., Sep. Purif. Technol. 2021, 255, 117782. [Google Scholar]
- 34. Muttakin M., Mitra S., Thu K., Ito K., Saha B. B., Int. J. Heat Mass Transfer 2018, 122, 795–805. [Google Scholar]
- 35.Z. Ryu, J. Zheng, M. Wang, B. Zhang, Characterization of Pore Size Distributions on Carbonaceous Adsorbents by DFT, 1999.
- 36. Tseng R. L., J. Colloid Interface Sci. 2006, 303, 494–502. [DOI] [PubMed] [Google Scholar]
- 37. Suzuki K., Tateishi M., Nagao M., Imade Y., Yokoi T., Hirayama M., Tatsumi T., Kanno R., J. Electrochem. Soc. 2017, 164, A6178–A6183. [Google Scholar]
- 38. Zhang K., Zhao Q., Tao Z., Chen J., Nano Res. 2013, 6, 38–46. [Google Scholar]
- 39. Trofimov B. A., Sinegovskaya L. M., Gusarova N. K., J. Sulfur Chem. 2009, 30, 518–554. [Google Scholar]
- 40. Gómez-Urbano J. L., Gómez-Cámer J. L., Botas C., Rojo T., Carriazo D., J. Power Sources 2019, 412, 408–415. [Google Scholar]
- 41. Benítez A., Caballero A., Morales J., Hassoun J., Rodríguez-Castellón E., Canales-Vázquez J., Nano Res. 2019, 12, 759–766. [Google Scholar]
- 42. Benítez A., Marangon V., Hernández-Rentero C., Caballero Á., Morales J., Hassoun J., Mater. Chem. Phys. 2020, 255, 123484. [Google Scholar]
- 43. Zhong M. E., Guan J., Sun J., Guo H., Xiao Z., Zhou N., Gui Q., Gong D., Electrochim. Acta 2019, 299, 600–609. [Google Scholar]
- 44. Guo X., Li K., Bao W., Zhao Y., Xu J., Liu H., Wang G., Energy Technol. 2018, 6, 251–256. [Google Scholar]
- 45. Hou J., Tu X., Wu X., Shen M., Wang X., Wang C., Cao C., Pang H., Wang G., Chem. Eng. J. 2020, 401, 126141. [Google Scholar]
- 46. Wang X., Sun Z., Zhao Y., Li J., Zhang Y., Zhang Z., J. Solid State Electrochem. 2020, 24, 111–119. [Google Scholar]
- 47. Xia Y., Fang R., Xiao Z., Huang H., Gan Y., Yan R., Lu X., Liang C., Zhang J., Tao X., Zhang W., ACS Appl. Mater. Interfaces 2017, 9, 23782–23791. [DOI] [PubMed] [Google Scholar]
- 48. He J., Lv W., Chen Y., Xiong J., Wen K., Xu C., Zhang W., Li Y., Qin W., He W., J. Mater. Chem. A 2018, 6, 10466–10473. [Google Scholar]
- 49. Benítez A., Morales J., Caballero Á., Nanomaterials 2020, 10, 840. [DOI] [PMC free article] [PubMed] [Google Scholar]
- 50. Benítez A., Caballero Á., Rodríguez-Castellón E., Morales J., Hassoun J., ChemistrySelect 2018, 3, 10371–10377. [Google Scholar]