Abstract
Osteoarthritis (OA) is a common joint disease that ultimately causes physical disability and imposes an economic burden on society. Cartilage destruction plays a key role in the development of OA. Vorinostat is an oral histone deacetylase (HDAC) inhibitor and has been used for the treatment of T‐cell lymphoma. Previous studies have reported the anti‐inflammatory effect of HDAC inhibitors in both in vivo and in vitro models. However, it is unknown whether vorinostat exerts a protective effect in OA. In this study, our results demonstrate that treatment with vorinostat prevents interleukin 1α (IL‐1α)‐induced reduction of type II collagen at both gene and protein levels. Treatment with vorinostat reduced the IL‐1α‐induced production of mitochondrial reactive oxygen species (ROS) in T/C‐28a2 cells. Additionally, vorinostat rescued the IL‐1α‐induced decrease in the expression of the collagen type II a1 (Col2a1) gene and the expression of Sry‐related HMG box 9 (SOX‐9). Importantly, we found that vorinostat inhibited the expression of matrix metalloproteinase‐13 (MMP‐13), which is responsible for the degradation of type II collagen. Furthermore, vorinostat suppressed the expression of E74‐like factor 3 (ELF3), which is a key transcription factor that plays a pivotal role in the IL‐1α‐induced reduction of type II collagen. Also, the overexpression of ELF3 abolished the protective effects of vorinostat against IL‐1α‐induced loss of type 2 collagen by inhibiting the expression of SOX‐9 whilst increasing the expression of MMP‐13. In conclusion, our findings suggest that vorinostat might prevent cartilage destruction by rescuing the reduction of type II collagen, mediated by the suppression of ELF3.
Keywords: chondrocytes, ELF3, osteoarthritis, type II collagen, vorinostat
1. INTRODUCTION
Osteoarthritis (OA) is a common degenerative joint disease, affecting millions of people worldwide, especially the population over the age of 65 years.[ 1 ] The clinical symptoms of OA include pain, swelling, tenderness, and deformity of the joints. The occurrence of OA is associated with multiple risk factors, such as injury, obesity, genetics, and age.[ 2 , 3 , 4 , 5 ] The pathogenesis of OA is complex. Studies have demonstrated that chondrocyte dysfunction and chronic inflammation are closely related to OA, leading to cartilage destruction.[ 6 ] The articular extracellular matrix (ECM) is mainly comprised of type II collagen and aggrecan. Chondrocytes are the main components of cartilage tissue. In normal conditions, chondrocytes contribute to the regulation of the metabolism of articular ECM by secreting substances such as enzymes and signaling molecules.[ 7 ] However, in the condition of OA, chondrocytes lose the function of maintaining cartilage homeostasis and instead release various inflammatory factors, including proinflammatory cytokines, chemokines, and matrix‐degrading enzymes, such as IL‐1α, interleukin 1β (IL‐1β), IL‐6, and matrix metalloproteinases (MMPs), resulting in inflammation and cartilage destruction. IL‐1α is one of the most important proinflammatory cytokines belonging to the IL‐1 family and plays a key role in the development of inflammatory diseases.[ 8 ] Also, studies have demonstrated that IL‐1α could induce the state of oxidative stress and inflammatory response in chondrocytes. Meanwhile, SOX‐9, an important transcriptional factor that is responsible for the transcription of the type II collagen (Col2a1) gene, is downregulated significantly in the activated chondrocytes.[ 9 ] E74‐like factor 3 (ELF3) is a member of the E26 transformation‐specific sequence (ETS) family of transcription factors.[ 10 ] Although ELF3 is defined as an epithelium‐specific transcription factor, increasing evidence has indicated that ELF3 plays a critical role in the development of OA, including upregulating the expression of MMP‐13, which is a key enzyme responsible for the degeneration of type II collagen, leading to the degeneration of articular ECM.[ 11 ] Inhibition of ELF3 has been an important strategy for the treatment of OA.
Histone deacetylases (HDACs) are a family of proteases that play an important role in the regulation of gene expression.[ 12 ] Previous studies have demonstrated that HDACs mediate the deacetylation of histone, resulting in repression of gene expression.[ 12 , 13 ] Abnormal activity of HDACs is closely associated with cancer, and a recent study demonstrated that the knockdown of HDACs can induce a series of antineoplastic effects, such as inhibiting the proliferation of tumor cells, inducing apoptosis, differentiation, and disrupting angiogenesis.[ 14 ] Therefore, HDAC inhibition has been considered a therapeutic target for the treatment of cancers and related diseases. Furthermore, an HDAC inhibitor was found to have an inhibitory effect on the expression of proinflammatory cytokines, chemokines, and other inflammatory factors that are responsible for various inflammatory diseases.[ 15 , 16 , 17 ] Vorinostat is an oral HDAC inhibitor that was approved by the FDA for the treatment of cutaneous T‐cell lymphoma in 2006.[ 18 ] The molecular structure of vorinostat is shown in Figure 1A. It is unknown whether vorinostat exerts a protective effect in OA; however, based on the potential protective effects of the HDAC inhibitor mentioned above, in this study, we attempted to investigate the beneficial effect of vorinostat against IL‐1α‐induced inflammatory insults and impairment of type II collagen in human T/C‐28a2 chondrocytes and elucidate the underlying mechanisms.
FIGURE 1.
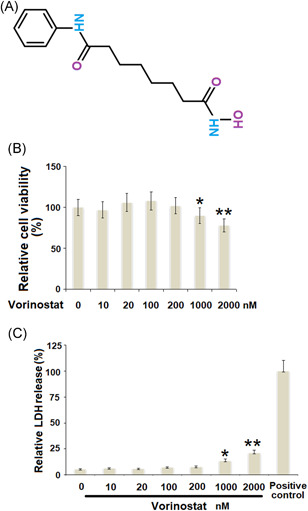
Effects of vorinostat on cytotoxicity in human T/C‐28a2 cells. (A). Molecular structure of vorinostat. (B). Cells were stimulated with vorinostat at the concentrations of 0, 10, 20, 100, 200, 1000, and 2000 nM for 24 h. Cell viability was measured using the MTT assay (C). Cells were stimulated with vorinostat at the concentrations of 0, 10, 50, 100, 200, 1000, and 2000 nM for 24 h. LDH release was measured using a commercial kit with the 0.1% Triton X‐100 treatment group as a positive control (N = 5–6, *p < 0.05, **p < 0.01 vs. the vehicle group). LDH, lactate dehydrogenase; MTT, 3‐(4,5‐dimethylthiazol‐2‐yl)‐2,5‐diphenyltetrazolium bromide
2. MATERIALS AND METHODS
2.1. Cell culture and treatment
This study was carried out in accordance with the Principle of World Medical Association Declaration of Helsinki Ethical Principles for Medical Research Involving human subjects, and the use of human cell line T/C‐28a2 is only for research purposes. The T/C‐28a2 chondrocyte line was cultured with modified Eagle's medium (DMEM)/Ham's F‐12 (1:1; Gibco) supplemented with 10% fetal calf serum, 1% glutamine, 50 μg/ml ascorbate, 100 units/ml penicillin, and 50 μg/ml streptomycin. The cells were cultured either in a T‐75 cell culture flask or a six‐well plate unless specially indicated, and the medium was changed every 3–4 days. For cell treatment, vorinostat was purchased from Sigma‐Aldrich (cat #SML0061), and IL‐1α was purchased from R&D Systems (cat # 200‐LA). A total of 5 ng/ml IL‐1α was used to activate chondrocytes based on a previous report.[ 19 ] The concentration of vorinostat was referred to the previous studies in human peripheral blood mononuclear cells and lung fibroblasts.[ 20 , 21 ] For the experiential purpose, the cells were treated with 5 ng/ml IL‐1α in the presence or absence of vorinostat (100, 200 nM) for 24 h.
2.2. 3‐(4,5‐Dimethylthiazol‐2‐yl)‐2,5‐diphenyltetrazolium bromide (MTT) assay
T/C‐28a2 cells were plated into a 96‐well plate at the density of 5 × 10⁴/well; 100 μl of DPBS was added as a blank control. The cells were then treated with vorinostat at different concentrations (0, 10, 50, 100, 500, 1000, and 2000 nM) for 24 h. Then, 20 μl of MTT (5 mg/ml) (Sigma‐Aldrich) was added and incubated for 4 h. A total of 100 μl of MTT solvent dimethyl sulfoxide solution was then directly added to the culture. The plate was read at 590 nm with a reference filter of 620 nm. The data were normalized to the reference value and presented as fold change.
2.3. Lactate dehydrogenase (LDH) release determination
The cytotoxicity was measured using an LDH assay kit (Thermo Fisher Scientific) following the manufacturer's manual. The T/C‐28a2 cells were cultured in a 96‐well plate and treated as mentioned above and then the supernatant of each well was collected and centrifuged at 2000g for 20 min. The absorbance value of the samples was read at a wavelength of 490 nm, and all the values of % LDH released were normalized to the control.
2.4. Mitochondrial ROS
Mitochondrial ROS in T/C‐28a2 cells was determined using MitoSOX Red staining (Cat#M36008; Thermo Fisher Scientific). Briefly, the cells were cultured in the chamber slides. After the specified treatment, cells were incubated with 5 μM MitoSOX for 10 min at 37°C in the dark. The mitochondrial ROS images were visualized using a fluorescent microscope. The level of mitochondrial ROS was analyzed using Image J software (NIH). Ten regions of interest were randomly selected for each group, and an average level of mitochondrial ROS was determined based on the integrated density value of the regions normalized by the number of cells in the regions.
2.5. Real‐time polymerase chain reaction (PCR) analysis
Total RNA from T/C‐28a2 cells were isolated with the Qiazol (Qiagen) and quantified using nanodrop2000 (Thermo Fisher Scientific). Two microgram of isolated RNA was used to synthesize complementary DNA (cDNA) using a QuantiTect Reverse Transcription Kit (205311; Qiagen). Real‐time PCR was performed using SYBR Green I master mix with specific gene primers and synthesized cDNA on a LightCycler 480 PCR machine (Roche). The expression levels of target genes were calculated using the method and normalized to GAPDH. The following primers were used:
Col2a1: F: 5ʹ‐AATTCCTGGAGCCAAAGGAT‐3ʹ, R: 5ʹ‐AGGACCAGTTGCACCTTGAG‐3ʹ; Sox‐9: 5ʹ‐AGGAAGCTCGCGGACCAGTAC‐3ʹ, R: 5ʹ‐GGTGGTCCTTCTTGTGCTGCAC‐3ʹ; MMP‐13: F: 5ʹ‐CTTGATGCCATTACCAGTC‐3ʹ, R: 5ʹ‐GGTTGGGAAGTTCTGGCCA‐3ʹ; ELF3: F: 5ʹ‐CAACTATGGGGCCAAAAGAA‐3ʹ, R: 5ʹ‐TTCCGACTCTGGAGAACCTC‐3ʹ; GAPDH: 5ʹ‐CATCAAGAAGGTGGTGAAGCAG‐3ʹ, R: 5ʹ‐CGTCAAAGGTGGAGG AGTGG‐3ʹ.
2.6. Western blot analysis
TC‐28a2 cells were lysed using RIPA buffer with protease inhibitor cocktails (Roche). A total of 30–50 μg of protein was then separated by a gradient 8%–12% sodium dodecyl sulphate polyacrylamide gel electrophoresis gel and transferred onto polyvinylidene fluoride membranes. After blocking with 5% slim milk for an hour, the membranes were loaded with specific primary antibodies overnight at 4°C. The following antibodies were used to detect the corresponding proteins: SOX‐9 (1:1000; Abcam), type II collagen (1:2000; Abcam), ELF3 (1:1000; Abcam), and β‐actin (1:10,000; Abcam), followed by incubation with appropriate secondary antibodies. The membrane was then exposed to the SuperSignal West Pico Chemiluminescent Substrate (Thermo Fisher Scientific) and visualized by autoradiography.
2.7. Enzyme‐linked immunosorbent assay (ELISA)
T/C‐28a2 cells were plated into a 96‐well flat‐bottom plate. Cells were stimulated with 5 ng/ml IL‐1α in the presence or absence of vorinostat (100, 200 nM) for 24 h. The supernatant from the cell growth media was collected and centrifuged to obtain protein samples. The levels of tumour necrosis factor α (TNF‐α), IL‐6, and MMP‐13 were determined using the commercial ELISA kits (R&D Systems). The reaction was performed according to the manufacturer's protocol.
2.8. Statistical analyses
The data was displayed as mean ± SD. The data were analyzed using analysis of variance with Bonferroni's posthoc test. All testing was performed using GraphPad Prism 6 software. The p values <0.05 were considered significant.
3. RESULTS
3.1. Effects of vorinostat on cytotoxicity in human T/C‐28a2 cells
Cells were treated with vorinostat at concentrations of 0, 10, 20, 100, 200, 1000, and 2000 nM for 24 h. As shown in Figure 1B, when the concentration of vorinostat increased from 0 to 200 nM, no significant difference was observed. However, cell viability reduced markedly when the concentration of vorinostat was higher than 200 nM. Similarly, the results in Figure 1C show that when the concentration of vorinostat was higher than 200 nM, LDH release increased markedly. Therefore, 100 and 200 nM of vorinostat were used for this study.
3.2. Vorinostat reduced IL‐1α‐ induced production of mitochondrial ROS, IL‐6, and TNF‐α in human T/C‐28a2 cells
To evaluate the effect of vorinostat on IL‐1α‐ induced oxidative stress, we measured the generation of mitochondrial ROS. As shown in Figure 2A, IL‐1α‐ induced a 3.2‐fold increase in ROS, which was reduced to 2.3‐ and 1.7‐fold by 100 and 200 nM vorinostat, respectively. We then examined the effects of vorinostat on IL‐1α‐induced production of IL‐6 and TNF‐α in T/C‐28a2 chondrocytes. IL‐1α increased the secretion of IL‐6 from 93.2 to 263.8 pg/ml, which was rescued to 182.3 and 155.7 pg/ml by 100 and 200 nM vorinostat, respectively. Consistently, IL‐1α increased the secretion of TNF‐α from 51.7 to 116.1 pg/ml, which was reduced to 87.9 and 72.7 pg/ml by 100 and 200 nM vorinostat, respectively.
FIGURE 2.
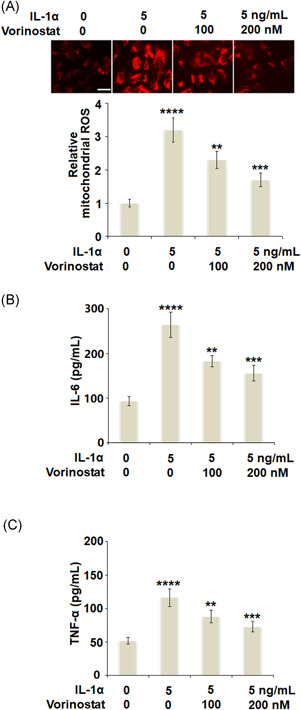
Vorinostat reduced IL‐1α‐induced production of mitochondrial ROS, IL‐6, and TNF‐α in human T/C‐28a2 cells. Cells were stimulated with 5 ng/ml IL‐1α in the presence or absence of vorinostat (100 and 200 nM) for 24 h. (A). The level of mitochondrial ROS was assayed using MitoSOX Red. Scale bar = 100 μm (B). Level of IL‐6 measured by ELISA (C). Level of TNF‐α measured by ELISA (N = 5, ****p < 0.001 versus the vehicle group; **p < 0.01, ***p < 0.005 vs. the IL‐1α group). ELISA, enzyme‐linked immunosorbent assay; IL, interleukin; ROS, reactive oxygen species; TNF‐α, tumour necrosis factor α
3.3. Vorinostat prevented an IL‐1α‐ induced decrease in the expressions of the Col2a1 gene and that of SOX‐9 in human T/C‐28a2 cells
As shown in Figure 3A, stimulation with IL‐1α significantly reduced the expression of Col2a1 to 56%, which was rescued to 75% and 93% by 100 and 200 nM vorinostat, respectively. Additionally, we further measured the effect of vorinostat on the expression of SOX‐9. The results in Figure 3B show that IL‐1α‐ induced an approximate 50% decrease in SOX‐9 at the messenger RNA (mRNA) level. Meanwhile, the two doses of vorinostat increased the mRNA levels of SOX‐9 to 72% and 90%, respectively. As expected, the results in Figure 3C show that the same doses of vorinostat rescued the protein levels of SOX‐9 to 81% and 95%, respectively, compared with a decrease of 63% by exposure to IL‐1α only.
FIGURE 3.
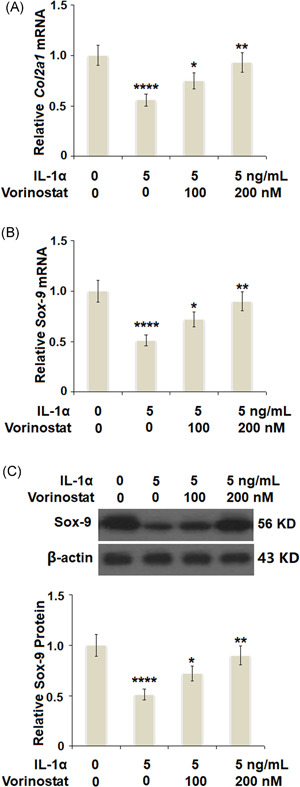
Vorinostat prevented IL‐1α‐induced decrease in the expression of Col2a1 gene and the expression of SOX‐9 in human T/C‐28a2 cells. Cells were stimulated with 5 ng/ml IL‐1α in the presence or absence of vorinostat (100, 200 nM) for 24 h. (A) mRNA of Col2a1 as measured by real‐time PCR. (B) mRNA of SOX‐9 as measured by real‐time PCR. (C) Protein of Sox‐9 as measured by western blot analysis (N = 5, ****p < 0.001 vs. the vehicle group; **p < 0.05, ***p < 0.01 vs. the IL‐1α group). Col2a1, collagen type II a1; IL, interleukin; mRNA, messenger RNA; PCR, polymerase chain reaction
3.4. Vorinostat prevented IL‐1α‐ induced degradation of type II collagen and the expression of MMP‐13 in human T/C‐28a2 cells
We then investigated the effects of vorinostat on the protein level of type II collagen and the expression of MMP‐13. As shown in Figure 4A, IL‐1α decreased the protein level of type II collagen to 57%, which was rescued to 76% and 94% by 100 and 200 nM of vorinostat, respectively. The results in Figure 4B,C show that IL‐1α exerted a strong effect toward increasing the expression of MMP‐13 at both the mRNA and protein levels. However, the same doses of vorinostat significantly inhibited the expression of MMP‐13 in a dose‐dependent manner.
FIGURE 4.
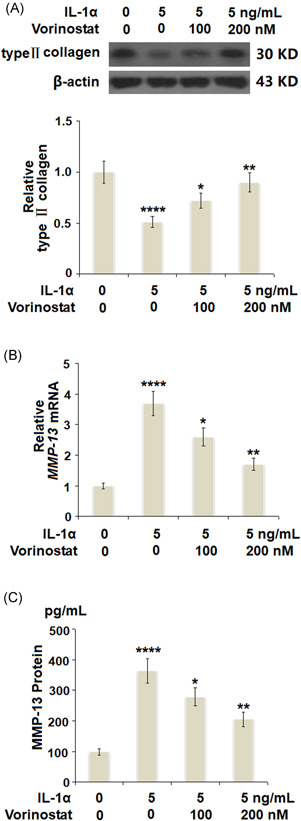
Vorinostat prevented IL‐1α‐induced degradation of type Ⅱ collagen and the expression of MMP‐13 in human T/C‐28a2 cells. Cells were stimulated with 5 ng/ml IL‐1α in the presence or absence of vorinostat (100 and 200 nM) for 24 h. (A) Levels of type Ⅱ collagen were measured by western blot analysis. (B) mRNA of MMP‐13. (C) Protein of MMP‐13 as measured by ELISA (N = 5, ****p < 0.001 vs. the vehicle group; **p < 0.05, ***p < 0.01 vs. the IL‐1α group). ELISA, enzyme‐linked immunosorbent assay; IL, interleukin; MMP‐13, matrix metalloproteinase 13; mRNA, messenger RNA
3.5. Vorinostat prevented IL‐1α‐induced increase in the expression of ELF3 in human T/C‐28a2 cells
ELF3 is a transcriptional factor and plays a pivotal role in the development of OA. Previous studies have demonstrated that proinflammatory cytokines could increase the expression of ELF3. In this study, the results in Figure 5A,B show that treatment with IL‐1α significantly increased the expression of ELF3 at both the mRNA and protein levels in a dose‐dependent manner. We then investigated whether treatment with vorinostat exerted protective effects against IL‐1α‐induced increase in the expression of ELF3. As shown in Figure 6A, treatment with IL‐1α induced a 2.7‐fold increase in ELF3 at the mRNA level, which was reduced to 2.1‐ and 1.6‐fold by 100 and 200 nM vorinostat, respectively. Similarly, the protein level of ELF3 was reduced to 1.9‐ and 1.5‐fold by the same doses of vorinostat, respectively, compared with an increase of 2.5‐fold by exposure to IL‐1α only.
FIGURE 5.
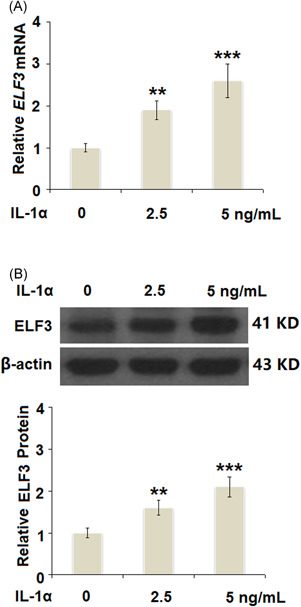
IL‐1α increased the expression of ELF3 in a dose‐dependent manner in human T/C‐28a2 cells. Cells were stimulated with IL‐1α at the concentrations of 2.5 and 5 ng/ml for 24 h. (A). mRNA of ELF3 (B). Protein of ELF3 (N = 5, **p < 0.01, ***p < 0.005 vs. the vehicle group). ELF3, E74‐like factor 3; IL, interleukin; mRNA, messenger RNA
FIGURE 6.
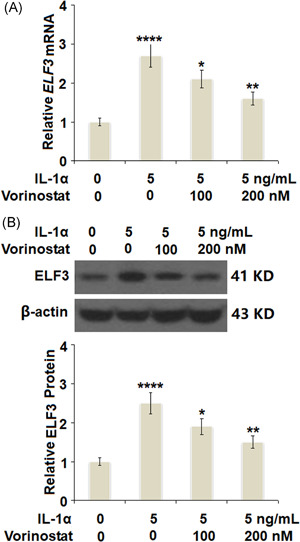
Vorinostat prevented IL‐1α‐induced increase in the expression of ELF3 in human T/C‐28a2 cells. Cells were stimulated with 5 ng/ml IL‐1α in the presence or absence of vorinostat (100, 200 nM) for 24 h. (A) mRNA of ELF3. (B) Protein of ELF3 (N = 5, ****p < 0.001 vs. the vehicle group; **p < 0.05, ***p < 0.01 vs. the IL‐1α group). ELF3, E74‐like factor 3; IL, interleukin; mRNA, messenger RNA
3.6. Overexpression of ELF3 abolished the protective effects of vorinostat against an IL‐1α‐induced decrease in the expression of the Col2a1 gene and that of SOX‐9
To further investigate whether the protective effects of vorinostat against IL‐1α are mediated by inhibiting ELF3, cells were transfected with 50 ng of plasmids encoding human ELF3. Successful overexpression of ELF3 is shown in Figure 7A. The results in Figure 7B show that vorinostat rescued the expression of the Col2a1 gene to 98%, compared with a 54% decrease by exposure to IL‐1α only. However, the expression of the Col2a1 gene was reduced to only 49% in the cells overexpressing ELF3. Similarly, the results in Figure 7C,D show that the effect of vorinostat on the expression of SOX‐9 was abolished by overexpression of ELF3.
FIGURE 7.
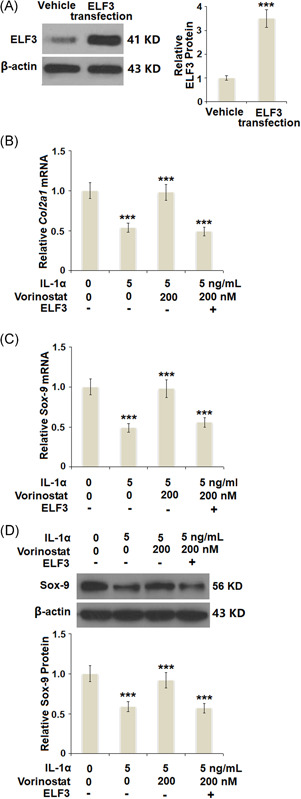
Overexpression of ELF3 abolished the protective effects of vorinostat against IL‐1α‐induced decrease in the expression of the Col2a1 gene and the expression of SOX‐9. Cells were transfected with 50 ng of expression vector encoding human ELF3, followed by stimulation with 5 ng/ml IL‐1α in the presence or absence of vorinostat (200 nM) for 24 h. (A) Western blot analysis revealed successful overexpression of ELF3. (B) Expression of the Col2a1 gene. (C) mRNA of SOX‐9. (D) Protein of Sox‐9 (N = 4 or 5, ***p < 0.005 vs. the previous column group). Col2a1, collagen type II a1; ELF3, E74‐like factor 3; IL, interleukin; mRNA, messenger RNA
3.7. Overexpression of ELF3 abolished the protective effects of vorinostat against IL‐1α‐ induced degradation of type II collagen and the expression of MMP‐13
As shown in Figure 8A, vorinostat rescued the protein level of type II collagen to 91%, compared with a decrease of 53% induced by IL‐1α. However, overexpression of ELF3 reduced the protein level of type II collagen to only 61% in the presence of vorinostat. Moreover, the results in Figure 8B,C show that the inhibitory effects of vorinostat against IL‐1α‐induced expression of MMP‐13 were abolished by overexpression of ELF3.
FIGURE 8.
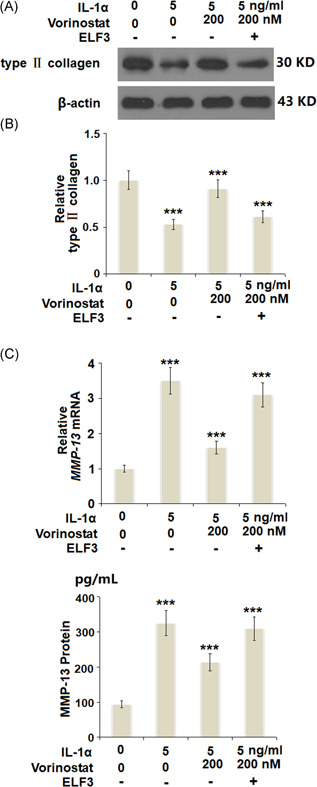
Overexpression of ELF3 abolished the protective effects of vorinostat against IL‐1α‐induced degradation of type 2 collagen and the expression of MMP‐13. Cells were transfected with 50 ng of an expression vector encoding human ELF3, followed by stimulation with 5 ng/ml IL‐1α in the presence or absence of vorinostat (200 nM) for 24 h. (A) Protein levels of type 2 collagen. (B) mRNA of MMP‐13. (C) Protein of MMP‐13 as measured by ELISA (N = 5, ***p < 0.005 vs. the previous column group). Col2a1, collagen type II a1; ELF3, E74‐like factor 3; ELISA, enzyme‐linked immunosorbent assay; IL, interleukin; MMP‐13, matrix metalloproteinase 13
4. DISCUSSION
OA is a complex degenerative joint disorder that involves chondrocyte dysfunction and chronic inflammation leading to cartilage degradation and ultimately deformity of the joints, and even disability. Type II collagen is the main component of articular ECM and is responsible for its structure and function. Excessive destruction of type II collagen is the main cause of cartilage degradation and is an irreversible progression. Therefore, in this study, we investigated the protective effects of vorinostat on the expression of type II collagen at both mRNA and protein levels. Furthermore, we elucidated the involvement of several important transcription factors such as SOX‐9 and ELF3 to explore the underlying mechanism. ROS are oxygen‐containing free radicals produced in metabolic and physiological processes. In healthy conditions, a low level of ROS has been considered as the intracellular second messenger by regulating the expression of various gene factors, such as proinflammatory cytokines, chemokines, and MMPs, to maintain cellular homeostasis and function.[ 22 , 23 ] However, in pathological conditions, elevated generation of ROS changes the oxidative/antioxidative balance to oxidative status. When the imbalance is great enough to change cell functions, it is called “oxidative stress,” which plays essential roles in a variety of diseases including OA.[ 24 ] Overproduction of ROS and oxidative stress have been found in patients with OA.[ 25 , 26 ] It has been reported that ROS could induce chondrocyte apoptosis.[ 27 ] The chondrocyte is the only cell type in cartilage tissue and is responsible for the production of type II collagen. As chondrocytes lack a self‐renewal capacity, abnormal chondrocyte apoptosis reduces the production of type II collagen. Furthermore, ROS can cause damage to type II collagen directly by attacking the amino acids and lipid chains of collagen and changing its primary structure.[ 28 ] Importantly, overproduction of ROS may indirectly affect the reduction of type II collagen, such as by upregulating the activity of NF‐κB to promote the production of proinflammatory cytokines and collagenases, which further destroy the articular ECM.[ 29 , 30 ] In the past decades, increasing evidence has shown that HDAC inhibitors exert protective effects on OA. For example, trichostatin could inhibit the synthesis of nitric oxide and prostaglandin E2 (PGE2) and prevent chondrocyte apoptosis.[ 31 , 32 ] In this study, we found that vorinostat has a strong inhibitory effect on IL‐1α‐induced oxidative stress by suppressing the production of ROS.
MMP‐13, also known as collagenase‐3, is a member of the MMP family, which is recognized as zinc‐dependent endopeptidases that degrade various components of the ECM and basement membrane.[ 33 , 34 ] Compared with other collagenases, MMP‐13 is more specific and potent in breaking down type II collagen in cartilage, leading to resultant joint destruction.[ 35 ] Therefore, the excessive production of MMP‐13 is closely related to the progression of OA. Recent studies have reported that vorinostat could reduce the expression of MMPs in several in vitro models.[ 36 , 37 ] These findings demonstrate the close relationship between vorinostat and MMPs, and led us to measure the effects of vorinostat on MMP‐13 in OA chondrocytes. Our results show that treatment with vorinostat significantly suppresses the IL‐1α‐induced overexpression of MMP‐13 at both mRNA and protein levels to rescue the protein of type II collagen. SOX‐9 is a key transcription factor in cartilage tissue; its expression is important for chondrogenesis and chondrocyte survival.[ 38 ] A recent study showed that blockade of SOX‐9 with siRNA reduced the expression of type II collagen (Col2a1) at both mRNA and protein levels,[ 39 ] while IL‐1β stimulation inhibits COL2A1 gene expression by suppressing SOX‐9 promoter activity in chondrocytes.[ 40 ] In the current study, we found a significant decrease in SOX‐9 induced by IL‐1α, resulting in the suppression of type II collagen at the gene level, which was rescued by the two doses of vorinostat, in a dose‐dependent manner. Finally, we investigated the involvement of ELF3. ELF3 has been considered a notable transcription factor by modulating inflammatory responses in joint diseases such as OA and rheumatoid arthritis by regulating genes of cytokines, chemokines, and enzymes.[ 41 , 42 ] In chondrocytes, the expression of ELF3 can be induced by proinflammatory cytokines such as IL‐1α. Researchers found that ELF3 activates MMP‐13 transcription by binding to a conserved ETS site in its proximal promoter region and then upregulates MMP‐13 expression. Furthermore, they showed evidence that the knockdown of ELF3 abolished the increase in MMP‐13 expression induced by IL‐1β.[ 43 ] In addition, our results demonstrate that the overexpression of ELF3 impaired the inhibitory effect of vorinostat on MMP‐13. Importantly, a recent study demonstrated that ELF3 not only directly interacts with the high‐mobility group (HMG) domain of SOX‐9 but it also represses COL2A1 promoter activity by inhibiting SOX‐9‐ and CBP/p300‐mediated HAT activity. Consistently, our results indicate that overexpression of ELF3 abolishes the protective effects of vorinostat on inhibition of SOX‐9 and COL2A1. A graphical summary of the underlying mechanism is shown in Figure 9.
FIGURE 9.
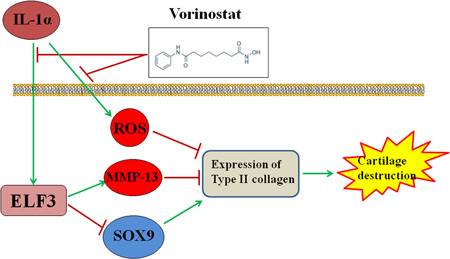
A proposed signaling mechanism of vorinastat‐mediated augmentation of IL‐1α‐inhibited Col2a1 expression. Col2a1, collagen type II a1; ELF3, E74‐like factor 3; IL, interleukin; MMP‐13, matrix metalloproteinase 13
Based on these findings, we conclude that vorinostat has the capacity to ameliorate the loss of type II collagen against IL‐1α in human chondrocytes at the transcriptional level, achieved by increasing the expression of SOX‐9 and its protein level by reducing the expression of MMP‐13. Importantly, these effects are mediated by the suppressed expression of ELF3.
Miao X., Wu Y., Wang P., Zhang Q., Zhou C., Yu X., Cao L., Vorinostat ameliorates IL‐1α‐induced reduction of type II collagen by inhibiting the expression of ELF3 in chondrocytes. J Biochem Mol Toxicol. 2021;35:e22844. 10.1002/jbt.22844
Xudong Miao, Yongping Wu, and Ping Wang contributed equally to this study.
DATA AVAILABILITY STATEMENT
The data that support the findings of this study are available on request from the corresponding author.
REFERENCES
- 1. Dillon C. F., Rasch E. K., Gu Q., Hirsch R., J. Rheumatol. 2006, 33(11), 2271. [PubMed] [Google Scholar]
- 2. Verzijl N., DeGroot J., Bank R. A., Bayliss M. T., Bijlsma J. W., Lafeber F. P., Maroudas A., TeKoppele J. M., Matrix Biol. 2001, 20, 409. [DOI] [PubMed] [Google Scholar]
- 3. Jin W. S., Choi E. J., Lee S. Y., Bae E. J., Lee T. H., Park J., J Obes Metab Syndr 2017, 26(1), 36. [DOI] [PMC free article] [PubMed] [Google Scholar]
- 4. Panoutsopoulou K., Zeggini E., J. Med. Genet. 2013, 50(11), 715. [DOI] [PMC free article] [PubMed] [Google Scholar]
- 5. Slichter M. E., Kraan G. A., Bramer W. M., Colaris J. W., Mathijssen N. M. C., BMJ Open 2020, 10(10), e039591. [DOI] [PMC free article] [PubMed] [Google Scholar]
- 6. Glyn‐Jones S., Palmer A. J., Agricola R., Price A. J., Vincent T. L., Weinans H., Carr A. J., Lancet 2015, 386, 376. [DOI] [PubMed] [Google Scholar]
- 7. Choi W. S., Yang J. I., Kim W., Kim H. E., Kim S. K., Won Y., Son Y. O., Chun C. H., Chun J. S., Ann. Rheum. Dis. 2019, 78, 421. [DOI] [PMC free article] [PubMed] [Google Scholar]
- 8. Dinarello C. A., Annu. Rev. Immunol. 2009, 27, 519. [DOI] [PubMed] [Google Scholar]
- 9. Zhang Y., Huang X., Yuan Y., Inflamm. Res. 2020, 69(11), 1123. [DOI] [PubMed] [Google Scholar]
- 10. Oettgen P., Alani R. M., Barcinski M. A., Brown L., Akbarali Y., Boltax J., Kunsch C., Munger K., Libermann T. A., Mol. Cell. Biol. 1997, 17, 4419. [DOI] [PMC free article] [PubMed] [Google Scholar]
- 11. Otero M., Plumb D. A., Tsuchimochi K., Dragomir C. L., Hashimoto K., Peng H., Olivotto E., Bevilacqua M., Tan L., Yang Z., Zhan Y., Oettgen P., Li Y., Marcu K. B., Goldring M. B., J. Biol. Chem. 2011, 287(5), 3559. [DOI] [PMC free article] [PubMed] [Google Scholar]
- 12. Johnstone R. W., Nat. Rev. Drug. Discov. 2002, 1, 287. [DOI] [PubMed] [Google Scholar]
- 13. Egger G., Liang G., Aparicio A., Jones P. A., Nature 2004, 429, 457. [DOI] [PubMed] [Google Scholar]
- 14. West A. C., Johnstone R. W., J. Clin. Invest. 2014, 124, 30. [DOI] [PMC free article] [PubMed] [Google Scholar]
- 15. Mishra N., Brown D. R., Olorenshaw I. M., Kammer G. M., Proc. Natl. Acad. Sci. U.S.A 2001, 98, 2628. [DOI] [PMC free article] [PubMed] [Google Scholar]
- 16. Leoni F., Fossati G., Lewis E. C., Lee J. K., Porro G., Pagani P., Modena D., Moras M. L., Pozzi P., Reznikov L. L., Siegmund B., Fantuzzi G., Dinarello C. A., Mascagni P., Mol. Med. 2005, 11, 1. [DOI] [PMC free article] [PubMed] [Google Scholar]
- 17. Nishida K., Komiyama T., Miyazawa S., Shen Z. N., Furumatsu T., Doi H., Yoshida A., Yamana J., Yamamura M., Ninomiya Y., Inoue H., Asahara H., Arthritis Rheum. 2004, 10, 3365. [DOI] [PubMed] [Google Scholar]
- 18. Mann B. S., Johnson J. R., Cohen M. H., Justice R., Pazdur R., Oncologist 2007, 12, 1247. [DOI] [PubMed] [Google Scholar]
- 19. LaVallie E. R., Chockalingam P. S., Collins‐Racie L. A., Freeman B. A., Keohan C. C., Leitges M., Dorner A. J., Morris E. A., Majumdar M. K., Arai M., J. Biol. Chem. 2006, 281(34), 24124. [DOI] [PubMed] [Google Scholar]
- 20. Leoni F., Zaliani A., Bertolini G., Porro G., Pagani P., Pozzi P., Donà G., Fossati G., Sozzani S., Azam T., Bufler P., Fantuzzi G., Goncharov I., Kim S. H., Pomerantz B. J., Reznikov L. L., Siegmund B., Dinarello C. A., Mascagni P., Proc. Natl. Acad. Sci. U.S.A. 2002, 99(5), 2995. [DOI] [PMC free article] [PubMed] [Google Scholar]
- 21. Sanders Y. Y., Hagood J. S., Liu H., Zhang W., Ambalavanan N., Thannickal V. J., Eur. Respir. J. 2014, 43(5), 1448. [DOI] [PubMed] [Google Scholar]
- 22. Mates J. M., Pérez‐Gómez C., Núñez de Castro I., Clin. Biochem. 1999, 32, 595. [DOI] [PubMed] [Google Scholar]
- 23. Lo Y. Y., Conquer J. A., Grinstein S., Cruz T. F., J. Cell. Biochem. 1998, 69, 19. [DOI] [PubMed] [Google Scholar]
- 24. Halliwell B., Gutteridge J. M. C., Free Radicals in Biology and Medicine, 3rd ed., Oxford Science Publications, 2000, pp. 617. [Google Scholar]
- 25. Erturk C., Altay M. A., Selek S., Kocyigit A., Scand. J. Clin. Lab. Invest. 2012, 72, 433. [DOI] [PubMed] [Google Scholar]
- 26. Altindag O., Erel O., Aksoy N., Selek S., Celik H., Karaoglanoglu M., Rheumatol. Int. 2007, 72, 339. [DOI] [PubMed] [Google Scholar]
- 27. Yu S. M., Kim S. J., J. Korean. Med. Sci. 2014, 27, 1042. [DOI] [PMC free article] [PubMed] [Google Scholar]
- 28. Henrotin Y. E., Bruckner P., Pujol J. P., Osteoarthritis Cartilage 2003, 11(10), 747. [DOI] [PubMed] [Google Scholar]
- 29. Ginn‐Pease M. E., Whisler R. L., Free Radic. Biol. Med. 1998, 25, 346. [DOI] [PubMed] [Google Scholar]
- 30. Del Carlo M., Schwartz D., Erickson E. A., Loeser R. F., Free Radic. Biol. Med. 2007, 42, 1350. [DOI] [PMC free article] [PubMed] [Google Scholar]
- 31. Chabane N., Zayed N., Afif H., Mfuna‐Endam L., Benderdour M., Boileau C., Martel‐Pelletier J., Pelletier J. P., Duval N., Fahmi H., Osteoarthritis Cartilage 2008, 16, 1267. [DOI] [PubMed] [Google Scholar]
- 32. Song J., Jin E. H., Kim D., Kim K. Y., Chun C. H., Jin E. J., BBA Clin. 2015, 3, 79. [DOI] [PMC free article] [PubMed] [Google Scholar]
- 33. Chowdhury T. T., Schulz R. M., Rai S. S., Thuemmler C. B., Wuestneck N., Bader A., Homandberg G. A., Arthritis Res. Ther. 2010, 12, R82. [DOI] [PMC free article] [PubMed] [Google Scholar]
- 34. Li L. Q., Li H., Cancer Biol. Ther. 2013, 14, 796. [DOI] [PMC free article] [PubMed] [Google Scholar]
- 35. Mitchell P. G., Magna H. A., Reeves L. M., Lopresti‐Morrow L. L., YoCum S. A., Rosner P. J., Geoghegan K. F., Hambor J. E., J. Clin. Invest. 1996, 97, 761. [DOI] [PMC free article] [PubMed] [Google Scholar]
- 36. Choo Q. Y., Ho P. C., Tanaka Y., Lin H. S., Rheumatology 2010, 49, 1447. [DOI] [PubMed] [Google Scholar]
- 37. Wang Z., Chen C., Finger S. N., Kwajah S., Jung M., Schwarz H., Eur. Respir. J. 2009, 34, 145. [DOI] [PubMed] [Google Scholar]
- 38. Lefebvre V., Dvir‐Ginzberg M., Connect. Tissue Res. 2017, 58(1), 2. [DOI] [PMC free article] [PubMed] [Google Scholar]
- 39. Ball H. C., Ansari M. Y., Ahmad N., Novak K., Hanqi T. M., Connect. Tissue Res. 2020, 61, 1.31782325 [Google Scholar]
- 40. Murakami S., Lefebvre V., de Crombrugghe B., J. Biol. Chem. 2000, 275, 3687. [DOI] [PubMed] [Google Scholar]
- 41. Grall F., Gu X., Tan L., Cho J. Y., Inan M. S., Pettit A. R., Thamrongsak U., Choy B. K., Manning C., Akbarali Y., Zerbini L., Rudders S., Goldring S. R., Gravallese E. M., Oettgen P., Goldring M. B., Libermann T. A., Arthritis Rheum. 2003, 48, 1249. [DOI] [PubMed] [Google Scholar]
- 42. Wu J., Duan R., Cao H., Field D., Newnham C. M., Koehler D. R., Zamel N., Pritchard M. A., Hertzog P., Post M., Tanswell A. K., Hu J., Cell Res. 2008, 18, 649. [DOI] [PMC free article] [PubMed] [Google Scholar]
- 43. Otero M., Plumb D. A., Tsuchimochi K., Dragomir C. L., Hashimoto K., Peng H., Olivotto E., Bevilacqua M., Tan L., Yang Z., Zhan Y., Oettgen P., Li Y., Marcu K. B., Goldring M. B., J. Bio. Chem. 2012, 5, 3559. [DOI] [PMC free article] [PubMed] [Google Scholar]
Associated Data
This section collects any data citations, data availability statements, or supplementary materials included in this article.
Data Availability Statement
The data that support the findings of this study are available on request from the corresponding author.


