

Abstract
Objective
To contribute to the debate regarding the minimum volume of radical cystectomies (RCs) that a hospital should perform by evaluating the association between hospital volume (HV) and postoperative mortality.
Patients and Methods
Patients who underwent RC for bladder cancer between 1 January 2008 and 31 December 2018 were retrospectively identified from the Netherlands Cancer Registry. To create a calendar‐year independent measure, the HV of RCs was calculated per patient by counting the RCs performed in the same hospital in the 12 months preceding surgery. The relationship of HV with 30‐ and 90‐day mortality was assessed by logistic regression with a non‐linear spline function for HV as a continuous variable, which was adjusted for age, tumour, node and metastasis (TNM) stage, and neoadjuvant treatment.
Results
The median (interquartile range; range) HV among the 9287 RC‐treated patients was 19 (12–27; 1–75). Of all the included patients, 208 (2.2%) and 518 (5.6%) died within 30 and 90 days after RC, respectively. After adjustment for age, TNM stage and neoadjuvant therapy, postoperative mortality slightly increased between an HV of 0 and an HV of 25 RCs and steadily decreased from an HV of 30 onwards. The lowest risks of postoperative mortality were observed for the highest volumes.
Conclusion
This paper, based on high‐quality data from a large nationwide population‐based cohort, suggests that increasing the RC volume criteria beyond 30 RCs annually could further decrease postoperative mortality. Based on these results, the volume criterion of 20 RCs annually, as recently recommended by the European Association of Urology Guideline Panel, might therefore be reconsidered.
Keywords: bladder cancer, hospital volume, postoperative mortality, radical cystectomy, #blcsm, #BladderCancer, #uroonc
Introduction
Radical cystectomy (RC) as treatment for bladder cancer is a complex surgical procedure. It is the 'gold standard' in localized carcinoma invading bladder muscle (MIBC) [1], although the role of trimodal therapy is also increasing [2]. The procedure results in substantial postoperative morbidity and mortality. Multiple European countries have implemented policies towards centralization of RCs based on previous studies that showed a negative association between hospital volume (HV) and postoperative mortality [3]. For example, in the Netherlands, hospitals currently have to perform a minimum of 20 RCs per year [4], and the UK implemented a combined minimum of 50 RCs and/or radical prostatectomies annually [5]. There was, however, no evidence‐based advice on the minimum number of RCs until the recently performed systematic review of the European Association of Urology (EAU) Guidelines Panel for MIBC on this topic [6].
The guidelines group recommends at least 10, but preferably 20, RCs per hospital annually, but most of the included studies on which this recommendation is based had a moderate to high risk of bias according to the guideline group [6]. Apart from the risk of bias, analyses commonly used to assess the association between HV and outcomes can be considered suboptimal. Almost all studies categorized HV using highly varying thresholds across studies [7, 8, 9, 10, 11, 12, 13], thereby impeding efforts to determine an RC threshold. More important, however, are the statistical consequences of distribution‐based or self‐chosen thresholds. In the best‐case scenario, categorizing HV only obscures the underlying shape of the relationship over the range of possible volumes. In the worst case, it will lead to misspecification of the model [14].
To avoid loss of information through categorization or inappropriate assumptions of a linear relationship, splines can be used to model a flexible effect of HV on mortality [14]. A spline function yields insight into the functional form (e.g. linear, exponential, or other shapes) of the relationship between HV and postoperative mortality. To date, only one study has used a flexible model, i.e. one with no assumptions on the linearity of the relationship, to investigate the functional form of the relationship between RC HV and inpatient complications, and that study found a plateau effect at 50–55 RCs [15]. However, no study has yet used this method with postoperative mortality as an endpoint.
This large population‐based study using individual patient data aims to estimate the relationship between volume of RCs performed by a hospital and postoperative mortality. Ultimately, this should contribute to an evidence‐based criterion for the minimum number of RCs performed per operating centre.
Patients and Methods
Cohort and Data
A historic cohort of bladder cancer patients undergoing RC was identified through the Netherlands Cancer Registry (NCR). The NCR is a nationwide population‐based registry serving the total Dutch population of 17.4 million inhabitants. All newly diagnosed malignancies are included, mainly based on notification from the nationwide network and registry of histopathology and cytopathology in the Netherlands (PALGA). Independent and trained data managers of the NCR extract data on each patient’s diagnosis, staging and treatment from the medical records.
All patients diagnosed with bladder cancer, regardless of stage and histology, who underwent an RC in a Dutch hospital between 1 January 2008 and 31 December 2018 were included. As only inhabitants of the Netherlands are included in the NCR, non‐inhabitants surgically treated in a Dutch hospital could therefore not be included in this cohort. For all patients in the final cohort, data on the patient (age, sex), tumour (TNM stage) and treatment (RC date and hospital, neoadjuvant therapy) were retrieved from the NCR. Topography and histology were coded according to the International Classification of Diseases for Oncology (ICD‐O‐3) [16]. Tumours were staged according to the TNM classifications of the Union for International Cancer Control (UICC) that were applicable at the time of diagnosis [17]. Both initial and re‐transurethral resections were considered to determine clinical T‐stage. Vital status in the NCR was obtained through annual linkage with the Personal Records Database, in which (date of) emigration and (date of) death is recorded for all inhabitants of the Netherlands.
According to the Central Committee on Research involving Human Subjects (CCMO), this descriptive type of study does not require approval from an ethics committee in the Netherlands. The study was approved by the Privacy Review Board of the NCR.
Hospital Volume and Outcome
Hospital volume of RC was determined per patient, by calculating the number of preceding RCs in the same hospital in the 12 months prior to surgery where the specific patient underwent RC. This approach ensures a more accurate reflection of the experience with RCs in the preceding year for a specific patient than the overall year volume that can vary strongly between calendar years. In case of a hospital merger, the RCs performed in both of the merged hospitals in the preceding 12 months were counted. No distinction was made between different surgical approaches (open, laparoscopic or robot‐assisted). The primary and secondary outcomes were mortality within 30 and 90 days of the RC date.
Statistical Analyses
The effect of HV on mortality was modelled through multivariable logistic regression with the individual patient as the unit of analysis. Outcome variables were 30‐ and 90‐day mortality. HV was modelled through a spline function to allow a flexible (i.e. non‐linear) relationship. A restricted cubic spline with four knots at a priori‐determined percentiles of the distribution of HV was used [18]. The effect of HV was adjusted for age at RC, clinical TNM stage, and neoadjuvant chemotherapy based on a priori hypothesized causal relationships (Appendix 1). Because of the low event rate of 30‐ and 90‐day mortality, penalized estimation (Firth’s procedure) instead of maximum likelihood estimation was used to eliminate small‐sample bias and to produce stable estimates [19, 20]. All analyses were performed in SAS 9.4 (SAS Institute Inc., Cary, NC, USA).
Results
Cohort
From the NCR, 9319 patients who underwent RC for bladder cancer in the period 2008–2018 were identified. Twenty patients were excluded because their exact RC date could not be determined. After excluding two other patients who emigrated within 90 days after RC, 9297 patients were included in the analyses.
Patient and tumour characteristics at diagnosis are shown in Table 1. Patients treated in hospitals with higher HV were more often female, and more often had a cT3/4 tumour and cTN+ disease. They also received neoadjuvant treatment more often.
Table 1.
Patient and disease characteristics at diagnosis and neoadjuvant treatment.
| All | Hospital volume | |||||
|---|---|---|---|---|---|---|
| N | Column % | 0–9 | 10–19 | 20–39 | ≥40 | |
| All (row %) | 9297 | 100 | 16.8 | 35.0 | 37.8 | 10.5 |
| Sex, % | ||||||
| Male | 6860 | 73.8 | 75.7 | 74.6 | 72.7 | 72.2 |
| Female | 2437 | 26.2 | 24.3 | 25.4 | 27.3 | 27.8 |
| Age at diagnosis, % | ||||||
| 0–50 years | 497 | 5.3 | 5.7 | 4.5 | 5.1 | 8.5 |
| 51–60 years | 1486 | 16.0 | 15.9 | 16.0 | 16.3 | 14.9 |
| 61–70 | 3532 | 38.0 | 38.2 | 37.3 | 38.5 | 38.3 |
| 71–80 | 3322 | 35.7 | 36.0 | 37.2 | 34.8 | 33.8 |
| 80+ | 460 | 4.9 | 4.2 | 5.1 | 5.2 | 4.5 |
| Clinical T‐stage, % | ||||||
| T0/Ta | 224 | 2.4 | 1.7 | 2.2 | 2.5 | 3.7 |
| Tis/T1 | 1382 | 14.9 | 11.9 | 14.7 | 15.8 | 16.8 |
| T2 | 5365 | 57.7 | 66.1 | 59.8 | 55.2 | 46.3 |
| T3 | 1399 | 15.0 | 10.5 | 14.1 | 16.9 | 18.6 |
| T4 | 582 | 6.3 | 6.2 | 5.4 | 6.2 | 9.4 |
| Unknown | 345 | 3.7 | 3.5 | 3.7 | 3.4 | 5.2 |
| Clinical N‐stage, % | ||||||
| N0/X | 8320 | 89.5 | 91.1 | 90.1 | 89.5 | 84.8 |
| N+ | 977 | 10.5 | 8.9 | 9.9 | 10.5 | 15.2 |
| Clinical M‐stage, % | ||||||
| M0/X | 9161 | 98.5 | 98.1 | 98.6 | 98.6 | 98.7 |
| M+ | 136 | 1.5 | 1.9 | 1.4 | 1.4 | 1.3 |
| Pathological T‐stage, % | ||||||
| T0 | 776 | 8.3 | 5.6 | 7.8 | 9.8 | 9.4 |
| Ta/Tis/T1 | 1233 | 13.3 | 9.8 | 12.8 | 14.2 | 16.9 |
| T2 | 2676 | 28.8 | 33.2 | 29.9 | 26.6 | 26.3 |
| T3/4 | 4221 | 45.4 | 47.6 | 46.0 | 44.7 | 42.2 |
| Unknown | 391 | 4.2 | 3.8 | 3.5 | 4.8 | 5.2 |
| Pathological N‐stage, % | ||||||
| N0/X | 7130 | 76.7 | 77.5 | 77.0 | 76.2 | 76.0% |
| N+ | 2167 | 23.3 | 22.5 | 23.0 | 23.8 | 24.0% |
| Pathological M‐stage, % | ||||||
| M0/X | 9190 | 98.8 | 99.2 | 98.8 | 98.8 | 98.7 |
| M+ | 107 | 1.2 | 0.8 | 1.2 | 1.2 | 1.3 |
| Histology, % | ||||||
| Urothelial cell carcinoma | 8727 | 93.9 | 93.6 | 93.8 | 94.2 | 93.4 |
| Squamous cell carcinoma | 303 | 3.3 | 3.4 | 3.5 | 2.8 | 3.9 |
| Mixed small/large cell carcinoma | 68 | 0.7 | 0.8 | 0.7 | 0.6 | 1.1 |
| Adenocarcinoma | 75 | 0.8 | 0.8 | 1.0 | 0.7 | 0.4 |
| Small cell carcinoma | 45 | 0.5 | 0.4 | 0.3 | 0.8 | 0.2 |
| Other/not specified | 79 | 0.8 | 0.9 | 0.7 | 0.9 | 0.9 |
| Neoadjuvant treatment, % | ||||||
| No neoadjuvant treatment | 7731 | 83.2 | 90.6 | 84.9 | 80.2 | 76.3 |
| Neoadjuvant chemotherapy | 1536 | 16.5 | 9.4 | 14.9 | 19.4 | 23.3 |
| Neoadjuvant radiotherapy | 30 | 0.3 | 0.1 | 0.3 | 0.5 | 0.4 |
The median (interquartile range; range) HV was 19 (12–28; 1–83).
The distribution of HV shifted over the years towards more patients undergoing RC in hospitals with higher volumes (Fig. 1). In 2008, there were 86 hospitals performing RC, whereas in 2018 only 36 hospitals performed RC.
Fig. 1.

Distribution of patients across hospital volumes of radical cystectomy over the years.
Postoperative Mortality
Of the 9297 patients, 208 (2.24%) died within 30 days of RC and 518 (5.57%) within 90 days (Table 2). Figure 2 shows the spline curves for HV in relationship to 30‐ and 90‐day postoperative mortality, adjusted for age, TNM stage and neoadjuvant therapy. For both outcomes, the curves show an initial slight increase between HV of 0 and HV of 25 and a decrease for HV above 30, with lowest risks of mortality among the highest HVs.
Table 2.
Postoperative mortality by year and hospital volume.
| Number of RCs | 30‐day mortality | 90‐day mortality | |||||
|---|---|---|---|---|---|---|---|
| N | % | 95% CI | N | % | 95% CI | ||
| All | 9297 | 208 | 2.24 | 1.94–2.54 | 518 | 5.57 | 5.11–6.04 |
| Year of RC | |||||||
| 2008 | 703 | 16 | 2.28 | 1.31–3.67 | 47 | 6.69 | 4.95–8.79 |
| 2009 | 673 | 15 | 2.23 | 1.25–3.65 | 45 | 6.69 | 4.92–8.85 |
| 2010 | 720 | 17 | 2.36 | 1.38–3.75 | 44 | 6.11 | 4.48–8.12 |
| 2011 | 883 | 20 | 2.27 | 1.39–3.48 | 53 | 6.00 | 4.53–7.78 |
| 2012 | 844 | 18 | 2.13 | 1.27–3.35 | 44 | 5.21 | 3.81–6.94 |
| 2013 | 925 | 26 | 2.81 | 1.84–4.09 | 44 | 4.76 | 3.48–6.33 |
| 2014 | 895 | 21 | 2.35 | 1.46–3.56 | 43 | 4.80 | 3.50–6.42 |
| 2015 | 924 | 22 | 2.38 | 1.50–3.58 | 52 | 5.63 | 4.23–7.31 |
| 2016 | 890 | 22 | 2.47 | 1.56–3.72 | 48 | 5.39 | 4.00–7.09 |
| 2017 | 924 | 15 | 1.62 | 0.91–2.66 | 42 | 4.55 | 3.30–6.10 |
| 2018 | 916 | 16 | 1.75 | 1.00–2.82 | 56 | 6.11 | 4.65–7.87 |
| HV* | |||||||
| 0–9 | 1559 | 34 | 2.18 | 1.51–3.03 | 90 | 5.77 | 4.67–7.05 |
| 10–19 | 3249 | 73 | 2.25 | 1.77–2.82 | 180 | 5.54 | 4.78–6.38 |
| 20–29 | 2423 | 64 | 2.64 | 2.04–3.36 | 149 | 6.15 | 5.23–7.18 |
| 30–39 | 1091 | 25 | 2.29 | 1.49–3.36 | 58 | 5.32 | 4.06–6.82 |
| 40–60 | 975 | 12 | 1.23 | 0.64–2.14 | 41 | 4.21 | 3.03–5.66 |
HV, hospital volume; RC, radical cystectomy.
Individual patient‐level HV in preceding 12 months.
Fig. 2.
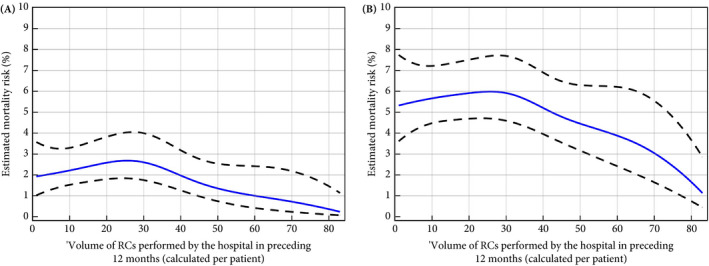
Estimated effect of hospital volume on 30‐ and 90‐day postoperative mortality. (A) 30‐day postoperative mortality. (B) 90‐day postoperative mortality. Blue lines show the risk estimates, adjusted for age, TNM stage, time between diagnosis and radical cystectomy (RC) and receiving neoadjuvant therapy. Black dashed lines are the 95% confidence limits.
Discussion
In the present study, we investigated the relationship between HV and 30‐ and 90‐day mortality using data from the NCR. We observed that the adjusted associations of HV with both 30‐ and 90‐day mortality were similarly shaped. There was a very slight increase in the mortality up to volumes of approximately 25 and a steady decrease thereafter. There was no indication of a plateau beyond a certain HV, where mortality did not decrease further with increasing HV.
The crude 30‐ and 90‐day mortality rates among RC‐treated patients were 2.2% and 5.6%, respectively, between 2008 and 2018 in the Netherlands. These postoperative mortality rates are lower compared to the rates presented in previous national and international studies [7, 8, 13, 21]. For example, a Dutch study by Goossens‐Laan et al. [7] showed overall 30‐ and 90‐day mortality rates of 3.4% and 7.7% among RCs executed between 2004 and 2006. At that time, no RC volume criteria were in place in the Netherlands. The first volume criterion of 10 RCs annually was introduced in 2010 and this was raised to a 3‐year‐based average of 20 RCs per year in 2015 [4]. This corresponded with a shift from low RC volumes to higher RC volumes. It is noteworthy, however, that the short‐term mortality rates in this study have not dropped to the mortality rates of high‐volume hospitals (>10 RCs) as presented by Goossens‐Laan et al. [7], i.e. 1.2% and 4.9% for 30‐ and 90‐day mortality, respectively. This might be explained by changes in patient selection for RC, as previous studies have shown that the percentage of patients undergoing RC increased until 2014 and only dropped as a result of more widespread use of chemoradiation [7].
Some methodological choices made in the present study strengthen our conclusions. The finding that postoperative mortality risks decrease beyond a certain HV is in line with the general conclusion of the majority of previous studies [6, 21], but this study is the first one presenting the functional form of the volume–outcome association across the whole range of volumes. Previous studies have categorized HV based on distribution properties (e.g. tertiles or quartiles [8, 9, 10, 11, 12]) or self‐chosen thresholds [7, 13]. Apart from the great diversity in the definition of high volume, categorization leads in all cases to loss of information and possibly even to misspecification of the model [14]. Additionally, through the use of splines, no prior assumptions (e.g. linearity) about the relationship of volume and outcomes were forced. This approach provides new insight into the shape of the association across all volumes. We calculated HV at an individual patient level. Most studies calculated HV as the annual number of RCs performed at one hospital [7, 8, 9, 10, 11, 12]. As the overall annual volume can vary greatly over years, especially after the introduction of volume criteria, this might result in imprecise measures of volume and affect the volume–outcome relationship. HV calculated per patient circumvents these issues and gives a more accurate reflection of the experience with RCs in the preceding year for a specific patient.
Several limitations of this study should also be noted. First, only RCs for bladder cancer were included in this study. The HV including RC for other indications might therefore be slightly higher. From the viewpoint that RC is a multidisciplinary effort where the total package of care determines the final outcome, including the selection of the patients for operation, the surgeon, anaesthesiology team, intensive care unit and ward team [6], one could argue that all RCs performed at a hospital should be included in the calculation of HV, but because the number of RCs for other indications than bladder cancer is very small relative to the number of bladder cancer RCs, the impact of this omission is expected to be small. Second, potential (residual) confounding of the relationship between HV and postoperative mortality by other factors has been an important issue in previous studies. Although the aetiology of each of the outcomes (30‐ and 90‐day mortality) may be somewhat different [22], the relevant factors are considered to be overlapping. An a priori‐defined set of relevant confounders for both outcomes included age, tumour stage, (neo)adjuvant chemotherapy, and factors associated with overall fitness (by Bruins et al. [6] specified as body mass index, and comorbidity). Within the NCR, highly accurate individual patient data were available on age, TNM stage, and neoadjuvant chemotherapy, but data on body mass index and comorbidities were lacking. The influence of these factors is questionable, however, because they are incorporated in patient selection for RC and therefore vary less among the RC‐treated patient population. Among surgically treated patients, it is unclear whether body mass index and comorbidities have predictive value for the occurrence of complications after RC [23, 24]. Lastly, it should be considered that clustering of patients within hospital in which the surgery was performed may have led to a slight underestimation of standard errors and, consequently, underestimation of the width of the confidence interval around the HV effect.
Multiple studies have investigated the effect of surgeon volume in relation to postoperative mortality [6]. According to the EAU Guidelines Panel for MIBC, the main driver of postoperative mortality is HV rather than surgeon volume [6]. Since literature is less suggestive of a surgeon volume effect on postoperative mortality and because of the lack of surgeon‐level data in this cohort, we limited the scope of this analysis to HV.
The present study suggests that increasing the volume criteria beyond the current recommendation of 20 RCs annually from the EAU guideline group and the Dutch Association of Urology will further decrease postoperative mortality. Volume criteria should, however, not only be based on attaining the lowest possible postoperative morbidity and mortality rates, but should also take the practical consequences of centralization, such as access to care or training of residents, into account. The balance between those factors may differ across countries and healthcare infrastructures. We therefore recommend policy makers in charge of defining RC volume criteria to search for a balance between reductions in postoperative mortality on the one hand and access to care in a region on the other. Undeniably, by stimulating centralization of the surgical procedure as well as patient selection per area and discouraging the performing of RC in hospitals that can barely perform 20 RCs each year, further improvements can be made.
In conclusion, the relationship between RC HV and postoperative mortality shows a 'more is better' principle from volumes of 30 and higher. These results warrant a further increase in the RC volume criterion to decrease postoperative mortality, and should initiate a discussion among the national bladder cancer tumour board to reassess the annual HV of RC in the Netherlands.
Acknowledgement
This study was funded by the Dutch Cancer Society (BlaZIB study, KWF 2015–7914). The funding agency had no role in the design, analysis, or interpretation of the results of this study.
Conflict of Interest
None declared.
Abbreviations
- EAU
European Association of Urology
- HV
hospital volume
- MIBC
carcinoma invading bladder muscle
- NCR
Netherlands Cancer Registry
- RC
radical cystectomy
Appendix 1.
Causal diagram of relevant factors and their assumed relations
Fig. A1.

It shows the directed acyclic graph of the hypothesized structure of causal paths between factors involved with radical cystectomy (RC), making the assumptions explicit that underlie the analysis. Hospital volume of RC is hypothesized to only influence postoperative mortality through complications and quality of care processes. Neither of the other factors is hypothesized to influence postoperative mortality except through complications. Based on Figure A1, the minimal adjustment set to estimate an unbiased association for hospital volume and postoperative mortality among RC‐treated patients would include: age, general fitness, TNM stage, and neoadjuvant therapy. *Quality of care processes include the expertise of recognizing and adequately dealing with postoperative complications. **General fitness summarizes the overall health of the patient, which may include performance status, comorbidities and body mass index.
References
- 1. Witjes JA, Lebret T, Compérat EM et al. Updated 2016 EAU guidelines on muscle‐invasive and metastatic bladder cancer. Eur Urol 2017; 71: 462–75 [DOI] [PubMed] [Google Scholar]
- 2. Wilhite TJ, Routman D, Arnett AL et al. Increased utilization of external beam radiotherapy relative to cystectomy for localized, muscle‐invasive bladder cancer: a SEER analysis. Bladder 2018; 5: e34 [DOI] [PMC free article] [PubMed] [Google Scholar]
- 3. Goossens‐Laan CA, Gooiker GA, van Gijn W et al. A systematic review and meta‐analysis of the relationship between hospital/surgeon volume and outcome for radical cystectomy: an update for the ongoing debate. Eur Urol 2011; 59: 775–83 [DOI] [PubMed] [Google Scholar]
- 4. Nederlandse Vereniging van Urologie, Kwaliteitsnorm blaascarcinoom, 2018.
- 5. Afshar M, Goodfellow H, Jackson‐Spence F et al. Centralisation of radical cystectomies for bladder cancer in England, a decade on from the 'Improving Outcomes Guidance': the case for super centralisation. BJU Int 2018; 121: 217–24 [DOI] [PubMed] [Google Scholar]
- 6. Bruins HM, Veskimae E, Hernandez V et al. The importance of hospital and surgeon volume as major determinants of morbidity and mortality after radical cystectomy for bladder cancer: a systematic review and recommendations by the European Association of Urology Muscle‐invasive and Metastatic Bladder Cancer Guideline Panel. Eur Urol Oncol 2020; 3: 131–44 [DOI] [PubMed] [Google Scholar]
- 7. Goossens‐Laan CA, Visser O, Wouters MW et al. Variations in treatment policies and outcome for bladder cancer in the Netherlands. Eur J Surg Oncol 2010; 36(Suppl 1): S100–7 [DOI] [PubMed] [Google Scholar]
- 8. Kulkarni GS, Urbach DR, Austin PC, Fleshner NE, Laupacis A. Impact of provider volume on operative mortality after radical cystectomy in a publicly funded healthcare system. Can Urol Assoc J 2013; 7: 425–9 [DOI] [PMC free article] [PubMed] [Google Scholar]
- 9. Porter MP, Gore JL, Wright JL. Hospital volume and 90‐day mortality risk after radical cystectomy: a population‐based cohort study. World J Urol 2011; 29: 73–7 [DOI] [PubMed] [Google Scholar]
- 10. Sabir EF, Holmang S, Liedberg F et al. Impact of hospital volume on local recurrence and distant metastasis in bladder cancer patients treated with radical cystectomy in Sweden. Scand J Urol 2013; 47: 483–90 [DOI] [PubMed] [Google Scholar]
- 11. Siemens DR, Mackillop WJ, Peng Y et al. Processes of care and the impact of surgical volumes on cancer‐specific survival: a population‐based study in bladder cancer. Urology 2014; 84: 1049–57 [DOI] [PubMed] [Google Scholar]
- 12. Vetterlein MW, Meyer CP, Leyh‐Bannurah SR et al. Effect of hospital and surgeon case volume on perioperative quality of care and short‐term outcomes after radical cystectomy for muscle‐invasive bladder cancer: results from a European tertiary care center cohort. Clin Genitourin Cancer 2017; 15: e809–17 [DOI] [PubMed] [Google Scholar]
- 13. Waingankar N, Mallin K, Smaldone M et al. Assessing the relative influence of hospital and surgeon volume on short‐term mortality after radical cystectomy. BJU Int 2017; 120: 239–45 [DOI] [PMC free article] [PubMed] [Google Scholar]
- 14. Sauerbrei W, Perperoglou A, Schmid M et al. State of the art in selection of variables and functional forms in multivariable analysis‐outstanding issues. Diagn Progn Res 2020; 4: 3 [DOI] [PMC free article] [PubMed] [Google Scholar]
- 15. Arora S, Keeley J, Patel A et al. Defining a "High Volume" radical cystectomy hospital: where do we draw the line? Eur Urol Focus 2020; 6: 975–81. [DOI] [PubMed] [Google Scholar]
- 16. Trott PA. International classification of diseases for oncology. J Clin Pathol 1977; 30: 782 [Google Scholar]
- 17. Sobin LH, Fleming ID. TNM classification of malignant tumors. Cancer 1997; 80: 1803–4 [DOI] [PubMed] [Google Scholar]
- 18. Harrell FE Jr. Regression Modeling Strategies: With Applications to Linear Models, Logistic and Ordinal Regression, and Survival Analysis. Cham: Springer, 2015. [Google Scholar]
- 19. Nemes S, Jonasson JM, Genell A, Steineck G. Bias in odds ratios by logistic regression modelling and sample size. BMC Med Res Methodol 2009; 9: 56 [DOI] [PMC free article] [PubMed] [Google Scholar]
- 20. Firth D. Bias reduction of maximum likelihood estimates. Biometrika 1993; 80: 27–38 [Google Scholar]
- 21. Llorente C, Guijarro A, Hernandez V, Fernández‐Conejo G, Perez‐Fernandez E, Pocock S. Effect of hospital volume on 90‐day mortality after radical cystectomy for bladder cancer in Spain. World J Urol 2020; 38: 1221–8 [DOI] [PubMed] [Google Scholar]
- 22. Korbee M, Voskuilen C, Hendricksen K et al. Prediction of early (30‐day) and late (30–90‐day) mortality after radical cystectomy in a comprehensive cancer centre over two decades. World J Urol 2020; 38: 2197–205 [DOI] [PubMed] [Google Scholar]
- 23. Meng X, Press B, Renson A et al. Discriminative ability of commonly used indexes to predict adverse outcomes after radical cystectomy: comparison of demographic data, American Society of Anesthesiologists, Modified Charlson Comorbidity Index, and Modified Frailty Index. Clin Genitourin Cancer 2018; 16: e843–50 [DOI] [PubMed] [Google Scholar]
- 24. Arora K, Hanson KT, Habermann EB, Tollefson MK, Psutka SP. Early complications and mortality following radical cystectomy: associations with malnutrition and obesity. Bladder Cancer 2018; 4: 377–88 [DOI] [PMC free article] [PubMed] [Google Scholar]