

Abstract
Objective
To evaluate if non‐invasive prenatal testing (NIPT) affects livebirth (LB) prevalence of Down syndrome (DS) in the Netherlands.
Method
Data from clinical genetics laboratories and the Working Party on Prenatal Diagnosis and Therapy (2014–2018) and previous published data (1991–2013) were used to assess trends for DS LB prevalence and reduction percentage (the net decrease in DS LBs resulting from selective termination of pregnancies). Statistics Netherlands provided general population data.
Results
DS LB prevalence increased from 11.6/10,000 in 1991 to 15.9/10,000 in 2002 (regression coefficient 0.246 [95% CI: 0.105–0.388; p = 0.003]). After 2002, LB prevalence decreased to 11.3/10,000 in 2014 and further to 9.9/10,000 in 2018 (regression coefficient 0.234 (95% CI: −0.338 to −0.131; p < 0.001). The reduction percentage increased from 26% in 1991 to 55.2% in 2018 (regression coefficient 0.012 (95% CI: 0.010–0.013; p < 0.001)). There were no trend changes after introducing NIPT as second‐tier (2014) and first‐tier test (2017).
Conclusions
Introducing NIPT did not change the decreasing trend in DS LB prevalence and increasing trend in reduction percentage. These trends may be caused by a broader development of more prenatal testing that had already started before introducing NIPT.
Key points
What's already known about this topic?
The introduction of NIPT changed the landscape in prenatal screening worldwide.
No long‐term population‐based study on the impact of NIPT on DS LB prevalence has been published.
What does this study add?
This study shows how to calculate DS LB prevalence in the absence of a national registration program.
Introducing NIPT caused no trend changes in DS LB prevalence and reduction percentage in the Netherlands.
1. INTRODUCTION
Down syndrome (DS), often caused by trisomy 21, is the most common aneuploidy in humans. Because average maternal age has increased in Europe 1 , 2 , 3 and livebirth (LB) prevalence of DS increases with maternal age, 4 an increase in DS LB prevalence over time may be expected. However, prenatal screening and termination of pregnancy (TOP) for DS counterbalance this expected increase, although this varies between countries depending on policy, provision and uptake of prenatal screening, and cultural differences. 5 , 6 , 7 , 8 , 9 , 10 , 11 , 12 , 13 In Europe, for 2011–2015, this resulted in an estimated DS LB prevalence ranging from circa 5.0 per 10,000 LBs in Denmark to 27.5 per 10,000 LBs in Ireland. 3
Before 2007, in the Netherlands, there was no formal prenatal screening programme for DS, but serum screening tests and the first‐trimester combined test (FCT) were widely offered. In 2007, a public prenatal screening programme was implemented offering FCT to all pregnant women. Risk assessment for DS with FCT is based on maternal age, fetal nuchal translucency thickness and concentrations of maternal serum‐free β‐human chorionic gonadotrophin and pregnancy‐associated plasma protein‐A. Costs were initially fully reimbursed through healthcare insurance for women ≥36 years, but from 2015, the full reimbursement of FCT was withdrawn and all women had to pay an additional fee (€165). 14 In 2014, non‐invasive prenatal testing (NIPT) was introduced in the Netherlands as a second‐tier test, initially only offered to women with an increased risk for trisomy 13, 18 and 21, based on either the results of the FCT or their medical history (e.g., if parents already have a child with trisomy). NIPT became available to all pregnant women as an initial (first‐tier) test in April 2017. 15 For NIPT, a fee comparable with that for the FCT is charged. For DS, NIPT is a highly accurate screening test based on an analysis of cell‐free DNA that circulates in the mother's blood and can be used from 10 weeks in pregnancy. 16 However, NIPT is not diagnostic, and confirmation of a positive result by invasive testing (chorionic villus sampling [CVS] or amniocentesis [AC]) is recommended. 17
It is important to emphasise that the aim of a prenatal screening programme is promoting reproductive autonomy, that is providing parents the choice to continue the pregnancy and prepare for the birth of a child with DS or to terminate the pregnancy if the fetus has DS. Unlike in the United States of America, offering children with DS up for adoption is very rarely proposed or utilised in the Netherlands.
NIPT is often a topic for public and political debate in many countries. The accuracy and non‐invasiveness of NIPT raises ethical concerns regarding informed decision making, freedom to choose and consequences for people with a disability, especially in the scenario that DS LB prevalence suddenly decreases after introducing NIPT. 18 , 19 The open question remains: what is the DS LB prevalence after introducing NIPT? Despite NIPT being adopted in many countries worldwide, 20 , 21 to date no long‐term population‐based study on the impact of NIPT on DS LB prevalence has been published. This study aims to evaluate if NIPT affects DS LB prevalence in the Netherlands.
2. METHODS
The impact of NIPT on DS LB prevalence is investigated by looking for changes in trends in DS LB prevalence and the decrease in DS LBs resulting from TOPs (reduction percentage), after the introduction of NIPT as a second‐tier (2014) and a first‐tier (2017) test.
The Medical Ethical Committee of Amsterdam University Medical Centers, location VUmc, stated that no permission was needed to be granted for this study in accordance with Dutch research legislation (WMO), date of approval: 13 November 2020, Reference number: VUmc NO: 2020.466.
2.1. Actual DS LB prevalence
In the Netherlands, although a regional and a national register exist recording births of children with DS, data on prevalence are incomplete (Supplementary Information Material S1). To estimate DS LB prevalence from 2014 to 2018, the data of eight Dutch clinical genetics centres and data of the Working Party on Prenatal Diagnosis and Therapy of the Dutch Society of Obstetrics and Gynaecology and the Dutch Society of Clinical Geneticists (WPDT) were collected. For the period 1991–2013, data of de Graaf et al. 7 were used.
The total number of DS LBs was estimated by adding the estimated LBs with prenatal diagnosis to LBs with postnatal diagnosis (Supplementary Information Material S2). LBs counted as having a postnatal diagnosis did not also have a prenatal diagnosis.
Actual DS LB prevalence was estimated by dividing the estimated number of DS LBs by the total number of LBs in the general population and multiplying by 10,000.
2.2. LBs with DS diagnosis
First, the number of LBs with prenatal diagnosis of DS is estimated. For the period 2014–2017, data on prenatal diagnoses were available in the annual reports of the WPDT, which contain statistics on diagnostic prenatal testing by AC or CVS, number of diagnosed fetuses with DS, and number of pregnancies terminated after DS diagnosis. In the group of fetuses that were not terminated after DS diagnoses—the so‐called no‐TOPs—information on outcomes of pregnancies (LB or natural loss) was lacking. Therefore, estimates of natural loss of fetuses with DS after a CVS or an AC from the study of Savva et al. 22 were used (Supplementary Information Material S3).
In addition, clinical genetics centres directly reported the number of prenatal diagnoses between 2014 and 2018 and, if known, the follow‐up of these pregnancies. If follow‐up for a case was available, cytogenetic centres differentiated between LB, natural fetal loss and TOP. To estimate the proportion of LBs among no‐TOPs, these data directly reported by clinical genetics centres can be used instead of the estimates of the study of Savva et al. The assumption is made that cases without follow‐up data are not different from cases with follow‐up. For 2018, the data from clinical genetics centres and calculations of the previous years are combined (Supplementary Information Material S3).
Second, the number of LBs with postnatal diagnosis of DS are collected. For the period 2014–2018, all eight clinical genetics centres reported the number of DS LBs that were diagnosed postnatally, including the year of birth. For the period 1991–2013, data of de Graaf et al. 7 were used for both prenatal and postnatal diagnoses (Supplementary Information Material S4).
2.3. TOPs and reduction percentage
Not all pregnancies are terminated after prenatal DS diagnosis, as some women decide to continue the pregnancy. Between 2007 and 2017, the average percentage of reported TOPs out of the prenatal diagnoses of DS was calculated. This percentage was applied to the number of prenatal DS diagnoses in 2018 (Supplementary Information Material S5).
The proportion of the decrease in DS LBs resulting from TOPs is called the reduction percentage and calculated as: 1 minus (actual DS LB prevalence/adjusted total DS prevalence) ×100% (Supplementary Information Material S5). The meaning of adjusted total DS prevalence is explained in the next section.
2.4. Non‐selective and adjusted total DS prevalence
Non‐selective DS prevalence is the DS prevalence that would have occurred in the absence of DS‐related TOPs, as estimated on the basis of maternal ages in the general population. To estimate the annual number of expected children with DS, the number of women that delivered a live‐born child in each age category was multiplied by age‐specific risk for DS and, subsequently, the sum of all maternal age categories was calculated. The maternal age‐specific risks for DS proposed by Morris et al. 23 , 24 were used. This is the most recent model and based on the largest data set. Furthermore, data from Morris et al. 23 , 24 provide some evidence to show that the risk does not continue to increase exponentially for women over age 45 as previously assumed. Data on maternal age at birth and total LBs in the Netherlands were derived from Statistics Netherlands (CBS) (Supplementary Information Material S6).
Adjusted total DS prevalence is the DS prevalence that would have occurred in the absence of DS‐related TOPs, as estimated with the postnatal diagnoses (by year of birth) and prenatal diagnoses (by year of assessment). To estimate the adjusted total number of DS LBs, number of prenatal diagnoses has to be corrected for natural pregnancy loss that would have occurred between time of prenatal diagnosis and expected date of delivery, in the absence of TOPs 7 , 22 (Supplementary Information Material S7).
If there is a high ascertainment of the prenatal diagnoses of the WPDT and postnatal diagnoses of cytogenetic centres, non‐selective DS prevalence and adjusted total DS prevalence should be almost identical.
2.5. Statistics
Categorical variables were reported as frequencies (%). Continuous variables were reported as mean with standard deviation. Linear regression analyses were used to analyse time trends in DS LB prevalence and reduction percentage of DS LBs. The Chow breakpoint test was performed to identify whether there had been a structural change in LB prevalence and reduction percentage after the introduction of NIPT as a second‐tier test (2014) and first‐tier test (2018) (Supplementary Information Material S8). Statistical analyses were performed using IBM SPSS26.0 and STATA. p < 0.05 was considered statistically significant.
3. RESULTS
Table 1 summarises the estimates for DS LBs with postnatal diagnosis, DS LBs with prenatal diagnosis, total DS LBs, number of LBs in general population, DS LB prevalence and reduction percentage between 1991 and 2018.
TABLE 1.
LBs after postnatal diagnosis of DS, LBs after prenatal diagnosis of DS, total number of DS LBs, number of LBs in general population, actual DS LB prevalence, TOP rate and reduction percentage resulting from TOPs
| Year | LBs after postnatal diagnosis of DS | LBs after prenatal diagnosis of DS | Total number of DS LBs | Number of LBs in general population | Actual DSLB prevalence | TOP rate (%) | Reduction of DS LBs (%) a |
|---|---|---|---|---|---|---|---|
| 1991 | 227 | <3> | <230> (217–242) | 198,665 | <11.6> (10.9–12.2) | 90.6 | <26> (17–36) |
| 1992 | 272 | 4 | 276 (265–287) | 196,734 | 14.0 (13.5–14.6) | 91.4 | 19 (14–24) |
| 1993 | 263 | 5 | 268 (258–278) | 195,748 | 13.7 (13.2–14.2) | 90.8 | 20 (16–25) |
| 1994 | 263 | 5 | 268 (259–277) | 195,611 | 13.7 (13.2–14.2) | 92.6 | 23 (19–28) |
| 1995 | 236 | 7 | 243 (233–253) | 190,513 | 12.8 (12.2–13.3) | 87.8 | 27 (23–33) |
| 1996 | 241 | 11 | 252 (243–261) | 189,521 | 13.3 (12.8–13.7) | 85.2 | 28 (24–33) |
| 1997 | 262 | 11 | 273 (266–280) | 192,443 | 14.2 (13.8–14.6) | 87.9 | 27 (23–31) |
| 1998 | 283 | 10 | 293 (286–300) | 199,408 | 14.7 (14.3–15.1) | 89.2 | 27 (24–31) |
| 1999 | 269 | 8 | 277 (270–284) | 200,445 | 13.8 (13.5–14.2) | 90.9 | 28 (25–32) |
| 2000 | 279 | 11 | 290 (284–296) | 206,619 | 14.0 (13.7–14.3) | 85.7 | 28 (25–32) |
| 2001 | 301 | 12 | 313 (307–319) | 202,603 | 15.4 (15.2–15.7) | 88.0 | 27 (24–31) |
| 2002 | 310 | 12 | 322 (316–328) | 202,083 | 15.9 (15.6–16.2) | 87.6 | 28 (25–32) |
| 2003 | 268 | 10 | 278 (273–283) | 200,297 | 13.9 (13.6–14.1) | 93.9 | 35 (32–39) |
| 2004 | 250 | 11 | 261 (255–267) | 194,007 | 13.5 (13.2–13.7) | 88.9 | 38 (36–42) |
| 2005 | 267 | 20 | 287 (279–295) | 187,910 | 15.3 (14.9–15.7) | 79.3 | 35 (31–38) |
| 2006 | 227 | 23 | 250 (242–258) | 185,057 | 13.5 (13.1–13.9) | 82.4 | 37 (33–40) |
| 2007 | 226 | 23 | 249 (241–257) | 181,336 | 13.7 (13.3–14.2) | 82.1 | 38 (34–42) |
| 2008 | 224 | 22 | 246 (238–254) | 184,634 | 13.3 (12.9–13.8) | 85.4 | 41 (37–44) |
| 2009 | 240 | 18 | 258 (251–265) | 184,915 | 14.0 (13.6–14.3) | 89.3 | 41 (38–44) |
| 2010 | 200 | 18 | 218 (211–225) | 184,397 | 11.8 (11.4–12.2) | 86.6 | 46 (43–50) |
| 2011 | 182 | 20 | 202 (194–210) | 180,060 | 11.2 (10.8–11.6) | 85.1 | 47 (44–51) |
| 2012 | 210 | 23 | 233 (225–241) | 175,959 | 13.2 (12.8–13.7) | 79.5 | 41 (36–44) |
| 2013 | 205 | 24 | 229 (221–237) | 171,341 | 13.4 (12.9–13.8) | 84.5 | 42 (37–45) |
| 2014 | 174 | 23 | 197 (188–204) | 175,073 | 11,3 (10.7–11.7) | 84.6 | 49 (45–52) |
| 2015 | 173 | 22 | 195 (181–197) | 170,779 | 11,4 (10.6–11.5) | 86.4 | 49 (45–52) |
| 2016 | 196 | 18 | 214 (208–221) | 172,505 | 12,4 (12.1–12.8) | 88.1 | 46 (43–50) |
| 2017 | 168 | 21 | 189 (182–196) | 169,755 | 11,1 (10.7–11.5) | 88.1 | 52 (49–55) |
| 2018 | 139 | 28 | 167 (156–178) | 168,452 | 9,9 (9.2–10.6) | 84.8 | 56 (52–60) |
Note: Bolded data: Results of current study; non‐bolded data: Results of previous published data. 7 Values in <...> are (partly) based on trend data from preceding or following years. Values in (…) are the 95% CI.
Abbreviations: CI, confidence interval; DS, Down syndrome; LB, livebirth; TOP, termination of pregnancy.
For 1991, reduction is estimated by: 1‐(actual DS LB prevalence/non‐selective DS prevalence) × 100%. For 1992– 2018, reduction is: 1‐(actual DS LB prevalence/adjusted total DS prevalence) × 100%. Non‐selective prevalence can be found in Table S6 in Supplementary Information Material, adjusted total DS prevalence in Table S7 in Supplementary Information Material.
3.1. Actual DS LB prevalence
Actual DS LB prevalence decreased from 11.3 (95% confidence interval [CI] 10.7–11.7) per 10,000 births in 2014 (197 children) to 9.9 (95% CI: 9.2–10.6) per 10,000 births in 2018 (167 children). Evaluating trends over a longer period of time, LB prevalence increased from 11.6 per 10,000 in 1991 (230 children) to 15.9 per 10,000 in 2002 (322 children) (regression coefficient 0.246 (95% CI: 0.105–0.388; p = 0.003)). After 2002, LB prevalence gradually decreased to around 9.9 per 10,000 in 2018, as shown in Figure 1 (regression coefficient – 0.234 (95% CI: −0.338 to −0.131; p < 0.001). The result of the Chow breakpoint test revealed that no change in trend occurred in 2015 (F‐statistic 0.40; p = 0.68) or 2018 (F‐statistic 1.74; p = 0.21).
FIGURE 1.

The adjusted, non‐selective and actual livebirth prevalence of Down syndrome. FCT, first‐trimester combined test; NIPT, non‐invasive prenatal testing
3.2. LBs with DS diagnosis
As previously mentioned, the WPDT lacks information on outcomes of DS pregnancies that were not terminated—the so‐called no‐TOPs. Using natural fetal loss rates of Sava et al. to correct the no‐TOPs probably leads to an overestimation of LBs after a prenatal diagnosis, for two reasons. First, outcome of pregnancy is not known in all cases and unknown outcomes, which might include a few TOPs, will be allocated to the category of no‐TOPs in the WPDT reports. Second, some natural loss will have occurred between moment of referral for CVS or amniocentesis and time of reporting the results of prenatal diagnosis, and these losses are not taken into account in the WPDT reports. The alternative method, making use of reported results of clinical genetic centres until 2015, showed that 51% of the no‐TOPs resulted in a LB. Between 2016 and 2018, reports of cytogenetic centres were even more detailed and showed that out of the no‐TOPs after AC, 83.9% (26/31) of the prenatal diagnoses resulted in an LB, and this was 27.3% (6/22) after CVS. For 2016–2018, these latter percentages were used to calculate the number of LBs out of the no‐TOPs (Supplementary Information Material S3). As shown in Table 1, the number of LBs after postnatal DS diagnoses decreased, while the number of LBs after prenatal DS diagnoses increased further.
3.3. TOPs and reduction percentage
Between 2007 and 2017, the average percentage of reported TOPs out of the prenatal DS diagnoses was 84.8%. This percentage was applied to the number of prenatal DS diagnoses in 2018. The reduction percentage of DS LBs was estimated at around 26% in 1991 and gradually increased to 55.2% in 2018 (regression coefficient 0.012 (95% CI: 0.010–0.013; p < 0.001) (Figure 2). In the most recent years, it gradually increased from 48.6% in 2014 to 55.2% in 2018. The result of the Chow breakpoint test revealed that no change in trend occurred in 2015 (F‐statistic 0.74; p = 0.50) or 2018 (F‐statistic 2.34; p = 0.15).
FIGURE 2.

The reduction of Down syndrome livebirths resulting from termination of pregnancies. Small black vertical lines are 95% confidence intervals
3.4. Non‐selective and adjusted total DS prevalence
Non‐selective DS prevalence increased from 15.6 per 10,000 LBs in 1991 (311 children) to 23.4 per 10,000 in 2018 (395 children) (Supplementary Information Materials S6).
Adjusted total DS prevalence estimates increased from 17.2 per 10,000 LBs in 1992 (339 children) to 22.4 per 10,000 in 2018 (377 children) (Supplementary Information Materials S7). There appears to be a high ascertainment of DS diagnoses by the clinical genetics laboratories and WPDT, as non‐selective DS prevalence and adjusted total DS prevalence are almost identical (Figure 1).
3.5. Maternal age
The mean maternal age at birth slightly increased from 30.2 years in 2000 to 30.6 years in 2014 and 30.9 years in 2018 (Figure S6 in Supplementary Information Material). As maternal age is reported as a discrete variable (age at last birthday) in the CBS tables, one could add a half‐year on top of the mean maternal age. The proportion of mothers aged more than 35 years at childbirth in the general population has fluctuated over the years but has increased from 6.8% in 1990 to 16.4% in 2018 (Figure 3).
FIGURE 3.
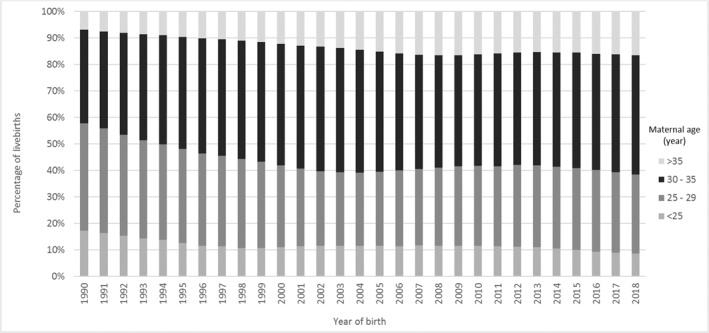
Maternal age distribution in the Netherlands, 1990–2018
4. DISCUSSION
4.1. Main findings
DS LB prevalence increased from 11.6 per 10,000 in 1991 to 15.9 per 10,000 in 2002, steadily decreasing to 11.3 per 10,000 in 2014 and 9.9 per 10,000 in 2018. The reduction of DS LBs gradually increased from 26% in 1991 to 55.2% in 2018. Introducing NIPT caused no changes in trends in DS LB prevalence and reduction percentage in the Netherlands.
4.2. Strengths and limitations
This is the first long‐term study that analyses DS LB prevalence and reduction percentage after introducing NIPT with a high ascertainment of DS by the clinical genetics centres and WPDT. Considering NIPT was recently introduced, and data are available until 2018, the possible future impact of NIPT might not yet be realised. Still our results can be a reference point for future research. Our study has several limitations. In the WPDT reports, no‐TOPs are not differentiated into LBs, natural pregnancy losses, stillbirths and unknown outcomes. Therefore, we used two different methods to estimate the proportion of LBs of the no‐TOPs: one based on an earlier study on natural fetal loss in DS, 22 the other based on (incomplete) follow‐up data of clinical genetics centres. The latter had the advantage that, if follow‐up was available, no‐TOPs were differentiated in LBs versus natural loss. These two methods led to different results (72.5% vs. 51% LBs among no‐TOPs). As the first method probably leads to an overestimation of LBs after a prenatal DS diagnosis, we used the second method. As numbers of no‐TOPs after a prenatal DS diagnosis are relatively small, the difference in estimated total number of DS LBs between the two methods is relatively small, with the same trend.
4.3. Interpretation
The rise in DS LB prevalence between 1991 and 2002 can be explained by increasing maternal age. From 2002 to 2018, the effect of increasing maternal age was counterbalanced by a growing number of elective terminations. Several reasons may explain this increase in terminations. First, uptake of prenatal screening was increased. In 2014, NIPT was introduced as a second‐tier test and FCT uptake increased from 29.5% in 2013 to 35.8% in 2016. After the introduction of first‐tier NIPT, FCT uptake in 2018 declined to 2.6%, although NIPT uptake increased to 43.4%. 25 The aim of prenatal screening is formulated as promoting reproductive choices, thereby enabling pregnant women to obtain information about the health of their unborn child in order to have the possibility to prepare for the birth of a child with a disorder or to terminate the pregnancy in case of an abnormal test‐result. Our study showed that around 85% of prenatally diagnosed DS pregnancies were followed by an abortion. Second, NIPT is more accurate than the FCT, producing far fewer false negatives. After implementing NIPT as a first‐tier test, the group that would have tested false negative with FCT, tested positive with NIPT. Third, congenital abnormalities like cardiac defects associated with DS are more often identified by fetal ultrasound and may lead to further prenatal testing for DS. 26
Fourth, the lack of availability of social and medical support programs for DS individuals may affect acceptance of prenatal screening and diagnostic tests, hence LB prevalence of the condition. However, the Netherlands has a very accessible healthcare system with well‐organised social and medical support programs for people with DS and therefore this is not expected to play a role in the increasing uptake of prenatal screening.
The introduction of NIPT has not caused a breakpoint in the trend of DS LB prevalence or reduction percentage. This may partly be explained by the strongly increased uptake of prenatal screening for women aged between 26 and 35, while for women ≥36 years, screening uptake stayed more or less constant. 27 , 28 The risk for a fetus with DS increases with the mother's age. In the absence of elective terminations, the majority of children with DS would have been born in the group of mothers aged ≥36 years. Therefore, an increase in prenatal screening uptake in younger mothers might have a lower impact on the number of prenatal diagnoses and DS LB prevalence, compared to an increase in prenatal screening uptake in older mothers.
A second explanation for the constant trends in DS LB prevalence and reduction percentage is that total prenatal screening uptake stabilised in 2017 and 2018. 25 Several factors may play a role in this stabilisation, for example, a positive attitude towards DS and a negative attitude towards TOP. 29 , 30 Furthermore, pregnant women are asked first if they want to be informed about prenatal screening options instead of providing the information (the right not to know) and there is a broad acknowledgement of women's freedom of choice. 30 Also, financial factors, that is additional costs for prenatal screening, may influence screening uptake. 18 , 29 , 30 , 31 , 32
A third reason for the absence of breakpoints in DS LB prevalence and reduction percentage is that NIPT can also be used to prepare for the birth of a child with DS. Our study has no information about the percentage of pregnant women with a positive NIPT result that declined prenatal invasive follow‐up diagnostics and continue with the pregnancy. Schendel et al. 33 showed that of women choosing NIPT after a positive FCT result, 58% reported the intention to terminate a pregnancy if DS is diagnosed. Perhaps NIPT as a primary screening test is more attractive to parents that want to prepare for the possible birth of a child with a disability because it is far more precise than FCT. This may partially explain the increase in screening uptake. 34
The absence of an abrupt decline in DS LB prevalence may furthermore be explained by continuation of postponing motherhood, resulting in a gradually increasing prevalence of DS pregnancies.
Taking everything into account, further decreasing DS LB prevalence seems to be the result of a broader development of more prenatal testing that started in 2002, and not a sudden result of the introduction of NIPT.
NIPT has been widely adopted across different continents, but only a few countries have developed a national policy. In Europe, two countries (Belgium and the Netherlands) offer NIPT for all pregnant women, while other countries mainly offer NIPT to higher‐risk women after FCT. 21 Since July 2017, NIPT is fully reimbursed in Belgium. The uptake is above 75%, much higher than in the Netherlands. The fee in the Netherlands could be inhibitory for some women and this might (partly) explain the difference in NIPT uptake between these two countries; however, value‐related reasons were predominant in declining screening in the Netherlands. 21 , 29 An annual report of the Flanders region showed that DS LB prevalence has steeply decreased from 6.6 per 10,000 LBs in 2017 to 4.4 in 2018. 35 Very recently, a Belgian study collected all neonatal genetic test results for DS and observed a decline from 77 DS LBs (0.06% of LBs) in 2014 to 52 DS LBs (0.04% of LBs) in 2018. 36 However, it is unclear how LBs after prenatal DS diagnosis were taken into account. Furthermore, no long‐term trends in reduction percentage, non‐selective DS prevalence or actual DS LB prevalence are given. Differences in prenatal screening programmes and policies around abortion, as well as cultural differences between countries, lead to wide variations in DS LB prevalence. 3 , 11 , 37 , 38
However, recent trends in DS LB prevalence have not yet been analysed, making the impact of NIPT unclear. Although our findings are based on Dutch data, they may have important implications for other countries with or without national screening programmes. First, this study shows how to calculate DS LB prevalence in the absence of a national registration program, assuming numbers of prenatal and postnatal cytogenetic diagnoses and follow‐up data are available. De Groot‐van der Mooren et al. 8 also estimated DS LB prevalence between 2000 and 2013 in the Netherlands, without actual data of postnatal diagnoses. This method is less precise than the current method, but may be useful if data on postnatal diagnoses are lacking. Second, this study shows that introducing NIPT does not necessarily lead to an immediate trend change in DS LB prevalence or reduction percentage.
Further studies should investigate if this trend in DS LB prevalence influences informed decision making of parents and their freedom to choose, and if it has negative consequences for people with a disability. It is important to underline that the introduction of NIPT as a first‐tier test is very recent, and therefore future studies are needed. These should also include the impact of the free first‐trimester ultrasound screening in the coming years. Data on prenatal diagnoses should have a finer distinction in terms of pregnancy outcomes and need to be stored in a national registry of DS LBs.
5. CONCLUSION
Introducing NIPT caused no trend changes in DS LB prevalence and reduction percentage in the Netherlands. The gradual decrease in DS LB prevalence seems to be the result of a broader development of more prenatal screening and testing.
CONFLICT OF INTEREST
The authors declare that there are no conflict of interests.
Supporting information
Supplementary Information Material 1
ACKNOWLEDGEMENTS
The authors would like to thank Lia Knegt, Joanne Verweij and Annemarie de Veld‐van Heiningen of the WPDT for the annual reports of 2014–2017, and Pieter van Casteren for his advice in performing a specific part of the statistical analysis.
de Groot‐van der Mooren M, de Graaf G, Weijerman ME, et al. Does non‐invasive prenatal testing affect the livebirth prevalence of Down syndrome in the Netherlands? A population‐based register study. Prenat Diagn. 2021;41(10):1351‐1359. doi: 10.1002/pd.6003
DATA AVAILABILITY STATEMENT
The data that support the findings of this study are available from the corresponding author upon reasonable request.
REFERENCES
- 1. Eurostat . Table Mean Age of Women at Birth of First Child. 2017. https://ec.europa.eu/eurostat/. Accessed August 8, 2020.
- 2. Dolk H, Loane M, Garne E, et al. Trends and geographic inequalities in the prevalence of Down syndrome in Europe, 1980‐1999. Rev Epidemiol Sante Publique. 2005;53(2):2S87‐2S95. [PubMed] [Google Scholar]
- 3. de Graaf G, Buckley F, Skotko BG. Estimation of the number of people with Down syndrome in Europe. Eur J Hum Genet. 2021;29:402‐410. [DOI] [PMC free article] [PubMed] [Google Scholar]
- 4. Sherman SL, Allen EG, Bean LH, Freeman SB. Epidemiology of Down syndrome. Ment Retard Dev Disabil Res Rev. 2007;13(3):221‐227. [DOI] [PubMed] [Google Scholar]
- 5. McDonnell R, Monteith C, Kennelly M, et al. Epidemiology of chromosomal trisomies in the East of Ireland. J Public Health. 2017;39(4):e145‐e151. [DOI] [PubMed] [Google Scholar]
- 6. de Graaf G, Buckley F, Dever J, Skotko BG. Estimation of live birth and population prevalence of Down syndrome in nine U.S. states. Am J Med Genet A. 2017;173(10):2710‐2719. [DOI] [PubMed] [Google Scholar]
- 7. de Graaf G, Engelen JJM, Gijsbers ACJ, et al. Estimates of live birth prevalence of children with Down syndrome in the period 1991‐2015 in the Netherlands. J Intellect Disabil Res. 2017;61(5):461‐470. [DOI] [PubMed] [Google Scholar]
- 8. de Groot‐van der Mooren MD, Tamminga S, Oepkes D, Weijerman ME, Cornel MC. Older mothers and increased impact of prenatal screening: stable livebirth prevalence of trisomy 21 in the Netherlands for the period 2000‐2013. Eur J Hum Genet. 2018;26(2):157‐165. [DOI] [PMC free article] [PubMed] [Google Scholar]
- 9. Kurtovic‐Kozaric A, Mehinovic L, Malesevic R, et al. Ten‐year trends in prevalence of Down syndrome in a developing country: impact of the maternal age and prenatal screening. Eur J Obstet Gynecol Reprod Biol. 2016;206:79‐83. [DOI] [PubMed] [Google Scholar]
- 10. Loane M, Morris JK, Addor MC, et al. Twenty‐year trends in the prevalence of Down syndrome and other trisomies in Europe: impact of maternal age and prenatal screening. Eur J Hum Genet. 2013;21(1):27‐33. [DOI] [PMC free article] [PubMed] [Google Scholar]
- 11. Maxwell S, Bower C, O'Leary P. Impact of prenatal screening and diagnostic testing on trends in Down syndrome births and terminations in Western Australia 1980 to 2013. Prenat Diagn. 2015;35(13):1324‐1330. [DOI] [PubMed] [Google Scholar]
- 12. Rudolf G, Tul N, Verdenik I, et al. Impact of prenatal screening on the prevalence of Down syndrome in Slovenia. PLoS One. 2017;12(6):e0180348. [DOI] [PMC free article] [PubMed] [Google Scholar]
- 13. Wu J, Morris JK. Trends in maternal age distribution and the live birth prevalence of Down's syndrome in England and Wales: 1938‐2010. Eur J Hum Genet. 2013;21(9):943‐947. [DOI] [PMC free article] [PubMed] [Google Scholar]
- 14. Health Council of the Netherlands . Prenatal Screening. The Hague, The Netherlands: Health Council of the Netherlands ; 2016. https://www.healthcouncil.nl/. Accessed August 8, 2020. [Google Scholar]
- 15. van der Meij KRM, Sistermans EA, Macville MVE, et al. TRIDENT‐2: national implementation of genome‐wide non‐invasive prenatal testing as a first‐tier screening test in the Netherlands. Am J Hum Genet. 2019;105(6):1091‐1101. [DOI] [PMC free article] [PubMed] [Google Scholar]
- 16. Breveglieri G, D'Aversa E, Finotti A, Borgatti M. Non‐invasive prenatal testing using fetal DNA. Mol Diagn Ther. 2019;23(2):291‐299. [DOI] [PubMed] [Google Scholar]
- 17. Committee on Genetics Society for Maternal–Fetal Medicine . Committee Opinion No. 640. Cell‐free DNA screening for fetal aneuploidy. Obstet Gynecol. 2015;126(3):e31‐e37. [DOI] [PubMed] [Google Scholar]
- 18. Kater‐Kuipers A, de Beaufort ID, Galjaard RH, Bunnik EM. Ethics of routine: a critical analysis of the concept of ‘routinisation’ in prenatal screening. J Med Ethics. 2018;44(9):626‐631. [DOI] [PubMed] [Google Scholar]
- 19. Skotko BG. With new prenatal testing, will babies with Down syndrome slowly disappear? Arch Dis Child. 2009;94(11):823‐826. [DOI] [PubMed] [Google Scholar]
- 20. Allyse M, Minear MA, Berson E, et al. Non‐invasive prenatal testing: a review of international implementation and challenges. Int J Womens Health. 2015;7:113‐126. [DOI] [PMC free article] [PubMed] [Google Scholar]
- 21. Gadsboll K, Petersen OB, Gatinois V, et al. Current use of noninvasive prenatal testing in Europe, Australia and the USA: a graphical presentation. Acta Obstet Gynecol Scand. 2020;99(6):722‐730. [DOI] [PubMed] [Google Scholar]
- 22. Savva GM, Morris JK, Mutton DE, Alberman E. Maternal age‐specific fetal loss rates in Down syndrome pregnancies. Prenat Diagn. 2006;26(6):499‐504. [DOI] [PubMed] [Google Scholar]
- 23. Morris JK, Mutton DE, Alberman E. Revised estimates of the maternal age specific live birth prevalence of Down's syndrome. J Med Screen. 2002;9(1):2‐6. [DOI] [PubMed] [Google Scholar]
- 24. Morris J, Mutton D, Alberman E. Corrections to maternal age‐specific live birth prevalence of Down's syndrome. J Med Screen. 2005;12(4):202. [DOI] [PubMed] [Google Scholar]
- 25. van der Meij KRM, de Groot‐van Mooren M, Carbo EWS, et al. Uptake of fetal aneuploidy screening after the introduction of the non‐invasive prenatal test: a national population‐based register study. Acta Obstet Gynecol Scand. 2021:1–8. [DOI] [PMC free article] [PubMed] [Google Scholar]
- 26. van Velzen CL, Ket JCF, van de Ven PM, Blom NA, Haak MC. Systematic review and meta‐analysis of the performance of second‐trimester screening for prenatal detection of congenital heart defects. Int J Gynaecol Obstet. 2018;140(2):137‐145. [DOI] [PubMed] [Google Scholar]
- 27. Liefers JFA, Atsma F. Public Monitor 2018: Prenatal Screening, page 6, fig.4 and page 7, fig.6. https://www.pns.nl/documenten/publieksmonitor‐2018‐prenatale‐screening. Accessed December 7, 2020.
- 28. Siljee J , Bom E . Quality indicators for Dutch Down syndrome screening laboratories 2013. RIVMbriefrapport 2017‐0043, page16,fig.3.
- 29. Crombag NM, Page‐Christiaens GC, Skotko BG, de Graaf G. Receiving the news of Down syndrome in the era of prenatal testing. Am J Med Genet A. 2020;182(2):374‐385. [DOI] [PubMed] [Google Scholar]
- 30. Kater‐Kuipers A, Bakkeren IM, Riedijk SR, et al. Non‐invasive prenatal testing (NIPT): societal pressure or freedom of choice? A vignette study of Dutch citizens' attitudes. Eur J Hum Genet. 2021;29(1):2‐10. [DOI] [PMC free article] [PubMed] [Google Scholar]
- 31. Bakker M, Birnie E, Pajkrt E, Bilardo CM, Snijders RJM. Low uptake of the combined test in The Netherlands—which factors contribute? Prenat Diagn. 2012;32(13):1305‐1312. [DOI] [PubMed] [Google Scholar]
- 32. Crombag NM, Vellinga YE, Kluijfhout SA, et al. Explaining variation in Down's syndrome screening uptake: comparing the Netherlands with England and Denmark using documentary analysis and expert stakeholder interviews. BMC Health Serv Res. 2014;14:437. [DOI] [PMC free article] [PubMed] [Google Scholar]
- 33. van Schendel RV, Page‐Christiaens GC, Beulen L, et al. Trial by Dutch laboratories for evaluation of non‐invasive prenatal testing. Part II‐women's perspectives. Prenat Diagn. 2016;36(12):1091‐1098. [DOI] [PMC free article] [PubMed] [Google Scholar]
- 34. Hill M, Barrett A, Choolani M, Lewis C, Fisher J, Chitty LS. Has noninvasive prenatal testing impacted termination of pregnancy and live birth rates of infants with Down syndrome? Prenat Diagn. 2017;37(13):1281‐1290. [DOI] [PMC free article] [PubMed] [Google Scholar]
- 35. Devlieger R, Goemaes R, Laubach M, Jaarboek van het Vzw Studiecentrum voor Perinatale Epidemiologie. Perinatale Activiteiten in Vlaanderen. 2018. https://www.zorg‐en‐gezondheid.be/. Accessed December 2, 2020. [Google Scholar]
- 36. Van Den Bogaert K, Lannoo L, Brison N, et al. Outcome of publicly funded nationwide first‐tier noninvasive prenatal screening. Genet Med. 2021;23:1137‐1142. [DOI] [PubMed] [Google Scholar]
- 37. Lou S, Petersen OB, Jorgensen FS, et al. National screening guidelines and developments in prenatal diagnoses and live births of Down syndrome in 1973‐2016 in Denmark. Acta Obstet Gynecol Scand. 2018;97(2):195‐203. [DOI] [PubMed] [Google Scholar]
- 38. de Graaf G, Buckely F, Skotko BG. People Living With Down Syndrome in the USA: BIRTHS and POPULATION. https://assets.cdn.down‐syndrome.org/files/reports/research/births‐prevalence/usa/down‐syndrome‐population‐usa‐factsheet‐202002.pdf. Accessed December 5, 2020. [Google Scholar]
Associated Data
This section collects any data citations, data availability statements, or supplementary materials included in this article.
Supplementary Materials
Supplementary Information Material 1
Data Availability Statement
The data that support the findings of this study are available from the corresponding author upon reasonable request.