

Abstract
Objectives
To validate novel dedicated 3D‐QCA based on the software to calculate post PCI vessel‐FFR (vFFR) in a consecutive series of patients, to assess the diagnostic accuracy, and to assess inter‐observer variability.
Background
Low post percutaneous coronary intervention (PCI) fractional flow reserve (FFR) predicts future adverse cardiac events. However, FFR assessment requires the insertion of a pressure wire in combination with the use of a hyperemic agent.
Methods
FAST POST study is an observational, retrospective, single‐center cohort study. One hundred patients presenting with stable angina or non ST‐elevation myocardial infarction, who underwent post PCI FFR assessment using a dedicated microcatheter were included. Two orthogonal angiographic projections were acquired to create a 3D reconstruction of the coronary artery using the CAAS workstation 8.0. vFFR was subsequently calculated using the aortic root pressure.
Results
Mean age was 65±12 years and 70% were male. Mean microcatheter based FFR and vFFR were 0.91±0.07 and 0.91±0.06, respectively. A good linear correlation was found between FFR and vFFR (r = 0.88; p <.001). vFFR had a higher accuracy in the identification of patients with FFR values <0.90, AUC 0.98 (95% CI: 0.96‐1.00) as compared with 3D‐QCA AUC 0.62 (95% CI: 0.94‐0.74). Assessment of vFFR had a low inter‐observer variability (r = 0.95; p <.001).
Conclusion
3D‐QCA derived post PCI vFFR correlates well with invasively measured microcatheter based FFR and has a high diagnostic accuracy to detect FFR <0.90 with low inter‐observer variability.
Keywords: coronary angiography, fractional flow reserve, quantitative coronary angiography
1. INTRODUCTION
In contrast to fractional flow reserve (FFR), coronary angiography has limited ability to accurately assess the hemodynamic significance of coronary stenosis. 1 , 2 , 3 , 4 , 5 , 6 Furthermore, FFR post PCI is a strong and independent predictor of major adverse cardiac events (MACE) up to 2 years. 7 , 8 , 9 However, despite unequivocal evidence supporting the use of FFR to guide clinical decision‐making, adoption into routine practice has been limited, and in particular, FFR assessment after stenting is rarely performed. The latter illustrates the need for tools that allow simple and fast post PCI physiological assessment without the need for a pressure wire and hyperemic agent.
Vessel FFR (vFFR) as assessed by three‐dimensional quantitative coronary angiography (3D‐QCA) proved to have a high correlation with FFR and a high diagnostic accuracy to detect FFR ≤0.80 and a low inter‐observer variability. 10
The aim of the present study was to validate 3D‐QCA based vFFR with microcatheter based FFR post stenting in a consecutive series of patients, assess the diagnostic accuracy to detect an FFR <0.90, and determine inter‐observer variability.
2. MATERIALS AND METHODS
The FAST POST (Fast Assessment of STenosis severity POST PCI) study is an observational, single‐center cohort study with the aim to assess the diagnostic accuracy of offline post PCI vFFR assessment as compared with invasively measured FFR using the Acist Navvus rapid exchange FFR (ACIST Medical Systems) microcatheter.
Based on the findings of the FAST I trial (n=100), a sample of 100 patients was selected from the FFR SEARCH registry to validate post PCI vFFR. FFR SEARCH registry was a prospective registry in which FFR measurements were routinely performed after angiographically successful PCI in 1000 consecutive patients between March 2016 and May 2017. Patients referred for coronary angiography with at least one hemodynamically significant stenosis who underwent PCI with stenting were eligible. Inclusion criteria for the present study were age ≥18 years and presentation with either stable or unstable angina or non ST‐elevation myocardial infarction. Angiographic inclusion criteria study were, at least one significant stenosis in one of the epicardial coronary arteries (diameter stenosis of >70% on QCA or hemodynamically significant stenosis defined as FFR ≤0.80). Exclusion criteria were patients with ST‐elevation myocardial infarction (STEMI), coronary bypass grafts (CABG), cardiogenic shock or severe hemodynamic instability, and adenosine intolerance. The sample of 100 patients for the present study was derived from a consecutive cohort of the 200 most recent patients in the FFR SEARCH registry. The majority of the patients were excluded due to STEMI. Furthermore, patients with inadequate pressure waveform or lack of two adequate orthogonal view to create a 3D reconstruction of the vessel, were excluded, Figure 1. The significant percentage of cases that had to be excluded due to a lack of qualifying angiograms should be put into perspective to procedures that were performed in routine practice with a lack of focus on post PCI vFFR.
FIGURE 1.
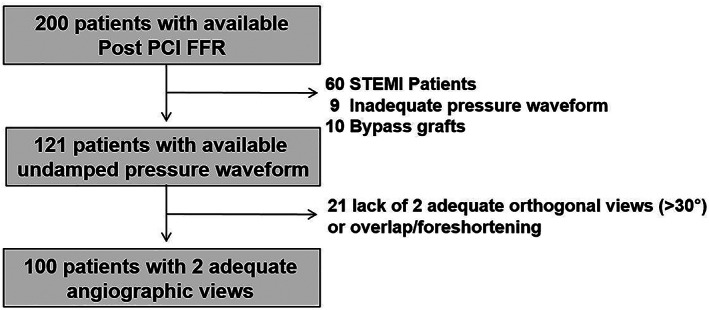
Flowchart of all included and excluded patients
All procedures were performed according to standard local routine clinical practice. FFR was defined as mean distal coronary artery pressure divided by mean aortic pressure during maximum hyperemia achieved by continuous intravenous infusion of adenosine at a rate of 140 μg kg‐1min‐1 through an antecubital vein. Post PCI FFR assessment was performed using the Acist Navvus microcatheter, 2 cm distal from the most distal stent‐edge. Subsequently, two standard monoplane angiographic projections (at least 30° apart, preferably orthogonal) were performed after a bolus of 200 mcg nitroglycine. An additional projection was recorded with the Navvus catheter in situ to capture the position of the device. Aortic root pressure was constantly recorded, the pressure measurement taken before the start of the FFR measurement was used as input in the CAAS/vFFR software. Angiograms and pressure waveforms were stored as DICOM image format for offline analyses.
We recently reported the methodology of vFFR calculation. 10 vFFR computation was performed offline by 2 independent observers, blinded to the invasive post PCI FFR measurement, in order to assess inter‐observer variability (KM, MB). A total of three 2D images were exported to the CAAS workstation 8.0 (Pie Medical Imaging, Maastricht, The Netherlands) that used the same algorithms for vFFR computation as previously described. 10 Two views with at least 30° differences in rotation/angulation to create a 3D reconstruction of the coronary arteries and one view to determine the position of the FFR pressure wire. Within CAAS workstation vFFR, the pressure drop is calculated instantaneously by applying physical laws including viscous resistance and separation loss effects present in coronary flow behavior, as described by Gould and Kirkeeide. 11 , 12 The methods; however, are based on a single angiographic projection. Within CAAS vFFR, the geometry of the coronary artery is derived from well‐validated 3D reconstructions, 13 , 14 which reduces the effects of foreshortening, out of plane magnification, and nonsymmetric coronary lesions.
The two independent observers used the same cine‐images for the calculation of vFFR. Although temporal alignment of the cardiac cycle between the two angiograms was performed automatically by ECG triggering, manual frame selection was allowed. Contour detecting was performed semi‐automatically, delineating the vessel contour from the ostium to the most distal position of the Navvus catheter. The percent diameter stenosis, minimal lumen diameter, reference lumen diameter, minimal lumen area, and lesion length were measured from the same 3D model as in which the vFFR was determined. vFFR was calculated automatically integrating the invasively measured aortic root pressure and the automatically generated 3D QCA dimensions. Based on well‐validated 3D coronary reconstruction, 13 , 14 CAAS Workstation generated a 3D coronary reconstruction using two different angiographic projections. vFFR was calculated instantaneously with a proprietary algorithm, which incorporates the morphology of the 3D coronary reconstruction and routinely measured real‐time aortic pressure.
2.1. Statistical analysis
Continuous variables are presented as mean ± standard deviation. All continuous variables were normally distributed. Categorical variables are expressed as counts and percentages. All statistical tests are two‐tailed. Pearson's correlation coefficient (r) was used to assess the relationship between FFR and vFFR and to assess inter‐observer variability. Agreement between the indices and the inter‐observer variability were assessed by Bland‐Altman plots with corresponding 95% limits of agreement. Receiver‐operating characteristic (ROC) area under the curve (AUC) analysis was used to estimate the diagnostic performance of both vFFR and 3D QCA‐based diameter stenosis as compared with the microcatheter‐based FFR with a threshold of <0.90, which has been used in previous studies as an arbitrary cut‐off value to predict clinical outcome. 1 , 5 , 8 Statistical analysis was carried out using the SPSS statistical package version 24 (IBM, Armonk, North Castle, NY).
3. RESULTS
Baseline and procedural characteristics are summarized in Table 1 . Mean age was 65±12 years and the majority of patients were male (70%). Diabetes was present in 21% of the cases. A prior myocardial infarction (MI) or PCI was present in 26% and 33% of the patients, respectively. In 50% of the cases, the FFR measurement was performed in the left anterior descending artery. Mean 3D QCA‐based diameter stenosis post PCI was 11±15% with a reference vessel diameter of 3.0±0.6 mm.
TABLE 1.
Baseline characteristics
| Age, y, mean ± SD | Total N = 100 |
| 65 ± 12 | |
| Male sex, n (%) | 70 (70) |
| Cardiovascular risk factors, n (%) | |
| Hypertension | 59 (59) |
| Hyperlipidemia | 53 (53) |
| Diabetes mellitus | 21 (21) |
| Current smoker | 30 (30) |
| Medical history and co‐morbidity | |
| Prior ACS, n (%) | 26 (26) |
| Prior PCI, n (%) | 33 (33) |
| Peripheral artery disease, n (%) | 8 (8) |
| Creatinin, μmol/L, μmol/L, mean ± SD | 99 (84) |
| Hemoglobine, (mmol/L), mean ± SD | 8.7 (1.0) |
| BMI, mean±SD | 24 ± 4 |
| Measured vessel, n (%) | |
| Left main stem | 6 (6) |
| Left anterior descending artery | 50 (50) |
| Left circumflex artery | 22 (22) |
| Right coronary artery | 22 (22) |
| 3D‐Quantitative coronary angiography, mean ± SD | |
| Lesion length, mm | 10.5 ± 10 |
| Minimal lumen diameter, mm | 2.7 ± 0.7 |
| Reference vessel diameter, mm | 3.0 ± 0.6 |
| Diameter stenosis, % | 11 ± 15 |
| Indices, mean ± SD | |
| Pd/Pa | 0.96 (0.04) |
| FFR | 0.91 (0.07) |
| vFFR | 0.91 (0.06) |
Note: values are n, mean ± SD of n (%); ACS, acute coronary syndrome; BMI, body mass index; FFR, fractional flow reserve; PCI, percutaneous coronary intervention; SD, standard deviation; vFFR, vessel fractional flow reserve.
Mean distal coronary artery pressure to mean aortic pressure in the resting state during the whole cardiac cycle (Pd/Pa) was 0.96 ±0.04. Mean FFR and vFFR were 0.91±0.07 and 0.91±0.06, respectively Table 1. A good linear correlation was found between FFR and vFFR (r = 0.88; p<.001), Figure 2. Assessment of vFFR had a low inter‐observer variability (r = 0.95; p<.001), Figure 3. vFFR had a higher accuracy in the identification of patients with FFR values <0.90, AUC 0.98 (95% CI: 0.96‐1.00) as compared with 3D‐QCA AUC 0.62 (95% CI: 0.94‐0.74), Figure 4.
FIGURE 2.

Scatter plot showing the relationship between vessel‐FFR (vFFR) and invasive measured FFR using a rapid exchange microcatheter (FFR) (a) and Bland–Altman plots of differences against the means (b). The mean bias is represented by the solid red line and the 95% confidence interval is represented by the dashed lines. FFR, fractional flow reserve; vFFR, vessel fractional flow reserve [Color figure can be viewed at wileyonlinelibrary.com]
FIGURE 3.

Scatter plot (a) and Bland–Altman analysis of inter‐observer variability (b). The mean bias is represented by the solid red line and the 95% confidence interval is represented by the dashed lines [Color figure can be viewed at wileyonlinelibrary.com]
FIGURE 4.

ROC curves for vFFR and 3D‐QCA. Comparison is made with an FFR at a cut point of 0.89 as shown in Table 1. 3D‐QCA, three dimensional quantitative coronary angiography; vFFR, vessel fractional flow reserve [Color figure can be viewed at wileyonlinelibrary.com]
A vFFR threshold of <0.90 was associated with a sensitivity and specificity of 80% and 97%, respectively to identify FFR <0.90. The positive predictive value (PPV) and negative predictive value (NPV) were 94 % and 88%, respectively.
4. DISCUSSION
The main findings of the FAST POST study can be summarized as follows: (a) vFFR allows to identify post PCI FFR <0.90 with a high diagnostic accuracy (b) vFFR, showed good correlation and agreement with post PCI FFR as measured using a dedicated microcatheter and (c) post PCI vFFR computation has a low inter‐observer variability.
Pre‐PCI FFR has become an important tool in detecting hemodynamically significant lesions in patients with stable and unstable coronary artery disease and FFR‐guided PCI proved to significantly improve PCI outcomes as compared with angiography guided PCI alone. 4 , 5 , 15 , 16 , 17
There has been increasing interest in the assessment of post PCI FFR since several studies demonstrated an increased risk of MACE in patient with low pressure wire‐based post‐PCI FFR. In contrast to the generally accepted pre PCI FFR cutoff of 0.80, there is at present no generally accepted number related to post PCI assessment. Previous studies; however, demonstrated that the optimal threshold to predict clinical outcome appeared to be around 0.90. 18 , 19 , 20 , 21 , 22 , 23 , 24 , 25 , 26 The clinical relevance of the latter was recently strengthened by the results of the FFR‐SEARCH registry, the largest microcatheter‐based post PCI FFR study thus far, demonstrating that up to 56% of the patients had at least one lesion with a post PCI FFR ≤0.90 despite adequate angiographic results. 27 Almost 11% of the patients had at least one lesion with a post PCI FFR ≤0.80, a number that confirmed previous studies showing post PCI FFR rates ≤0.80 in 6% to 9.5% of the cases but was significantly higher as compared with findings from the DK‐CRUSH VII study (4%). 18 22 , 28 Two more recent studies conversely showed post PCI FFR rates ≤0.80 in even 18.5% and 36.5% of the cases, respectively. 29 , 30 Differences in these rates have been explained by differences in baseline characteristics and linked to more complex lesion phenotypes like bifurcations, extensive calcification and diffuse disease, CTO, LAD lesions or in‐stent restenosis (low post PCI FFR) and prior MI, presence of diabetes or presentation with ACS (higher post PCI FFR). Finally, clear differences might arise from the position of the pressure sensor distal to the stented segment. In the present study post, PCI FFR was measured 2 cm distal from the most distal stent edge whereas in the studies of Uretsky et al and Lee et al, the pressure wire was advanced to the distal artery with the pressure transducer at a site with a diameter large enough to accept a currently available stent (≥2 mm).
A dedicated IVUS substudy of FFR‐SEARCH demonstrated that residual proximal or distal lesions, or stent related problems including underexpansion, malapposition and edge dissections, or hematomas were present in 84% of the patients with a post PCI FFR ≤0.85, despite adequate angiographic results. 31
Nevertheless, despite strong recommendations and increasing evidence on the cost‐effectiveness of FFR in case of pre‐treatment lesion assessment, FFR is still underused in clinical practice. 32 , 33 This reality has been linked to reimbursement issues, the need for hyperemic agents like adenosine and possible concomitant adverse events like dyspnea, chest pain, rhythm disturbances, and hypotension. 34 , 35 Although the use of post PCI iFR has emerged as a nonhyperemic faster and easier method to evaluate post stenting physiological results, the need for a pressure wire remains a fact. 36 Moreover, in a number of cases, pressure wires that are used pre procedurally might get damaged and are often replaced during the course of the PCI, which mitigates their user‐friendliness in a post PCI setting. While the use of FFR microcatheters might solve part of this issue, the search toward less invasive methods to assess coronary physiology continues and several studies assessed the potential value of FFR derived from three‐dimensional quantitative coronary angiography (3D‐QCA) and computational flow modeling. 37 , 38
In the FAST I study, we recently demonstrated a good correlation between vFFR using CAAS 8.0 and pre PCI FFR measured using a conventional pressure wire along with a low inter‐observer variability. 10 Similar results were found in the FAVOR studies using computational approaches to derive FFR from diagnostic coronary angiography (QFR) based on frame counting and contrast flow models as well as FFRangio, (CathWorks), which allows functional angiographic mapping of the entire coronary tree. 39 , 40 , 41 The PIONEER QFR substudy assessed the difference of QFR immediately post stenting and at nine months follow‐up between two different drug eluting stents and reported that the QFR did not differ between the groups. 42 The HAWKEYE study investigated the prognostic value of post PCI QFR and reported that lower values of post stenting QFR predict clinical outcome. 43 However, in none of both studies pressure wire or microcatheter based FFR data were available as a reference. The present study is the first to validate vFFR against microcatheter based FFR in a post PCI setting. In the present study, we were able to show an excellent correlation between vFFR and invasively measured FFR using a dedicated microcatheter and a high diagnostic accuracy to detect post PCI FFR <0.90. Interestingly, given the fact that the present population solely consisted of patients with optimal angiographic results, vFFR proved to be <0.90 in 41% of the cases. The present findings are at clear odds with recently reported data by Pizzato et al, who reported a weak correlation between vFFR and pressure wire based FFR. 44 However, several methodological and anatomic differences between both studies should be highlighted. At first, vFFR computation is based on aortic pressure. No mentioning about this step was made by Pizzato et al. It is unlikely the authors were able to retrospectively retrieve accurate real‐time aortic pressures from >50 centers. If inadequate, a poorer correlation could be explained. Second, angiographic lesion severity was clearly different in both studies (53% vs. 37% in FAST I). The latter is however, less likely to explain potential differences in accuracy.
Based on the results of the present study, the calculation of post stenting vFFR using the CAAS Workstation could be a useful tool to identify and potentially optimize the outcomes of patients at higher risk for future adverse cardiac events. Previous studies have shown that post stenting FFR reclassified 20% of angiographically satisfactory lesions, which required further intervention thereby providing an opportunity for complete functional optimization at the time of the index procedure. 45 Larger clinical outcome studies are warranted to assess the practicalities and value of angiography‐based post PCI FFR and its potential to optimize long‐term outcomes.
5. LIMITATIONS
Our study reflects a single‐center experience with a relatively small patient sample size. The vFFR was compared with FFR using the Acist Navvus microcatheter. Microcatheter based FFR correlated well with conventional pressure‐wire wire based FFR. The latter findings should be interpreted in the light of a known overestimation of microcatheter based FFR as compared with routine pressure wire based FFR recordings of approximately 0.03 reported in previous studies that was mainly linked to larger differences in smaller caliber vessels. 46 , 47 Furthermore, vFFR calculation was performed off‐line by two independent observers, there was no independent core‐lab involved. Both online and independent corelab adjudication of vFFR will be performed in the ongoing international multicenter FAST II study (ClinicalTrials.gov ID: NCT03791320). Furthermore, the accuracy of the technique is strongly dependent on the quality of the angiographic cine‐images. Image acquisition should meet the criteria of nonoverlapping images with at least 30° differences in angulation. Although these are pre‐requisites that theoretically should be fulfilled in all pre procedural angiographies, previous studies showed that up to 65% of routine angiograms are of insufficient quality to be used in angiography‐based FFR software due to insufficient luminal contrast opacification, overlap, or lack of adequate orthogonal views. Also costs of angio based FFR are currently a topic of debate between software vendors, hospitals, and health care reimbursement plans. No definitive universal pricing models have been made for the different software packages available. Finally, the average FFR in the present cohort was relatively high, directly related to the post PCI nature of the patient cohort. Yet, still 41% had a post PCI vFFR of <0.90.
6. CONCLUSION
The 3D‐QCA derived vFFR post PCI correlates well with invasively measured microcatheter based FFR and has a high diagnostic accuracy to detect FFR <0.90 with low inter‐observer variability.
Masdjedi K, van Zandvoort LJ, Balbi MM, et al. Validation of novel 3‐dimensional quantitative coronary angiography based software to calculate fractional flow reserve post stenting. Catheter Cardiovasc Interv. 2021;98:671–677. 10.1002/ccd.29311
REFERENCES
- 1. De Bruyne B, Pijls NH, Kalesan B, et al. Fractional flow reserve‐guided PCI versus medical therapy in stable coronary disease. N Engl J Med. 2012;367(11):991‐1001. [DOI] [PubMed] [Google Scholar]
- 2. Lindstaedt M, Spiecker M, Perings C, et al. How good are experienced interventional cardiologists at predicting the functional significance of intermediate or equivocal left main coronary artery stenoses? Int J Cardiol. 2007;120(2):254‐261. [DOI] [PubMed] [Google Scholar]
- 3. Neumann FJ, Sousa‐Uva M, Ahlsson A, et al. ESC/EACTS Guidelines on myocardial revascularization. Eur Heart J. 2019;40(2):87–165. [DOI] [PubMed] [Google Scholar]
- 4. Pijls NH, van Schaardenburgh P, Manoharan G, et al. Percutaneous coronary intervention of functionally nonsignificant stenosis: 5‐year follow‐up of the DEFER study. J Am Coll Cardiol. 2007;49(21):2105‐2111. [DOI] [PubMed] [Google Scholar]
- 5. Tonino PA, De Bruyne B, Pijls NH, et al. Fractional flow reserve versus angiography for guiding percutaneous coronary intervention. N Engl J Med. 2009;360(3):213‐224. [DOI] [PubMed] [Google Scholar]
- 6. Tu S, Echavarria‐Pinto M, von Birgelen C, et al. Fractional flow reserve and coronary bifurcation anatomy: a novel quantitative model to assess and report the stenosis severity of bifurcation lesions. JACC Cardiovasc Interv. 2015;8(4):564‐574. [DOI] [PubMed] [Google Scholar]
- 7. Wolfrum M, Fahrni G, de Maria GL, et al. Impact of impaired fractional flow reserve after coronary interventions on outcomes: a systematic review and meta‐analysis. BMC Cardiovasc Disorders. 2016;16(1):177. [DOI] [PMC free article] [PubMed] [Google Scholar]
- 8. Rimac G, Fearon WF, De Bruyne B, et al. Clinical value of post‐percutaneous coronary intervention fractional flow reserve value: a systematic review and meta‐analysis. Am Heart J. 2017;183:1‐9. [DOI] [PubMed] [Google Scholar]
- 9. Kasula S, Agarwal SK, Hacioglu Y, et al. Clinical and prognostic value of poststenting fractional flow reserve in acute coronary syndromes. Heart. 2016;102(24):1988‐1994. [DOI] [PubMed] [Google Scholar]
- 10. Masdjedi K, van Zandvoort LJC, Balbi MM, et al. Validation of 3‐dimensional quantitative coronary angiography based software to calculate fractional flow reserve: fast assessment of STenosis severity (FAST)‐study. EuroIntervention. 2020;16(7):591–599. [DOI] [PubMed] [Google Scholar]
- 11. Gould KL, Kelley KO, Bolson EL. Experimental validation of quantitative coronary arteriography for determining pressure‐flow characteristics of coronary stenosis. Circulation. 1982;66(5):930‐937. [DOI] [PubMed] [Google Scholar]
- 12. Kirkeeide R. Coronary Obstructions, Morphology and Physiologic Significance. Quantitative Coronary Arteriography. Kluwer Academic Publishers: J.H.C. Reiber and P.W. Serruys; 1991:229–244. [Google Scholar]
- 13. Girasis C, Schuurbiers JC, Muramatsu T, et al. Advanced three‐dimensional quantitative coronary angiographic assessment of bifurcation lesions: methodology and phantom validation. EuroIntervention. 2013;8(12):1451‐1460. [DOI] [PubMed] [Google Scholar]
- 14. Schuurbiers JC, Lopez NG, Ligthart J, et al. In vivo validation of CAAS QCA‐3D coronary reconstruction using fusion of angiography and intravascular ultrasound (ANGUS). Catheter Cardiovasc Interv. 2009;73(5):620‐626. [DOI] [PubMed] [Google Scholar]
- 15. Berger A, Botman KJ, MacCarthy PA, et al. Long‐term clinical outcome after fractional flow reserve‐guided percutaneous coronary intervention in patients with multivessel disease. J Am Coll Cardiol. 2005;46(3):438‐442. [DOI] [PubMed] [Google Scholar]
- 16. Pijls NH, Fearon WF, Tonino PA, et al. Fractional flow reserve versus angiography for guiding percutaneous coronary intervention in patients with multivessel coronary artery disease: 2‐year follow‐up of the FAME (fractional flow reserve versus angiography for multivessel evaluation) study. J Am Coll Cardiol. 2010;56(3):177‐184. [DOI] [PubMed] [Google Scholar]
- 17. Sels JW, Tonino PA, Siebert U, et al. Fractional flow reserve in unstable angina and non‐ST‐segment elevation myocardial infarction experience from the FAME (fractional flow reserve versus angiography for multivessel evaluation) study. JACC Cardiovasc Interv. 2011;4(11):1183‐1189. [DOI] [PubMed] [Google Scholar]
- 18. Pijls NH, Klauss V, Siebert U, et al. Coronary pressure measurement after stenting predicts adverse events at follow‐up: a multicenter registry. Circulation. 2002;105(25):2950‐2954. [DOI] [PubMed] [Google Scholar]
- 19. Johnson NP, Toth GG, Lai D, et al. Prognostic value of fractional flow reserve: linking physiologic severity to clinical outcomes. J Am Coll Cardiol. 2014;64(16):1641‐1654. [DOI] [PubMed] [Google Scholar]
- 20. Ishii H, Kataoka T, Kobayashi Y, et al. Utility of myocardial fractional flow reserve for prediction of restenosis following sirolimus‐eluting stent implantation. Heart Vessels. 2011;26(6):572‐581. [DOI] [PubMed] [Google Scholar]
- 21. Nam CW, Hur SH, Cho YK, et al. Relation of fractional flow reserve after drug‐eluting stent implantation to one‐year outcomes. Am J Cardiol. 2011;107(12):1763‐1767. [DOI] [PubMed] [Google Scholar]
- 22. Agarwal SK, Kasula S, Almomani A, et al. Clinical and angiographic predictors of persistently ischemic fractional flow reserve after percutaneous revascularization. Am Heart J. 2017;184:10‐16. [DOI] [PubMed] [Google Scholar]
- 23. Doh JH, Nam CW, Koo BK, et al. Clinical relevance of poststent fractional flow reserve after drug‐eluting stent implantation. J Invasive Cardiol. 2015;27(8):346‐351. [PubMed] [Google Scholar]
- 24. Kimura Y, Tanaka N, Okura H, et al. Characterization of real‐world patients with low fractional flow reserve immediately after drug‐eluting stents implantation. Cardiovasc Interv Ther. 2016;31(1):29‐37. [DOI] [PubMed] [Google Scholar]
- 25. Leesar MA, Satran A, Yalamanchili V, Helmy T, Abdul‐Waheed M, Wongpraparut N. The impact of fractional flow reserve measurement on clinical outcomes after transradial coronary stenting. EuroIntervention. 2011;7(8):917‐923. [DOI] [PubMed] [Google Scholar]
- 26. Wolfrum M, Fahrni G, de Maria GL, et al. Impact of impaired fractional flow reserve after coronary interventions on outcomes: a systematic review and meta‐analysis. BMC Cardiovasc Disord. 2016;16(1):177. [DOI] [PMC free article] [PubMed] [Google Scholar]
- 27. van Bommel RJ, Masdjedi K, Diletti R, et al. Routine fractional flow reserve measurement after percutaneous coronary intervention. Circ Cardiovasc Interv. 2019;12(5):e007428. [DOI] [PubMed] [Google Scholar]
- 28. Li SJ, Ge Z, Kan J, et al. Cutoff value and long‐term prediction of clinical events by FFR measured immediately after implantation of a drug‐eluting stent in patients with coronary artery disease: 1‐ to 3‐year results from the dkcrush vii registry study. JACC Cardiovasc Interv. 2017;10(10):986‐995. [DOI] [PubMed] [Google Scholar]
- 29. Uretsky BF, Agarwal SK, Vallurupalli S, et al. Prospective evaluation of the strategy of functionally optimized coronary intervention. J Am Heart Assoc. 2020;9(3):e015073. [DOI] [PMC free article] [PubMed] [Google Scholar]
- 30. Lee JM, Hwang D, Choi KH, et al. Prognostic implications of relative increase and final fractional flow reserve in patients with stent implantation. JACC Cardiovasc Interv. 2018;11(20):2099‐2109. [DOI] [PubMed] [Google Scholar]
- 31. van Zandvoort LJC, Masdjedi K, Witberg K, et al. Explanation of postprocedural fractional flow reserve below 0.85. Circ Cardiovasc Interv. 2019;12(2):e007030. [DOI] [PubMed] [Google Scholar]
- 32. Siebert U, Arvandi M, Gothe RM, et al. Improving the quality of percutaneous revascularisation in patients with multivessel disease in Australia: cost‐effectiveness, public health implications, and budget impact of FFR‐guided PCI. Heart Lung Circ. 2014;23(6):527‐533. [DOI] [PubMed] [Google Scholar]
- 33. van Nunen LX, Zimmermann FM, Tonino PA, et al. Fractional flow reserve versus angiography for guidance of PCI in patients with multivessel coronary artery disease (FAME): 5‐year follow‐up of a randomised controlled trial. Lancet. 2015;386(10006):1853‐1860. [DOI] [PubMed] [Google Scholar]
- 34. Gotberg M, Christiansen EH, Gudmundsdottir IJ, et al. Instantaneous wave‐free ratio versus fractional flow reserve to guide PCI. N Engl J Med. 2017;376(19):1813‐1823. [DOI] [PubMed] [Google Scholar]
- 35. Davies JE, Sen S, Dehbi HM, et al. Use of the instantaneous wave‐free ratio or fractional flow reserve in PCI. N Engl J Med. 2017;376(19):1824‐1834. [DOI] [PubMed] [Google Scholar]
- 36. Jeremias A, Davies JE, Maehara A, et al. Blinded physiological assessment of residual Ischemia after successful angiographic percutaneous coronary intervention: the DEFINE PCI Study. JACC Cardiovasc Interv. 2019;12(20):1991‐2001. [DOI] [PubMed] [Google Scholar]
- 37. Tu S, Barbato E, Koszegi Z, et al. Fractional flow reserve calculation from 3‐dimensional quantitative coronary angiography and TIMI frame count: a fast computer model to quantify the functional significance of moderately obstructed coronary arteries. JACC Cardiovasc Interv. 2014;7(7):768‐777. [DOI] [PubMed] [Google Scholar]
- 38. Papafaklis MI, Muramatsu T, Ishibashi Y, et al. Fast virtual functional assessment of intermediate coronary lesions using routine angiographic data and blood flow simulation in humans: comparison with pressure wire—fractional flow reserve. EuroIntervention. 2014;10(5):574‐583. [DOI] [PubMed] [Google Scholar]
- 39. Tu S, Westra J, Yang J, et al. Diagnostic accuracy of fast computational approaches to derive fractional flow reserve from diagnostic coronary angiography: the International Multicenter FAVOR Pilot Study. JACC Cardiovasc Interv. 2016;9(19):2024‐2035. [DOI] [PubMed] [Google Scholar]
- 40. Xu B, Tu S, Qiao S, et al. Diagnostic accuracy of angiography‐based quantitative flow ratio measurements for online assessment of coronary stenosis. J Am Coll Cardiol. 2017;70(25):3077‐3087. [DOI] [PubMed] [Google Scholar]
- 41. Fearon WF, Achenbach S, Assali TEA, et al. Accuracy of fractional flow reserve derived from coronary angiography. Ciculation. 2019;139(4):477–484. [DOI] [PubMed] [Google Scholar]
- 42. Asano T, Katagiri Y, Collet C, et al. Functional comparison between the BuMA Supreme biodegradable polymer sirolimus‐eluting stent and a durable polymer zotarolimus‐eluting coronary stent using quantitative flow ratio: PIONEER QFR substudy. EuroIntervention. 2018;14(5):e570‐e579. [DOI] [PubMed] [Google Scholar]
- 43. Biscaglia S, Tebaldi M, Brugaletta S, et al. Prognostic value of QFR measured immediately after successful stent implantation: the International Multicenter Prospective HAWKEYE Study. JACC Cardiovasc Interv. 2019;12(20):2079‐2088. [DOI] [PubMed] [Google Scholar]
- 44. Ely Pizzato P, Samdani AJ, Vergara‐Martel A, et al. Feasibility of coronary angiogram‐derived vessel fractional flow reserve in the setting of standard of care percutaneous coronary intervention and its correlation with invasive FFR. Int J Cardiol. 2020;301:45‐49. [DOI] [PubMed] [Google Scholar]
- 45. Agarwal SK, Kasula S, Hacioglu Y, Ahmed Z, Uretsky BF, Hakeem A. Utilizing post‐intervention fractional flow reserve to optimize acute results and the relationship to long‐term outcomes. JACC Cardiovasc Interv. 2016;9(10):1022‐1031. [DOI] [PubMed] [Google Scholar]
- 46. Beygui F, Lemaitre A, Bignon M, et al. A head‐to‐head comparison of three coronary fractional flow reserve measurement technologies: The fractional flow reserve‐device study. Catheter Cardiovasc Interv. 2019;95(6):1094–1101. [DOI] [PubMed] [Google Scholar]
- 47. Menon M, Jaffe W, Watson T, Webster M. Assessment of coronary fractional flow reserve using a monorail pressure catheter: the first‐in‐human ACCESS‐NZ trial. EuroIntervention. 2015;11(3):257‐263. [DOI] [PubMed] [Google Scholar]