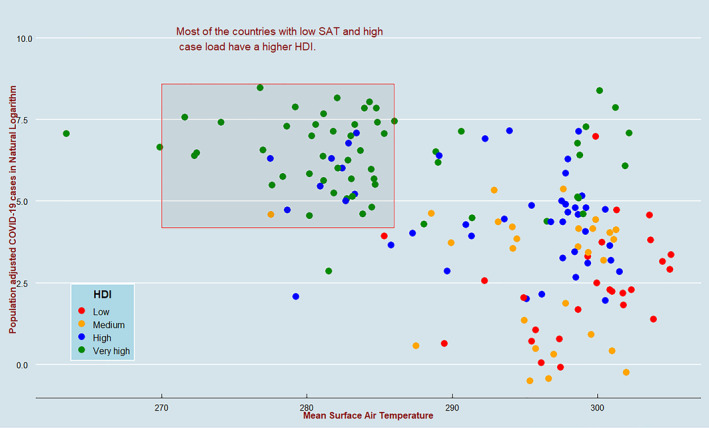
Figure 3.

Scatterplot of population‐adjusted COVID‐19 cases and surface air temperature (SAT) mean showing the distribution of Human Development Index (HDI). The scatterplot shows a negative correlation between mean SAT and the natural logarithm of population‐adjusted COVID‐19 cases. Almost all of the countries with high caseloads and low temperatures have high HDI values.
