Abstract
Takotsubo cardiomyopathy (TC) is a reversible condition in which there is transient left ventricular (LV) dysfunction characterised most commonly by basal hyperkinesis and mid-apical LV ballooning and hypokinesia. It is said to be triggered by stress and mimics, such as acute coronary syndrome (ACS) clinically. Diagnosis is usually suspected on echocardiography due to the characteristic contraction pattern in a patient with symptoms and signs of ACS but normal coronary arteries on catheter angiography. Cardiac magnetic resonance (CMR), with its latest advancements, is the diagnostic modality of choice for diagnosis, prognosis and follow-up of patients. The advances in CMR (including T1, T2, ECV mapping and threshold-based late gadolinium enhancement (LGE) measurements have revolutionised the role of CMR in tissue characterisation and prognostication in patients with TC. In this review, we highlight the current role of CMR in management of TC and enumerate the CMR findings in TC as well the current advances in the field of CMR, which could help in prognosticating these patients.
Introduction
Takotsubo cardiomyopathy (TC also referred to as stress cardiomyopathy) is an acute transient cardiomyopathy described first by Sato et al. in 1990. It mimics acute coronary syndrome (ACS) in its clinical presentation and manifests as left ventricular (LV) dysfunction, but with no obstructive coronary artery disease. The aetiology of this syndrome is unknown; however, neurocardiogenic stunning precipitated by emotional or physical stress is postulated to be the most common mechanism, suggesting a link between the brain and the heart. The condition generally improves in the weeks following the acute event.1 The prevalence of TC is estimated to be 1–2% in patients who present with symptoms of an ACS.2 Previously thought to be benign, this entity has now been shown to have significant morbidity and mortality and may lead to complications like heart failure, arrhythmia, mitral regurgitation (MR) and cardiogenic shock.3 The purpose of this review is to describe the role of cardiac magnetic resonance (CMR) in the management of this condition.
Pathophysiological basis
Although the exact etiopathogenesis of TC is unknown, the most commonly accepted hypothesis is stress-related neurocardiogenic stunning. An acute emotional stress or physical stress caused by surgery, trauma or medication causes an increase in the cerebral blood flow in the brainstem, hippocampus and basal ganglia. It also leads to a complex neurohormonal activation which causes the release of stress-related neuropeptides like neuropeptide Y and catecholamines. These mediators can have a direct toxic effect on the myocardium or can also lead to microvascular dysfunction (MVD), which can, in turn, lead to TC.4,5 A higher circulating level of catecholamines in these patients, similar to patients with phaeochromocytoma, is another proposed cause of the cardiomyopathy.6 This theory is supported by the fact that TC can be precipitated by exposure to subtherapeutic doses of catecholamines and standard dobutamine doses.7 However, this may also happen as a compensation for the decreased ejection fraction and low blood pressures. Some individuals might be more predisposed to the neurocardiogenic stunning. These individuals have more catecholamine or neuropeptide Y granules in their presynaptic neurons, and hence, the intense adrenergic stimulus may lead to myocardial stunning. Other individuals, whose neurohormonal mechanisms allow them to cope up well with stress, may not experience this phenomenon.6 The adrenergic stimulus flattens over weeks to months which causes the cardiomyopathy to resolve, leading to normalisation of the ventricular function.4
Clinical presentation
TC is more common in elderly post-menopausal females. The clinical presentation is often similar to that of an acute aortic syndrome. The common clinical features are acute substernal chest pain (75%), dyspnoea (50%), dizziness and less commonly, syncope.4,8 Usually, there is a history of a physical or emotional stressor which is also the precipitating factor for this condition (e.g. death of a dear one, domestic violence and abuse, medical illness, drug withdrawal, natural disasters or financial losses). According to the International Takotsubo Registry, among the 1759 patients, 36% had a physical trigger, 27.7% had an emotional trigger, 7.8% experienced both physical and emotional triggers, and there was no obvious trigger in as many as 28.5% of the patients.8 Some patients have symptoms and signs of heart failure or arrhythmias (both brady- and tachyarrythmias). Up to 10% of the patients may develop clinical features of cardiogenic shock (hypotension, dyspnoea, altered mental status and circulatory failure).8 Symptoms and signs of transient ischaemic attack or stroke may also develop.
Diagnostic algorithm
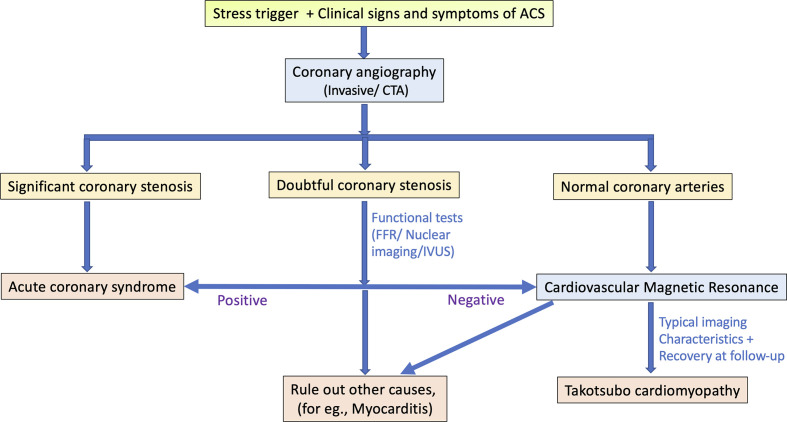
The patient usually presents with acute chest pain and changes typical of ACS on ECG with raised cardiac biomarkers. Significant coronary artery stenosis is typically ruled out on a diagnostic coronary angiography. In selected stable patients in whom clinical and echocardiographic features are diagnostic of TC, a CT angiography can also be used as an alternative to invasive coronary angiography. CMR has become the mainstay of non-invasive diagnosis of this entity and allows comprehensive evaluation of the ventricular function, tissue characterisation and assessment of complications.9,10 The proposed Mayo clinic criteria also gives CMR a substantial role in the diagnosis of TC, as well as to exclude other causes like myocarditis or MINOCA (Myocardial infarction with non-obstructive coronary arteries).11
The recommended diagnostic algorithm is given in Figure 1.
Figure 1.
The diagnostic pathway for Takotsubo cardiomyopathy. Abbreviation: MINOCA: Myocardial infarction with non-obstructive coronary arteries; ACS: Acute coronary syndrome; CTA: CT angiography; FFR: Fractional flow reserve; IVUS: Intravascular ultrasound.
Assessment of Takotsubo cardiomyopathy (TC) on Cardiovascular Magnetic Resonance
CMR has become a primary imaging tool for non-invasive assessment of patients with TC. It can identify evidence of tissue injury by detecting myocardial oedema as well as scar tissue (fibrosis). Ventricular functions can also be estimated accurately.12 It also serves as the gold standard for the follow-up of these patients after 3–6 months to establish reversibility which is the hallmark of TC.13 As there is no radiation exposure, it is a suitable modality for follow-up imaging. The applications of CMR in TC are enumerated in Table 1.
Table 1.
The various applications of CMR in the evaluation of Takotsubo cardiomyopathy.
| Applications of CMR in Takotsubo cardiomyopathy | Useful sequences |
|---|---|
| Ventricular function | Cine sequences (Balanced SSFP) |
| Assessment of regional wall motion abnormalities | Cine sequences (Balanced SSFP) |
| Tissue characterisation: inflammation/oedema | T2 FSE triple inversion recovery/ Short tau inversion recovery (STIR)/T2 mapping |
| Tissue characterisation: fibrosis/necrosis | LGE (Late gadolinium enhancement) |
| Complications: Pericardial and pleural effusion, ventricular rupture | Axial white blood stack, cine sequences |
| Complications: Thrombus | Early gadolinium enhancement (High TI-time of inversion) |
| Complications: Left ventricular outflow tract obstruction, Mitral regurgitation | Phase-contrast velocity imaging |
| To rule out other differential diagnoses | Combination of above sequences |
FSE, Fast spin echo; SSFP, Steady-state free precession; TI, Inversion time.
CMR imaging protocol
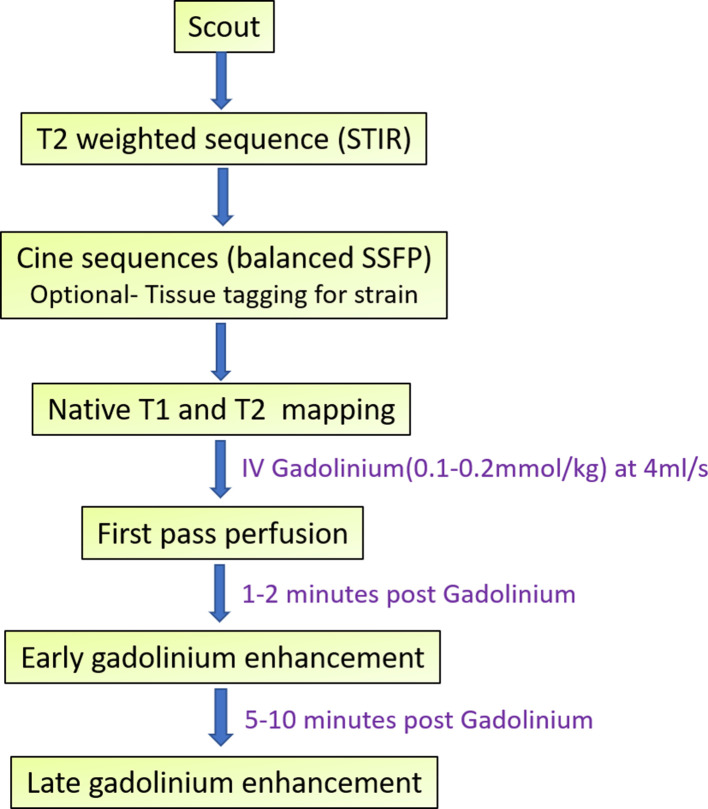
We, at our institute, perform the CMR examinations using a 1.5 Tesla machine (Siemens Magnetom Aera, Siemens Healthcare, Forchheim, Germany). The most important sequences that are used are steady-state free precision (SSFP) and cine images, T2W sequences for oedema like short tau inversion recovery (STIR), first-pass perfusion, early and late gadolinium enhancement (EGE and LGE, respectively).14,15 Advanced imaging techniques that are used include T1 and T2 mapping techniques. Cine images can also later be post-processed on feature-tracking software to evaluate myocardial strain pattern.9
A brief description of the standard CMR protocol is given in Figure 2 and Table 2.
Figure 2.
Outline of the CMR imaging protocol for Takotsubo cardiomyopathy.
Table 2.
The CMR imaging protocol with the imaging planes and the interpretations for suspected Takotsubo cardiomyopathy
| Protocol | Sequence used | Imaging planes | Applications |
|---|---|---|---|
| 1.Scout | Non-gated balanced SSFP | Axial, coronal, sagittal | Extracardiac findings, effusions |
| 2.Functions and morphology | ECG and respiratory-gated balanced SSFP | Short axis stack covering left ventricle, one slice each of 4-chamber, 3-chamber and 2- chamber views Slice thickness = 6–8 mm Distance factor = 30% |
|
| 3.Inflammation/oedema | Black blood T2 FSE Triple IR/ STIR | Short axis (8 mm) slices covering the left ventricle |
|
| 4.Native T1 mapping | MOLLI (Modified Look-Locker Inversion Recovery) used in our institute | Short axis three slices each at basal, mid and apical left ventricle. | Quantitative assessment of oedema, inflammation and myocardial injury |
| 5 .T2 mapping | T2 prepared single-shot SSFP | Short axis three slices each at basal, mid and apical LV. | Quantitative assessment of oedema and inflammation |
| 6.Optional- Strain |
Post-processing of cine images using Feature-tracking | Same slices and planes as cine images | Assessment of regional and global strain patterns. |
| 7.Perfusion (First pass) while administering IV Gadolinium (Gd) contrast (0.1 mmol/kg at 4 ml s−1) | Saturation recovery sequence | 3–6 short-axis slices (optional- one slice each of 4 chamber, two chamber) | Subendocardial perfusion deficits may be noted due to microvascular dysfunction. |
| 8.Early gadolinium enhancement (EGE) at 1–2 min after injection | 2D segmented/ phase-sensitive inversion recovery (PSIR) at TI ~ 550 ms | Short axis stack covering left ventricle (8 mm slices,~30% distance factor) one or more slices of 4, 2 and 3 chamber views |
|
| 9.Late gadolinium enhancement (LGE) at 5–10 min after injection | 2D segmented IR/ PSIR at null times identifying by TI scout | Same as early gadolinium enhancement. | Usually, there is absence of significant LGE (using +5 SD threshold method for detection) (Current literature suggests that patchy LGE may be detected if a cut off of +3 SD is used). |
| 10.Post-contrast T1 mapping | MOLLI, at 15 min after contrast administration | Done at the same slices as native T1 mapping | Necessary for calculating extracellular volume (ECV) (along with native T1 values and haematocrit) |
FSE, Fast spin echo; SSFP, Steady-state free precession; STIR, Short tau inversion recovery.
Findings
A) Assessment of contractile function
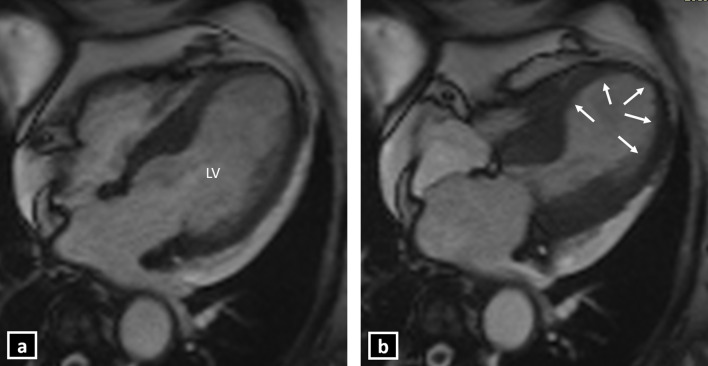
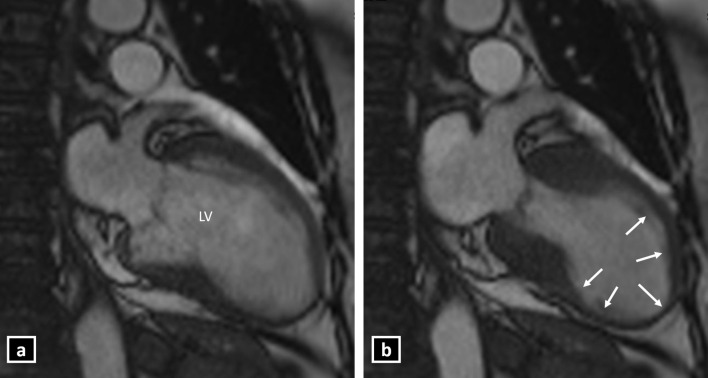
Contractile function can be accurately evaluated on the cine sequences. The typical pattern of contractile dysfunction in TC is mid-ventricular to apical hypokinesia, akinesia or dyskinesia, which extends beyond the distribution of a single coronary artery and involves the LV circumferentially.3 Additionally, there is the presence of basal hyperkinesia, which gives the typical appearance of Japanese “Octopus pot” (Takotsubo) during contraction (Figures 3–5 and Supplementary Videos 1 and 2). This is the most common pattern seen in 75–80% of the patients with TC.4,8 This pattern may be associated with complications in the form of dynamic LV outflow tract obstruction (due to basal hyperkinesis and/or systolic anterior motion (SAM) of the anterior mitral leaflet) or thrombus formation at the LV apex (due to stasis of the blood in the ballooned out segment). Acute MR may also be seen in approximately 25% of the cases. Approximately 20% of the patients have clinically significant acute MR, which poses the risk of adverse outcomes in cases of TC. The various mechanisms of MR in TC include SAM, severe mitral valve tenting due to leaflet tethering caused by papillary muscle displacement and papillary muscle dysfunction.16
Figure 3.
Cine CMR 4-chamber view showing typical left ventricular apical ballooning in Takotsubo cardiomyopathy (a: late diastole; b: late systole) (LV: Left ventricle).
Figure 4.
Cine CMR 2-chamber view showing typical left ventricular apical ballooning in Takotsubo cardiomyopathy (a: late diastole; b: late systole) (LV: Left ventricle).
Figure 5.
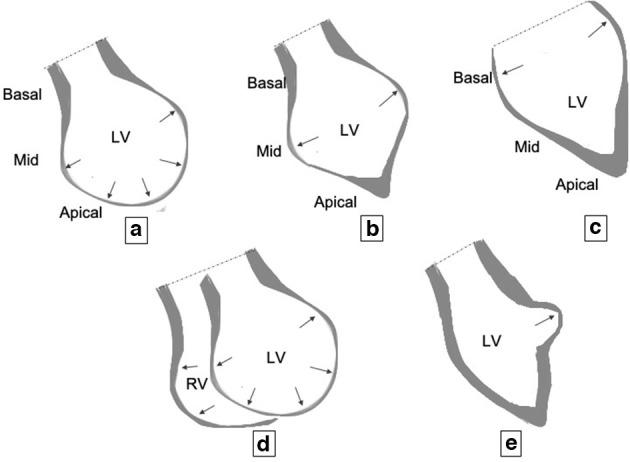
Graphics showing various patterns of contraction in Takotsubo cardiomyopathy: (A) mid-ventricular to apical ballooning (most common pattern); (B) mid-ventricular ballooning; (C) basal ballooning; (D) biventricular involvement: dilatation and ballooning of both the left ventricle (LV) and the right ventricle (RV); (E) focal ballooning (rarest).
Other less common patterns are (Figure 5B–E):
Mid-ventricular ballooning pattern (Figure 5B) – It is seen in 10–20% of the patients and is characterised by thinning and ballooning of mid-ventricular LV. The contraction of basal and apical LV are normal.4 This pattern is associated with greater degrees of LV dysfunction and haemodynamic compromise.17,18
Basal ballooning pattern (Figure 5C) – It is seen in less than 5% of the patients.17 This pattern is associated with less haemodynamic compromise.19
Biventricular pattern (Figure 5D) – This is a rare variety with an incidence of 0.5%. Like the mid-ventricular pattern, this variety also results in cardiogenic shock and ventricular dysfunction.
Focal ballooning pattern (Figure 5E) – There is focal outpouching from the LV, and it may be indistinguishable from myocarditis.
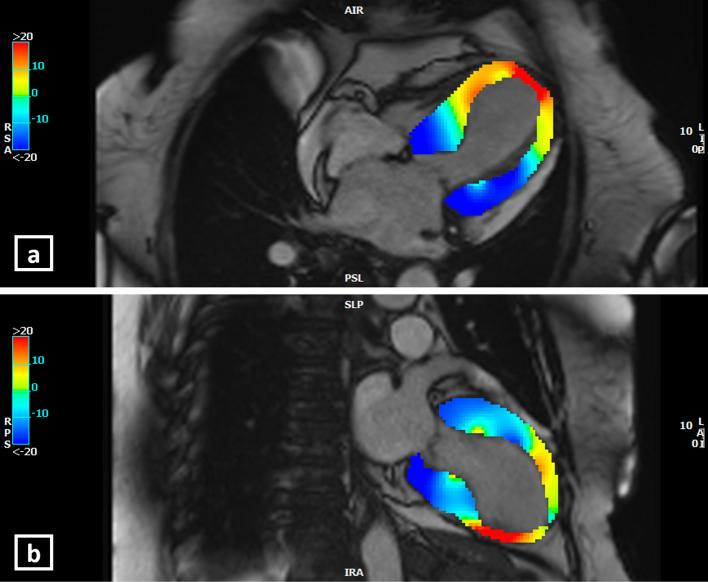
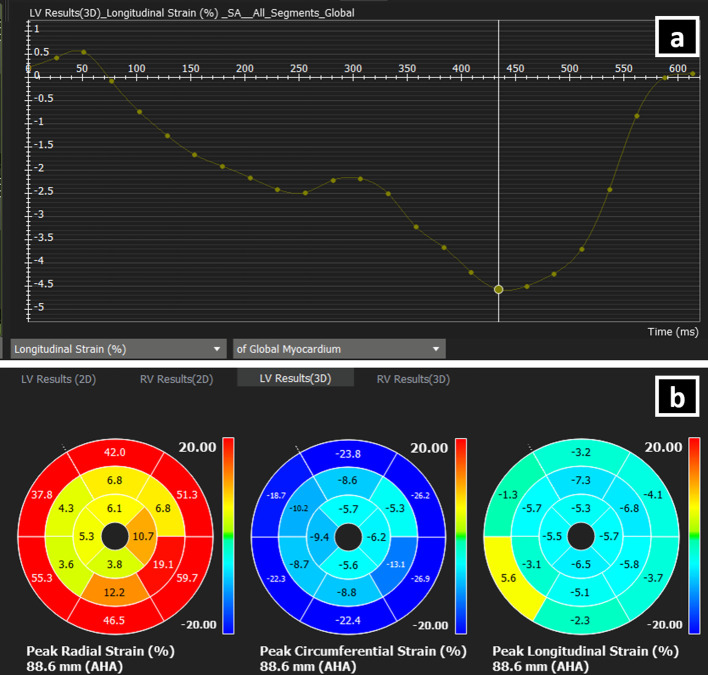
Current advances in CMR for assessment of contractile function: There may be subjective variation in the visual assessment of regional wall motion abnormalities (RWMA) using cine sequences. Hence, a novel CMR post-processing tool, that is, feature/tissue tracking CMR (FT-CMR), may be used to perform an objective assessment of the strain patterns and RWMA using the routine-balanced SSFP cine images.20 FT-CMR can reliably demonstrate regional wall strain patterns to effectively distinguish between the variants of TC.21 In a study by Stiermaier et al21 comprising of 141 TC patients, apical ballooning was associated with a significantly lower global longitudinal strain (GLS) and global circumferential strain (GCS) compared with the midventricular or basal ballooning patterns. Patients with basal ballooning showed the lowest global radial strain (GRS). GLS derived by FT-CMR can also be a marker of outcomes in patients with TC. In this study, GLS poorer than −14.75% was found to be an adverse prognostic marker for long-term mortality outcomes (Figures 6 and 7).21
Figure 6.
Longitudinal strain (LS) analysis by feature-tracking CMR at the end-systole in 4-chamber view (a), and 2-chamber view (b) in a patient with the “mid to apical ballooning pattern” of Takotsubo cardiomyopathy. The colour-scale is given at the left side of the images. Blue represents negative LS (representative of normal strain pattern since there is shortening of myocardium in systole, normal strain values are usually more negative than −17%). Red represents positive LS (abnormal strain pattern as myocytes cannot shorten). At end-systole, the yellow-orange-red areas represent the mid-apical left ventricular ballooning suggesting abnormal LS. (Software CVI42, Circle Cardiovascular Imaging Inc., Calgary, Canada).
Figure 7.
(a) The curve of the global longitudinal strain (GLS) of the left ventricle (LV) against time as assessed by feature-tracking CMR. The peak GLS here is −4.6%, meaning deranged GLS in a patient with Takotsubo cardiomyopathy. (Software CVI42, Circle Cardiovascular Imaging Inc., Calgary, Canada).
(b) Bull's eye plots showing segment-wise LV strain values: peak radial strain, peak circumferential strain and peak longitudinal strain. Peak radial strain is red/positive/ normal in basal segments and deranged in mid-apical segments (radial strain is normally positive since the myocardium thickens in systole). Peak circumferential strain is blue/negative/normal in basal segments and abnormal in mid-apical segments (Circumferential strain is normally negative due to circumferential LV contraction in systole). Peak longitudinal strain is deranged in all the segments.(Software CVI42, Circle Cardiovascular Imaging Inc., Calgary, Canada).
B) Assessment of myocardial oedema
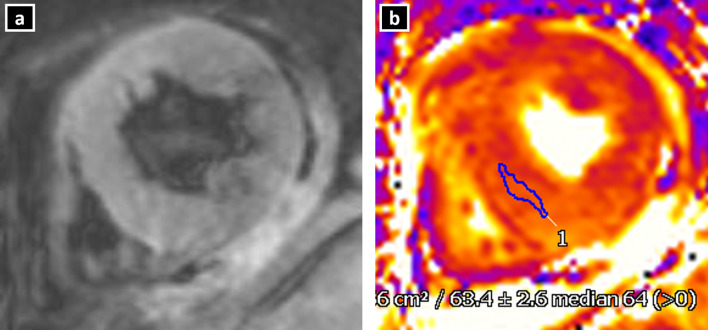
Because of underlying inflammatory injury to the myocardium, there is the presence of both intracellular oedema as well as cell injury leading to troponin release in TC. Oedema and inflammation are the main features in TC, but it rarely leads to necrosis, in contrast to myocarditis or myocardial infarction. The oedema is seen as signal hyperintensity in the T2W sequences. Myocardial oedema is generally diffuse in nature, involving mainly the regions with RWMA. The feature that differentiates oedema in TC from that in acute myocardial infarction (AMI) is that in TC, the oedema is not limited to a vascular territory and gradually normalises over weeks. In AMI, the oedema persists for months. Also, in TC, the oedema is diffuse and transmural in comparison with myocarditis, in which it is more commonly seen in the subepicardial or mid-myocardial region. Visual assessment of oedema, however, suffers from subjective variations, especially when oedema is diffuse in nature (Figure 8A).
Figure 8.
Myocardial oedema in a patient with Takotsubo cardiomyopathy. T2W inversion recovery sequence in short-axis view (a) show no obvious hyperintense areas on visual estimation. T2 mapping (b) at the same level reveals elevated T2 value (mean: 63.4 ms) suggestive of oedema.
Current advances in CMR for assessment of myocardial oedema: To combat the problem of subjective variation and difficulty in visual assessment of diffuse oedema, quantitative techniques may be used. A T2 signal intensity (SI) ratio (ratio of SI between myocardium and skeletal muscle) greater than or equal to 1.9 is considered diagnostic of myocardial oedema. However, routine T2 sequences may be prone to motion as well as saturation artefacts. In this regard, parametric T2 and T1 mapping techniques, with their motion correction algorithms, provide a more objective and accurate assessment of myocardial oedema (Figure 8B).22,23 The role of T1 and T2 mapping in assessment of myocardial oedema and inflammation has been described in details under the section “Current advances in CMR for tissue characterization” in this article.
C) Assessment of myocardial perfusion
Although conventional knowledge suggests that perfusion remains normal in TC with no significant perfusion deficits, there is growing evidence in literature which suggests that there may be presence of subendocardial perfusion deficits due to excessive neurohormonal discharge and resultant MVD in the involved segments. This perfusion deficit also correlates to the extent of myocardial injury. In a study by Elesbar et al, abnormal myocardial perfusion was present in as high as 69% of the patients with apical ballooning syndrome.24
Current advances in CMR for assessment of myocardial perfusion: Quantitative perfusion CMR may allow for a more objective assessment of the degree of MVD in patients with TC. However, the utility of quantitative techniques in TC is still in the realms of research.
D) Tissue characterisation and myocardial fibrosis assessment
Conventional literature suggests that there is an absence of LGE in the involved myocardium in TC, in contrast to those with acute myocarditis or AMI.25 Presence of myocardial inflammation in the absence of myocardial necrosis explains the absence of LGE in most of the patients.4,26
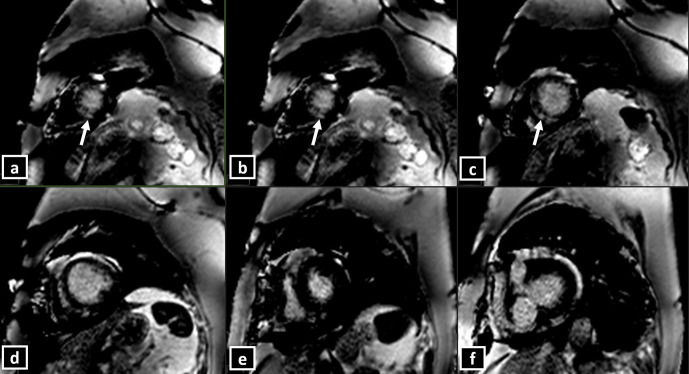
However, more recent studies suggest that LGE may be present in some patients. The presence of LGE in these patients may be related to delayed washout of contrast due to hyperaemia and increased interstitial water.27 A study by Rolf et al found that patients with TC had increased collagen-1, and patients with presence of LGE (using a threshold of 2 SD above the SI for remote myocardium) had significantly increased collagen-1, thus challenging the concept that the LGE in these patients was due to the loss of integrity of myocytes28 (Figure 9).
Figure 9.
(a-h) Short-axis CMR delayed PSIR sequence showing patchy subtle hyperintensities (LGE) involving mid-apical left ventricular segments (a through c), in a patient with Takotsubo cardiomyopathy of “classical pattern”.
In a multicentre study of 239 patients, focal or patchy LGE was seen in up to 9% of the patients with TC, when a threshold of 3 SD above that of the remote myocardium was used to define LGE.29 Presence of LGE in patients with TC is a marker of adverse prognosis and prolonged recovery. However, it should also be noted that the SI of the LGE in TC is lower than that in myocarditis or AMI.30 None of the patients in the above series had any significant LGE if a threshold of 5 SD was used. Hence, they concluded that typical contractile dysfunction and myocardial oedema in the absence of LGE (using a 5 SD threshold) may be a diagnostic feature of TC (Figure 10).28
Figure 10.
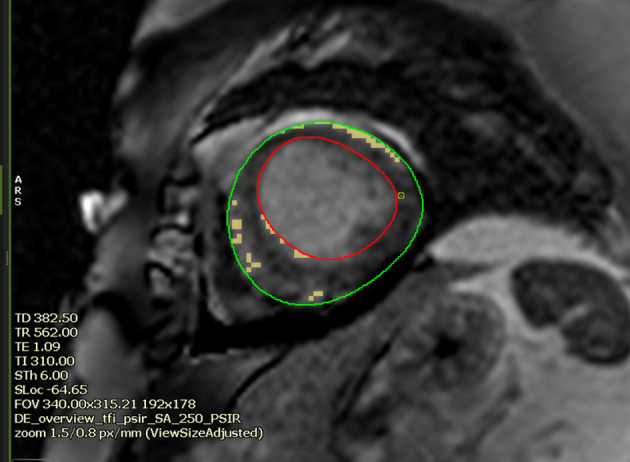
Short axis CMR LGE image at the apical segment in a 60-year-old female with Takotsubo cardiomyopathy (mid-apical ballooning pattern). The image shows semi-automated quantification of LGE/scar at a threshold of 3 SD above the mean signal intensity of remote myocardium (denoted here with hand-drawn blue ROI). The percentage of scar was 3.3% of the LV myocardium. At 5 SD, the software could not perceive any LGE/scar. (Software CVI42, Circle Cardiovascular Imaging Inc., Calgary, Canada).
Current advances in CMR for tissue characterisation: Apart from the oedema identification and characterisation, sequences such as mapping help in further tissue characterisation by assessment of LGE.
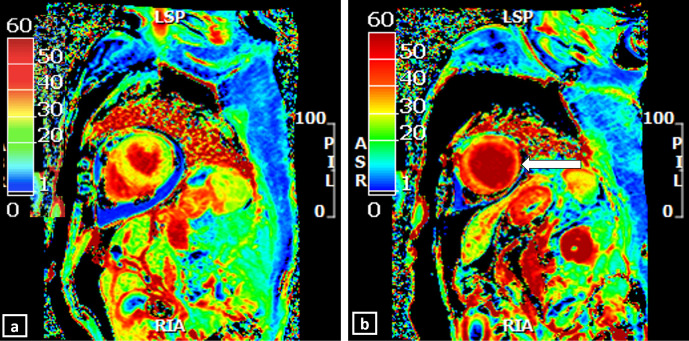
Focal fibrosis is usually recognisable as focal LGE; however, diffuse increase in the interstitial space resulting from myocardial injury in TC may be difficult to interpret subjectively due to lack of a “normal black” remote myocardium. Techniques like parametric T1 mapping and extracellular volume (ECV) mapping allow for non-invasive detection of the diffuse extracellular matrix abnormalities in TC (Figure 11). ECV mapping provides a better representation of the collagen volume fraction and is a more reproducible method of quantifying the interstitial fibrosis or infiltration than the native T1 mapping (Figure 12).31 In a recently published prospective study (n = 30), use of non-contrast T1 and T2 mapping in the patients with mid-apical TC has shown the ability to identify acute myocardial injury with a high diagnostic accuracy without the need of gadolinium contrast. The global T2 values were significantly higher in patients with TC (59 ± 8 ms) than controls (51 ± 4 ms) and showed an increasing gradient from the base to apex. This suggests that myocardial inflammation is global but affects the mid-apical segments (with RWMA) predominantly. The T2 mapping (cutoff 56 ms) had more specificity (94%) for the identification of acute inflammation than native T1 mapping (cutoff 1011 ms), which showed a specificity of 91%. The sensitivities of T2 and T1 mapping were 62 and 72%, respectively. Combining T2 and T1 mapping increased the sensitivity to 91.7% for inflammation and oedema. Also, T2 mapping values were significantly higher in the segments with RWMA then those without (62 ± 9 ms vs 55 ± 5 ms; p < 0.001). In line with the transient nature of TC, T2 mapping values also normalised at the follow-up. Notably, none of the patients in this study had LGE.23 Also, native T1 mapping had good diagnostic accuracy for persistent inflammation in TC. The sensitivity and the specificity of ECV mapping (with a cut off – 27%) to detect myocardial injury were 72 and 97%, respectively. Native T1 and ECV values were significantly higher in the segments with RWMA (ECV: 34 ± 5% and T1: 1060 ± 65 ms) than those without (ECV: 29 ± 1% and T1:1025 ± 56 ms). At follow-up imaging, all patients showed recovery of LV ejection fraction; however, native T1 and ECV values did not normalise, suggestive of an element of persistent inflammation.23
Figure 11.
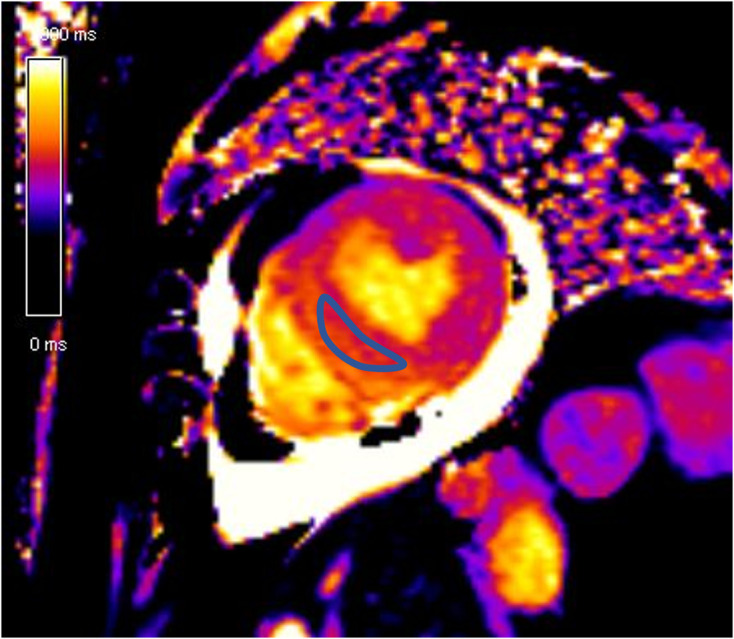
Elevated native T1 map value (Average native T1 – 1360 ms) in a patient with Takotsubo cardiomyopathy.
Figure 12.
ECV maps in a patient with Takotsubo cardiomyopathy, generated from pre and post-contrast T1 maps by a post-processing software (CVI42, Circle Cardiovascular Imaging Inc., Calgary, Canada). The colour bar (0 through 60) shows the % of ECV. Normal ECV (usually within 30%) is denoted by green-yellow. Orange to red denotes higher ECV. (a) shows normal (green-yellow) ECV map at basal LV (Average ECV −26%), (b) shows abnormal (red) ECV values at apical LV (Average ECV – 47%).
A few other studies have also described the role of mapping in the assessment of TC. In a study by Aikawa et al,32 patients with acute TC (n = 23) had higher native T1, T2 and ECV than controls and higher T1 and T2 mapping values correlated with lower LV ejection fraction. The area under the curve for the native T1 (0.96) for detection of myocardial impairment was significantly higher than that for T2 (0.86, p = 0.005) but similar to that for ECV (0.92, p = 0.104). In this study, all three mapping parameters remained elevated at 3 months of follow-up.32 Similar findings were seen in the study by Dabir et al.33 The authors concluded that T1, T2 and ECV mapping techniques show higher values in both the visually abnormal and apparently normal segments in TC, suggesting global myocardial injury. Mapping could serve as a potential marker for assessment of disease progression, which warrants further research in a larger cohort.
Assessment of complications
In patients with LV outflow tract obstruction, the gradient across the stenosis may be assessed by phase-contrast sequences to assess significance. The degree of MR can also be calculated using phase-contrast techniques.
An LV clot that may develop especially in the apical ballooning variant of TC may be seen in the routine cine sequences. The EGE sequence done within 1–3 min of contrast injection at a high inversion time (~500 ms) may clinch the diagnosis as the thrombus remains completely hypointense in contrast to the grey myocardium. It does not show any enhancement on the LGE sequences. Early identification of clot may help in preventing systemic thromboembolism.
Up to a third of the patients with TC may also show pleural or pericardial effusion, which can be well assessed on the Cine or bright blood SSFP images (Figure 13).28 Right ventricular involvement can also be assessed on cine sequences, and if present, it suggests poorer outcomes.
Figure 13.
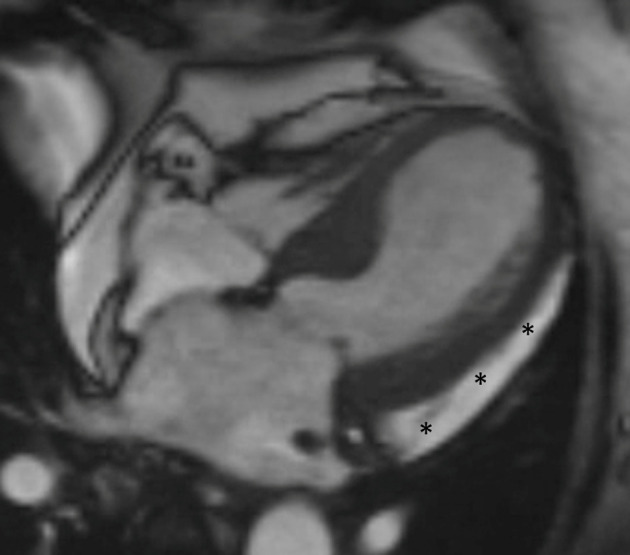
Cine CMR image in a patient with Takotsubo cardiomyopathy shows a sleeve of pericardial effusion (asterisks).
Follow-up
A clinical and imaging follow-up is recommended at 3–6 months post the initial event to establish recovery of ventricular functions and volumes. As TC is a transient form of cardiomyopathy, recovery of functions is an essential diagnostic criterion. Additionally, features of oedema such as T2 signal intensities and mapping parameters should normalise in a majority of patients at the follow-up, along with a complete absence of LGE.
Keypoints
1. Takotsubo cardiomyopathy is an acute transient cardiomyopathy usually triggered by emotional or physical stress.
2. The typical (mid-apical LV ballooning) contractile dysfunction and reversible myocardial injury is the hallmark feature of TC.
3. CMR plays an essential role in diagnosis, prognosis and follow up of TC.
4. The current advances in CMR (including T1, T2, ECV mapping and threshold-based LGE measurements have revolutionised the role of CMR in tissue characterisation and prognostication in patients with TC.
Conclusion
CMR plays an important role in diagnosis, assessment of complication, prognostication and follow-up of TC. The typical contractile abnormality, reversible myocardial injury and absence of LGE at 5 SD threshold are essential diagnostic criterion. Current technological advancements like T1, T2 and ECV mapping techniques as well as strain imaging may allow for a more objective assessment of the inflammatory cell injury and tissue characterisation in these patients.
Footnotes
Contributions: All the authors contributed equally in preparation, design and final approval of the manuscript.
Contributor Information
Vineeta Ojha, Email: vineetao17@gmail.com.
Rishabh Khurana, Email: rishabhkhurana88@gmail.com.
Kartik P Ganga, Email: drkartikganga@gmail.com.
Sanjeev Kumar, Email: sanjeevradio@gmail.com.
REFERENCES
- 1.Sharkey SW, Windenburg DC, Lesser JR, Maron MS, Hauser RG, Lesser JN, et al. Natural history and expansive clinical profile of stress (tako-tsubo) cardiomyopathy. J Am Coll Cardiol 2010; 55: 333–41. doi: 10.1016/j.jacc.2009.08.057 [DOI] [PubMed] [Google Scholar]
- 2.Bybee KA, Prasad A, Barsness GW, Lerman A, Jaffe AS, Murphy JG, et al. Clinical characteristics and thrombolysis in myocardial infarction frame counts in women with transient left ventricular apical ballooning syndrome. Am J Cardiol 2004; 94: 343–6. doi: 10.1016/j.amjcard.2004.04.030 [DOI] [PubMed] [Google Scholar]
- 3.Citro R, Rigo F, D'Andrea A, Ciampi Q, Parodi G, Provenza G, et al. Echocardiographic correlates of acute heart failure, cardiogenic shock, and in-hospital mortality in tako-tsubo cardiomyopathy. JACC Cardiovasc Imaging 2014; 7: 119–29. doi: 10.1016/j.jcmg.2013.09.020 [DOI] [PubMed] [Google Scholar]
- 4.Medina de Chazal H, Del Buono MG, Keyser-Marcus L, Ma L, Moeller FG, Berrocal D, et al. Stress Cardiomyopathy Diagnosis and Treatment: JACC State-of-the-Art Review. J Am Coll Cardiol 2018; 72: 1955–71. doi: 10.1016/j.jacc.2018.07.072 [DOI] [PMC free article] [PubMed] [Google Scholar]
- 5.Nef HM, Möllmann H, Kostin S, Troidl C, Voss S, Weber M, et al. Tako-Tsubo cardiomyopathy: Intraindividual structural analysis in the acute phase and after functional recovery. Eur Heart J 2007; 28: 2456–64. doi: 10.1093/eurheartj/ehl570 [DOI] [PubMed] [Google Scholar]
- 6.Wittstein IS, Thiemann DR, Lima JAC, Baughman KL, Schulman SP, Gerstenblith G, et al. Neurohumoral features of myocardial stunning due to sudden emotional stress. N Engl J Med 2005; 352: 539–48. doi: 10.1056/NEJMoa043046 [DOI] [PubMed] [Google Scholar]
- 7.Abraham J, Mudd JO, Kapur NK, Kapur N, Klein K, Champion HC, Wittstein IS, et al. Stress cardiomyopathy after intravenous administration of catecholamines and beta-receptor agonists. J Am Coll Cardiol 2009; 53: 1320–5. doi: 10.1016/j.jacc.2009.02.020 [DOI] [PubMed] [Google Scholar]
- 8.Templin C, Ghadri JR, Diekmann J, Napp LC, Bataiosu DR, Jaguszewski M, et al. Clinical features and outcomes of takotsubo (stress) cardiomyopathy. N Engl J Med 2015; 373: 929–38. doi: 10.1056/NEJMoa1406761 [DOI] [PubMed] [Google Scholar]
- 9.Plácido R, Cunha Lopes B, Almeida AG, Rochitte CE. The role of cardiovascular magnetic resonance in takotsubo syndrome. J Cardiovasc Magn Reson 2016; 18: 68. doi: 10.1186/s12968-016-0279-5 [DOI] [PMC free article] [PubMed] [Google Scholar]
- 10.Bratis K. Cardiac magnetic resonance in takotsubo syndrome. Eur Cardiol 2017; 12: 58–62. doi: 10.15420/ecr.2017:7:2 [DOI] [PMC free article] [PubMed] [Google Scholar]
- 11.Prasad A, Lerman A, Rihal CS. Apical ballooning syndrome (Tako-Tsubo or stress cardiomyopathy): a mimic of acute myocardial infarction. Am Heart J 2008; 155: 408–17. doi: 10.1016/j.ahj.2007.11.008 [DOI] [PubMed] [Google Scholar]
- 12.Bossone E, Lyon A, Citro R, Athanasiadis A, Meimoun P, Parodi G, et al. Takotsubo cardiomyopathy: an integrated multi-imaging approach. Eur Heart J Cardiovasc Imaging 2014; 15: 366–77. doi: 10.1093/ehjci/jet167 [DOI] [PubMed] [Google Scholar]
- 13.Kohan AA, Levy Yeyati E, De Stefano L, Dragonetti L, Pietrani M, Perez de Arenaza D, et al. Usefulness of MRI in takotsubo cardiomyopathy: a review of the literature. Cardiovasc Diagn Ther 2014; 4: 138–46. doi: 10.3978/j.issn.2223-3652.2013.10.03 [DOI] [PMC free article] [PubMed] [Google Scholar]
- 14.Abbas A, Sonnex E, Pereira RS, Coulden RA. Cardiac magnetic resonance assessment of takotsubo cardiomyopathy. Clin Radiol 2016; 71: e110–9. doi: 10.1016/j.crad.2015.10.020 [DOI] [PubMed] [Google Scholar]
- 15.Dastidar AG, Frontera A, Palazzuoli A, Bucciarelli-Ducci C. Takotsubo cardiomyopathy: unravelling the malignant consequences of a benign disease with cardiac magnetic resonance. Heart Fail Rev 2015; 20: 415–21. doi: 10.1007/s10741-015-9489-4 [DOI] [PMC free article] [PubMed] [Google Scholar]
- 16.Izumo M, Nalawadi S, Shiota M, Das J, Dohad S, Kuwahara E, et al. Mechanisms of acute mitral regurgitation in patients with takotsubo cardiomyopathy: an echocardiographic study. Circ Cardiovasc Imaging 2011; 4: 392–8. doi: 10.1161/CIRCIMAGING.110.962845 [DOI] [PubMed] [Google Scholar]
- 17.Lyon AR, Bossone E, Schneider B, Sechtem U, Citro R, Underwood SR, et al. Current state of knowledge on takotsubo syndrome: a position statement from the Taskforce on takotsubo syndrome of the heart failure association of the European Society of cardiology. Eur J Heart Fail 2016; 18: 8–27. doi: 10.1002/ejhf.424 [DOI] [PubMed] [Google Scholar]
- 18.Kurowski V, Kaiser A, von Hof K, Killermann DP, Mayer B, Hartmann F, et al. Apical and midventricular transient left ventricular dysfunction syndrome (tako-tsubo cardiomyopathy): frequency, mechanisms, and prognosis. Chest 2007; 132: 809–16. doi: 10.1378/chest.07-0608 [DOI] [PubMed] [Google Scholar]
- 19.Reuss CS, Lester SJ, Hurst RT, Askew JW, Nager P, Lusk J, et al. Isolated left ventricular basal ballooning phenotype of transient cardiomyopathy in young women. Am J Cardiol 2007; 99: 1451–3. doi: 10.1016/j.amjcard.2006.12.078 [DOI] [PubMed] [Google Scholar]
- 20.Heggemann F, Hamm K, Kaelsch T, Sueselbeck T, Papavassiliu T, Borggrefe M, et al. Global and regional myocardial function quantification in takotsubo cardiomyopathy in comparison to acute anterior myocardial infarction using two-dimensional (2D) strain echocardiography. Echocardiography 2011; 28: 715–9. doi: 10.1111/j.1540-8175.2011.01430.x [DOI] [PubMed] [Google Scholar]
- 21.Stiermaier T, Lange T, Chiribiri A, Möller C, Graf T, Villnow C, et al. Left ventricular myocardial deformation in takotsubo syndrome: a cardiovascular magnetic resonance myocardial feature tracking study. Eur Radiol 2018; 28: 5160–70. doi: 10.1007/s00330-018-5475-2 [DOI] [PubMed] [Google Scholar]
- 22.Friedrich MG, Marcotte F, Friedrich Matthias G, François M. Cardiac magnetic resonance assessment of myocarditis. Circ Cardiovasc Imaging 2013; 6: 833–9. doi: 10.1161/CIRCIMAGING.113.000416 [DOI] [PubMed] [Google Scholar]
- 23.Vermes E, Berradja N, Saab I, Genet T, Bertrand P, Pucheux J, et al. Cardiac magnetic resonance for assessment of cardiac involvement in takotsubo syndrome: do we still need contrast administration? Int J Cardiol 2020; 308: 93–5. doi: 10.1016/j.ijcard.2020.03.039 [DOI] [PubMed] [Google Scholar]
- 24.Elesber A, Lerman A, Bybee KA, Murphy JG, Barsness G, Singh M, et al. Myocardial perfusion in apical ballooning syndrome correlate of myocardial injury. Am Heart J 2006; 152: 469.e9–469.e13. doi: 10.1016/j.ahj.2006.06.007 [DOI] [PubMed] [Google Scholar]
- 25.Fernández-Pérez GC, Aguilar-Arjona JA, de la Fuente GT, Samartín M, Ghioldi A, Arias JC, et al. Takotsubo cardiomyopathy: assessment with cardiac MRI. AJR Am J Roentgenol 2010; 195: W139–45. doi: 10.2214/AJR.09.3369 [DOI] [PubMed] [Google Scholar]
- 26.Mitchell JH, Hadden TB, Wilson JM, Achari A, Muthupillai R, Flamm SD. Clinical features and usefulness of cardiac magnetic resonance imaging in assessing myocardial viability and prognosis in takotsubo cardiomyopathy (transient left ventricular apical ballooning syndrome. Am J Cardiol 2007; 100: 296–301. doi: 10.1016/j.amjcard.2007.02.091 [DOI] [PubMed] [Google Scholar]
- 27.Nakamori S, Matsuoka K, Onishi K, Kurita T, Ichikawa Y, Nakajima H, et al. Prevalence and signal characteristics of late gadolinium enhancement on contrast-enhanced magnetic resonance imaging in patients with takotsubo cardiomyopathy. Circ J 2012; 76: 914–21. doi: 10.1253/circj.CJ-11-1043 [DOI] [PubMed] [Google Scholar]
- 28.Rolf A, Nef HM, Möllmann H, Troidl C, Voss S, Conradi G, et al. Immunohistological basis of the late gadolinium enhancement phenomenon in tako-tsubo cardiomyopathy. Eur Heart J 2009; 30: 1635–42. doi: 10.1093/eurheartj/ehp140 [DOI] [PubMed] [Google Scholar]
- 29.Eitel I, von Knobelsdorff-Brenkenhoff F, Bernhardt P, Carbone I, Muellerleile K, Aldrovandi A, et al. Clinical characteristics and cardiovascular magnetic resonance findings in stress (takotsubo) cardiomyopathy. JAMA 2011; 306: 277–86. doi: 10.1001/jama.2011.992 [DOI] [PubMed] [Google Scholar]
- 30.Naruse Y, Sato A, Kasahara K, Makino K, Sano M, Takeuchi Y, et al. The clinical impact of late gadolinium enhancement in takotsubo cardiomyopathy: serial analysis of cardiovascular magnetic resonance images. J Cardiovasc Magn Reson 2011; 13: 67. doi: 10.1186/1532-429X-13-67 [DOI] [PMC free article] [PubMed] [Google Scholar]
- 31.Haaf P, Garg P, Messroghli DR, Broadbent DA, Greenwood JP, Plein S. Cardiac T1 mapping and extracellular volume (ECV) in clinical practice: a comprehensive review. J Cardiovasc Magn Reson 2016; 18: 89Available from. cited 2019 Sep 21. doi: 10.1186/s12968-016-0308-4 [DOI] [PMC free article] [PubMed] [Google Scholar]
- 32.Aikawa Y, Noguchi T, Morita Y, Tateishi E, Kono A, Miura H, et al. Clinical impact of native T1 mapping for detecting myocardial impairment in takotsubo cardiomyopathy. Eur Heart J Cardiovasc Imaging 2019; 20: 1147–55. doi: 10.1093/ehjci/jez034 [DOI] [PubMed] [Google Scholar]
- 33.Dabir D, Luetkens J, Kuetting DLR, Feisst A, Isaak A, Schild HH, et al. Cardiac magnetic resonance including parametric mapping in acute takotsubo syndrome: preliminary findings. Eur J Radiol 2019; 113: 217–24. doi: 10.1016/j.ejrad.2019.02.026 [DOI] [PubMed] [Google Scholar]
Associated Data
This section collects any data citations, data availability statements, or supplementary materials included in this article.


