

Key Points
Question
Is engagement with a mobile technology blood pressure self-management program associated with long-term blood pressure control?
Findings
In this cohort study of 28 189 US adults with elevated blood pressure or hypertension participating in a hypertension self-management program with a blood pressure monitor and connected smartphone application with clinically based digital coaching, most participants achieved and maintained lower blood pressure during a follow-up period that lasted as long as 3 years.
Meaning
These findings suggest that mobile technology hypertension self-management programs may be useful for real-world blood pressure monitoring and control.
This cohort study examines whether engagement with a hypertension self-management program with a blood pressure monitor and connected smartphone application was associated with blood pressure control among US adults.
Abstract
Importance
It is unclear whether mobile technology hypertension self-management programs are associated with blood pressure (BP) control.
Objective
To examine whether engagement with a hypertension self-management program with a BP monitor and connected smartphone application with clinically based digital coaching was associated with BP control during a follow-up period of as long as 3 years.
Design, Setting, and Participants
This cohort study enrolled US adults with elevated BP or hypertension between January 1, 2015, and July 1, 2020. The hypertension self-management program was provided through the participant’s (or their spouse’s) employer health plan.
Exposures
Program engagement, defined by average number of application sessions.
Main Outcomes and Measures
Systolic and diastolic BP measured by a US Food and Drug Administration–cleared BP monitor, with categories defined as normal (systolic BP, <120 mm Hg), elevated (systolic BP, 120-129 mm Hg), stage 1 hypertension (systolic BP, 130-139 mm Hg), and stage 2 hypertension (systolic BP ≥140 mm Hg). Other measures included age, gender, depression, anxiety, diabetes, high cholesterol, smoking, geographic region, area deprivation index, self-reported weight, and device-measured physical activity (steps per day).
Results
Among 28 189 participants (median [IQR] age, 51 [43-58] years; 9424 women [40.4%]; 13 902 men [59.6%]), median (IQR) baseline systolic BP was 129.5 mm Hg (120.5-139.6 mm Hg) and diastolic BP was 81.7 mm Hg (75.7-88.4 mm Hg). Median systolic BP at 1 year improved at least 1 category for 495 of 934 participants (53.0%) with baseline elevated BP, 673 of 966 (69.7%) with baseline stage 1 hypertension, and 920 of 1075 (85.7%) with baseline stage 2 hypertension. Participants in the program for 3 years had a mean (SEM) systolic BP reduction of 7.2 (0.4), 12.2 (0.7), and 20.9 (1.7) mm Hg compared with baseline for those starting with elevated, stage 1 hypertension, and stage 2 hypertension, respectively. Greater engagement was associated with lower systolic BP over time (high-engagement group: 131.2 mm Hg; 95% CI, 115.5-155.8 mm Hg; medium-engagement group: 133.4 mm Hg; 95% CI 116.3-159.5 mm Hg; low-engagement group: 135.5 mm Hg; 95% CI, 117.3-164.8 mm Hg; P < .001); these results persisted after adjusting for age, gender, depression, anxiety, diabetes, high cholesterol, smoking, area deprivation index rank, and US region, which was partially mediated by greater physical activity. A very high BP (systolic BP >180 mm Hg) was observed 11 637 times from 3778 participants. Greater engagement was associated with lower risk of very high BP; the estimated probability of a very high BP was greater in the low-engagement group (1.42%; 95% CI, 1.26%-1.59%) compared with the medium-engagement group (0.79%; 95% CI, 0.71%-0.87%; P < .001) and the high-engagement group (0.53%; 95% CI, 0.45%-0.60%; P < .001 for comparison with both groups).
Conclusions and Relevance
The findings of this study suggest that a mobile technology hypertension self-management program can support long-term BP control and very high BP detection. Such programs may improve real-world BP monitoring and control.
Introduction
Approximately 47% of US adults have hypertension, and it is estimated that only 22% of individuals with hypertension have adequate blood pressure (BP) control.1 BP self-monitoring has been proposed as an intervention to achieve better BP control.2 However, studies suggest that BP self-monitoring alone is insufficient to lower BP without other co-interventions, such as lifestyle counseling.3
Mobile technology interventions can be used to promote BP self-management and deliver automated lifestyle coaching.4 Studies suggest that mobile technology interventions are associated with lower systolic BP and lower diastolic BP.5,6,7 However, previous interventions have been heterogeneous, and there is little real-world evidence on engagement or long-term effects.4,5,6,7 Furthermore, it is unknown whether mobile technology interventions can identify individuals with very high BP.
Hello Heart is a hypertension self-management program with a blood pressure monitor and connected smartphone application (app). Participation in the program is associated with decreased BP for as long as 22 weeks.8 In a large population of individuals with elevated BP or hypertension, we investigated whether engagement with the hypertension self-management program was associated with BP control over a period of as long as 3 years as well as with risk of very high BP. We hypothesized that greater engagement would be associated with BP control and lower risk of very high BP.
Methods
Study Design and Participants
This is a cohort study of participants using a hypertension self-management program through the participant’s (or their spouse's) employer-based health plan, enrolling at any point in time between January 1, 2015, and July 1, 2020, in the United States. Individuals with a diagnosis or an insurance claim of elevated BP or hypertension and/or a pharmacy claim for a medication for the treatment or management of hypertension were invited to register in the program using mailed postcards, onsite promotion communications, and/or the employer’s benefits package online portal communications. Participation was voluntary, and participants signed terms of service and privacy policy agreements specifying their deidentified data could be used for research. Inclusion criteria required the individual (or spouse) to be an employee (or spouse) of 1 of 21 companies participating in the program and to record at least 2 BP measurements in the app at any time during the study period. All participant data were deidentified and securely encrypted. The program is compliant with the Health Insurance Portability and Accountability Act. This minimal risk study of deidentified was approved as exempt, and a waiver of informed consent was granted by the WCG institutional review board. This cohort study is reported in accordance with Strengthening the Reporting of Observational Studies in Epidemiology (STROBE) reporting guideline.9
Technology
The hypertension self-management program incorporates a US Food and Drug Administration–cleared Bluetooth-enabled BP monitor (Zewa UAM-910BT, Zewa UAM-900T, or A&D UA-651BLE BP cuffs) paired with a smartphone app. Participants track their BP, weight, and physical activity via personal mobile devices. The software incorporates medication adherence reminders and clinically based digital coaching to drive lifestyle changes (guideline-recommended nonpharmaceutical interventions for BP management) using algorithms based on usage patterns to personalize to each individual. The hypertension self-management program is designed to maximize user engagement by incorporating mobile health best practices including ease of use, gamification, artificial intelligence, straightforward comprehension, and clarity. The application organizes medical data in a centralized mobile platform and allows participants to remotely connect to their physician’s electronic health record to automatically populate laboratory and pharmaceutical use data. The user interface is available in English and Spanish.
Measurements
Baseline participant blood pressure was classified by the mean systolic BP during the first week: (1) normal, systolic BP of less than 120 mm Hg; (2) elevated, systolic BP between 120 and 129 mm Hg; (3) stage I hypertension, systolic BP between 130 and 139 mm Hg; or (4) stage 2 hypertension, systolic BP of 140 mm Hg or greater. Any systolic BP of 180 mm Hg or greater was considered a very high BP.
To assess BP over time, we evaluated median systolic and diastolic BP at the following time points: first week (week 0) and after 2 (weeks 1-2), 4 (weeks 3-4), 6 (weeks 5-6), 12 (weeks 11-12), 26 (weeks 24-27), 52 (weeks 48-55), 104 (weeks 96-111), and 155 (weeks 148-163) weeks from the first BP reading. Given that participants enrolled in the program at different times, the duration of follow-up was not the same for all participants, and not all participants provided data for all time points. We did not analyze data beyond 163 weeks.
Participant engagement with the program was classified by the number of sessions in which the participant engaged with the application during the defined BP measurement time points. The number of sessions in each time point was normalized and averaged across time points to form an overall user engagement score. This score was applied as a continuous variable and as a categorical variable by clustering it using K-means algorithm to 3 groups: low-, medium-, and high-engagement groups (eMethods in the Supplement).
Demographic data were collected when participants initially downloaded the app and included age, gender, geographic location, and relationship (employee or spouse). Participant comorbidities, including depression, anxiety, diabetes, high cholesterol, and smoking, were self-reported in the app. Area deprivation index was defined by the Neighborhood Atlas of the University of Wisconsin and divided into quintiles.10 US regions (Northeast, Midwest, West, or South) were defined by the US Census Bureau.11
Weight and height were self-reported in the app. Body mass index (BMI; calculated as weight in kilograms divided by height in meters squared) was estimated using self-reported weight and height. Physical activity was a feature that was added during the study period, and therefore, data were not available for all participants. Physical activity was tracked by steps per day, which were collected by Apple Health (iOS) or Google Fit (Android) apps.
Statistical Analysis
Sample size was determined by inclusion of all participants enrolling during the study period meeting inclusion criteria. A mixed model, with systolic or diastolic BP as the dependent variable, time from first BP measurement and engagement group as fixed variables, and company as random variable, was performed with and without adjusting for covariates of age, gender, depression, anxiety, diabetes, high cholesterol, smoking, area deprivation index rank, and US region for participants with elevated BP or hypertension. There were no participant-level random effects. Missing BP values were regarded as missing values in the mixed-effect model. We performed multiple imputation for missing data in covariates using an iterative imputer by modeling each variable with missing values as a function of other variables in a round-robin fashion. As the magnitude of the association of time changes over time, we performed specific linear mixed models for 2 different time ranges: weeks 0 to 12 and weeks 26 to 156.
To assess the association between engagement and very high BP, we modeled the probability of very high BP using a mixed model with engagement group as a fixed variable and company as a random variable, with and without adjusting for age, gender, depression, anxiety, diabetes, high cholesterol, smoking, area deprivation index rank, and US region. BP control following very high BP was assessed by calculating the percentage of participants with a subsequent decrease in BP in the next 10 days, including only participants with at least 1 measurement within 10 days of very high BP. To evaluate the association between a gradual increase in blood pressure with very high BP, a generalized mixed model (Poisson distribution), with percentage of participants with very high BP (within the month following systolic BP increase) as the dependent variable (number of very high BP measures as target and log of number of total measures as an added offset), number of BPs measured during the 3 week period as the independent fixed variable, and participants as the random variable, was analyzed.
To assess the association of weight with BP reduction, we used a mixed model with BP change (from the time of first weight measurement to the time of last weight measurement) as the dependent variable, BMI change (last BMI minus first BMI) along with BMI start value as the fixed independent variables, and company as a random variable. BP change was estimated as follows: for both the first and last weight measured, we searched for the week closest in time and evaluated its median systolic and diastolic values. Cases in which the closest week was longer than 4 weeks were excluded. We then subtracted the median BP measurements of the week closest to the first weight measurement from that of the last weight measurements to obtain a value for change in BP (systolic or diastolic). Mediation analysis was performed using Statsmodels python module,12 with systolic BP difference as the dependent variable, engagement group as the independent variable, first BMI as a covariate, and BMI difference as the mediator. Similar analysis was performed to assess the association of physical activity with BP reduction and whether physical activity mediated the association between engagement and blood pressure changes.
Statistical analyses were performed using the Python module statsmodels version 0.12.0. Statistical significance was set at P = .05, and tests for statistical significance were 2-tailed.
Results
Baseline Characteristics and Engagement
Among 28 189 participants meeting inclusion criteria, the median (IQR) age was 51 years (43-58 years), 9424 of 23 326 participants with gender data (40.4%) were women, and 13 902 (59.6%) were men (Table 1). The median (IQR) ADI was 50 (39-59), and 794 participants (3.2%) were in the highest ADI quantile (ie, most disadvantaged). The median (IQR) systolic and diastolic BP measurements at baseline were 129.5 mm Hg (120.5-139.6 mm Hg) and 81.7 mm Hg (75.7-88.4 mm Hg), respectively. The mean number of BP measurements per week ranged from a median (IQR) of 1.3 (0.6-2.8) for the low-engagement group to 2.8 (1.5-5.3) for the high-engagement group (Table 2). Engagement varied by gender (eTable 1 in the Supplement) and age (eTable 2 in the Supplement).
Table 1. Participant Characteristics.
| Characteristic | Participants, No./total No. (%) by engagementa | |||
|---|---|---|---|---|
| All (N = 28 189) | Low (n = 8199) | Medium (n = 12 417) | High (n = 7573) | |
| Age, median (IQR), yb | 51 (43-58) | 48 (39-56) | 50 (42-57) | 53 (47-59) |
| Sex | ||||
| Women | 9424/23 326 (40.4) | 2821/6547 (43.0) | 4262/10 416 (40.0) | 2341/6447 (36.0) |
| Men | 13 902/23 326 (59.6) | 3726/6547 (57.0) | 6154/10 416 (60.0) | 4106/6447 (64.0) |
| Comorbidities | ||||
| Depression | 1624/28 189 (5.8) | 531/8199 (6.5) | 714/12 417 (5.8) | 379/7573 (5.0) |
| Anxiety | 2899/28 189 (10.3) | 922/8199 (11.3) | 1306/12 417 (10.5) | 671/7573 (8.9) |
| Diabetes | 1340/28 189 (4.8) | 376/8199 (4.6) | 493/12 417 (4.0) | 471/7573 (6.2) |
| High cholesterol | 5191/28 189 (18.4) | 1358/8199 (17.7) | 2195/12 417 (17.7) | 1638/7573 (21.6) |
| Smoking | 189/3244 (6.2) | 57/782 (7.3) | 80/1329 (6.0) | 52/1133 (4.6) |
| ADI, median (IQR), percentilec | 50 (39-59) | 51 (39-59) | 50 (39-59) | 50 (38-59) |
| Lowest quintile ADI neighborhood | 794/25 284 (3.2) | 247/7376 (3.3) | 339/11 160 (3.0) | 208/6748 (3.1) |
| Region of country | ||||
| West | 2833/25 285 (11.2) | 733/7376 (9.9) | 1201/11 160 (10.8) | 899/7284 (12.3) |
| Midwest | 6941/25 285 (27.5) | 2196/7376 (29.8) | 3299/11 160 (29.6) | 1446/7284 (19.9) |
| South | 12 937/25 285 (51.2) | 3787/7376 (51.3) | 5573/11 160 (50.0) | 4112/7284 (56.5) |
| Northeast | 2574/25 285 (10.2) | 660/7376 (9.0) | 1087/11 160 (9.7) | 827/7284 (11.3) |
| Systolic blood pressure in the first week, median (IQR), mm Hg | 129.5 (120.5-139.6) | 130.0 (120.7-141.0) | 129.6 (120.6-139.5) | 128.6 (120.0-138.2) |
| Diastolic blood pressure in the first week, median (IQR), mm Hg | 81.7 (75.7-88.4) | 82.0 (75.6-89.0) | 81.9 (75.9-88.4) | 81.0 (75.4-87.5) |
Abbreviation: ADI, area deprivation index.
Engagement was categorized by the frequency with which the participant engaged with the application.
Age data were available for a total of 22 420 participants: 6336 in the low-engagement group, 9792 in the medium-engagement group, and 6292 in the high-engagement group.
ADI data were available for 25 284 total participants: 7376 in the low-engagement group, 11 160 in the medium-engagement group, and 6748 in the high-engagement group.
Table 2. Application Use.
| Use measure | Engagement frequency, median (IQR) | |||
|---|---|---|---|---|
| All | Engagement Groupa | |||
| Low | Medium | High | ||
| Weeks of useb | 25 (7-57) | 9 (2-30) | 23 (8-49) | 59 (28-101) |
| Weeks of use for participants enrolled before Oct 2019b | 41 (9-79) | 10 (2-42) | 34 (8-67) | 69 (37-110) |
| Use/wk | 1.8 (0.9-3.6) | 1.3 (0.6-2.8) | 1.7 (0.9-3.2) | 2.8 (1.5-5.3) |
Engagement was categorized by the frequency with which the participant engaged with the application.
Since participants enrolled in the program at different times during the study period, duration of follow-up was not the same for all participants and not all participants provided data for all time points.
BP Change Over Time
The Figure presents BP change over time from the first week of measurement for participants starting with normal BP, elevated BP, stage 1 hypertension, and stage 2 hypertension. Baseline BP was defined as the mean BP from the first week of measurement. Median systolic BP by year 1 was reduced for 495 of 934 participants (53.0%) with baseline elevated BP, 673 of 966 (69.7%) with baseline stage 1 hypertension, and 920 of 1075 (85.7%) with baseline stage 2 hypertension (Table 3). Participants who continued the program for 3 years maintained these lower levels, with a mean (SEM) reduction of 7.2 (0.4), 12.2 (0.7), and 20.9 (1.7) mm Hg systolic BP compared with baseline for those starting with elevated, stage 1 and stage 2 hypertension, respectively. A sensitivity analysis including only participants with 4 BP measurements in the first week and placing individuals in categories based on the mean of 4 measurements revealed a similar pattern (eFigure 1 in the Supplement).
Figure. Blood Pressure Change Over Time by Baseline Blood Pressure.
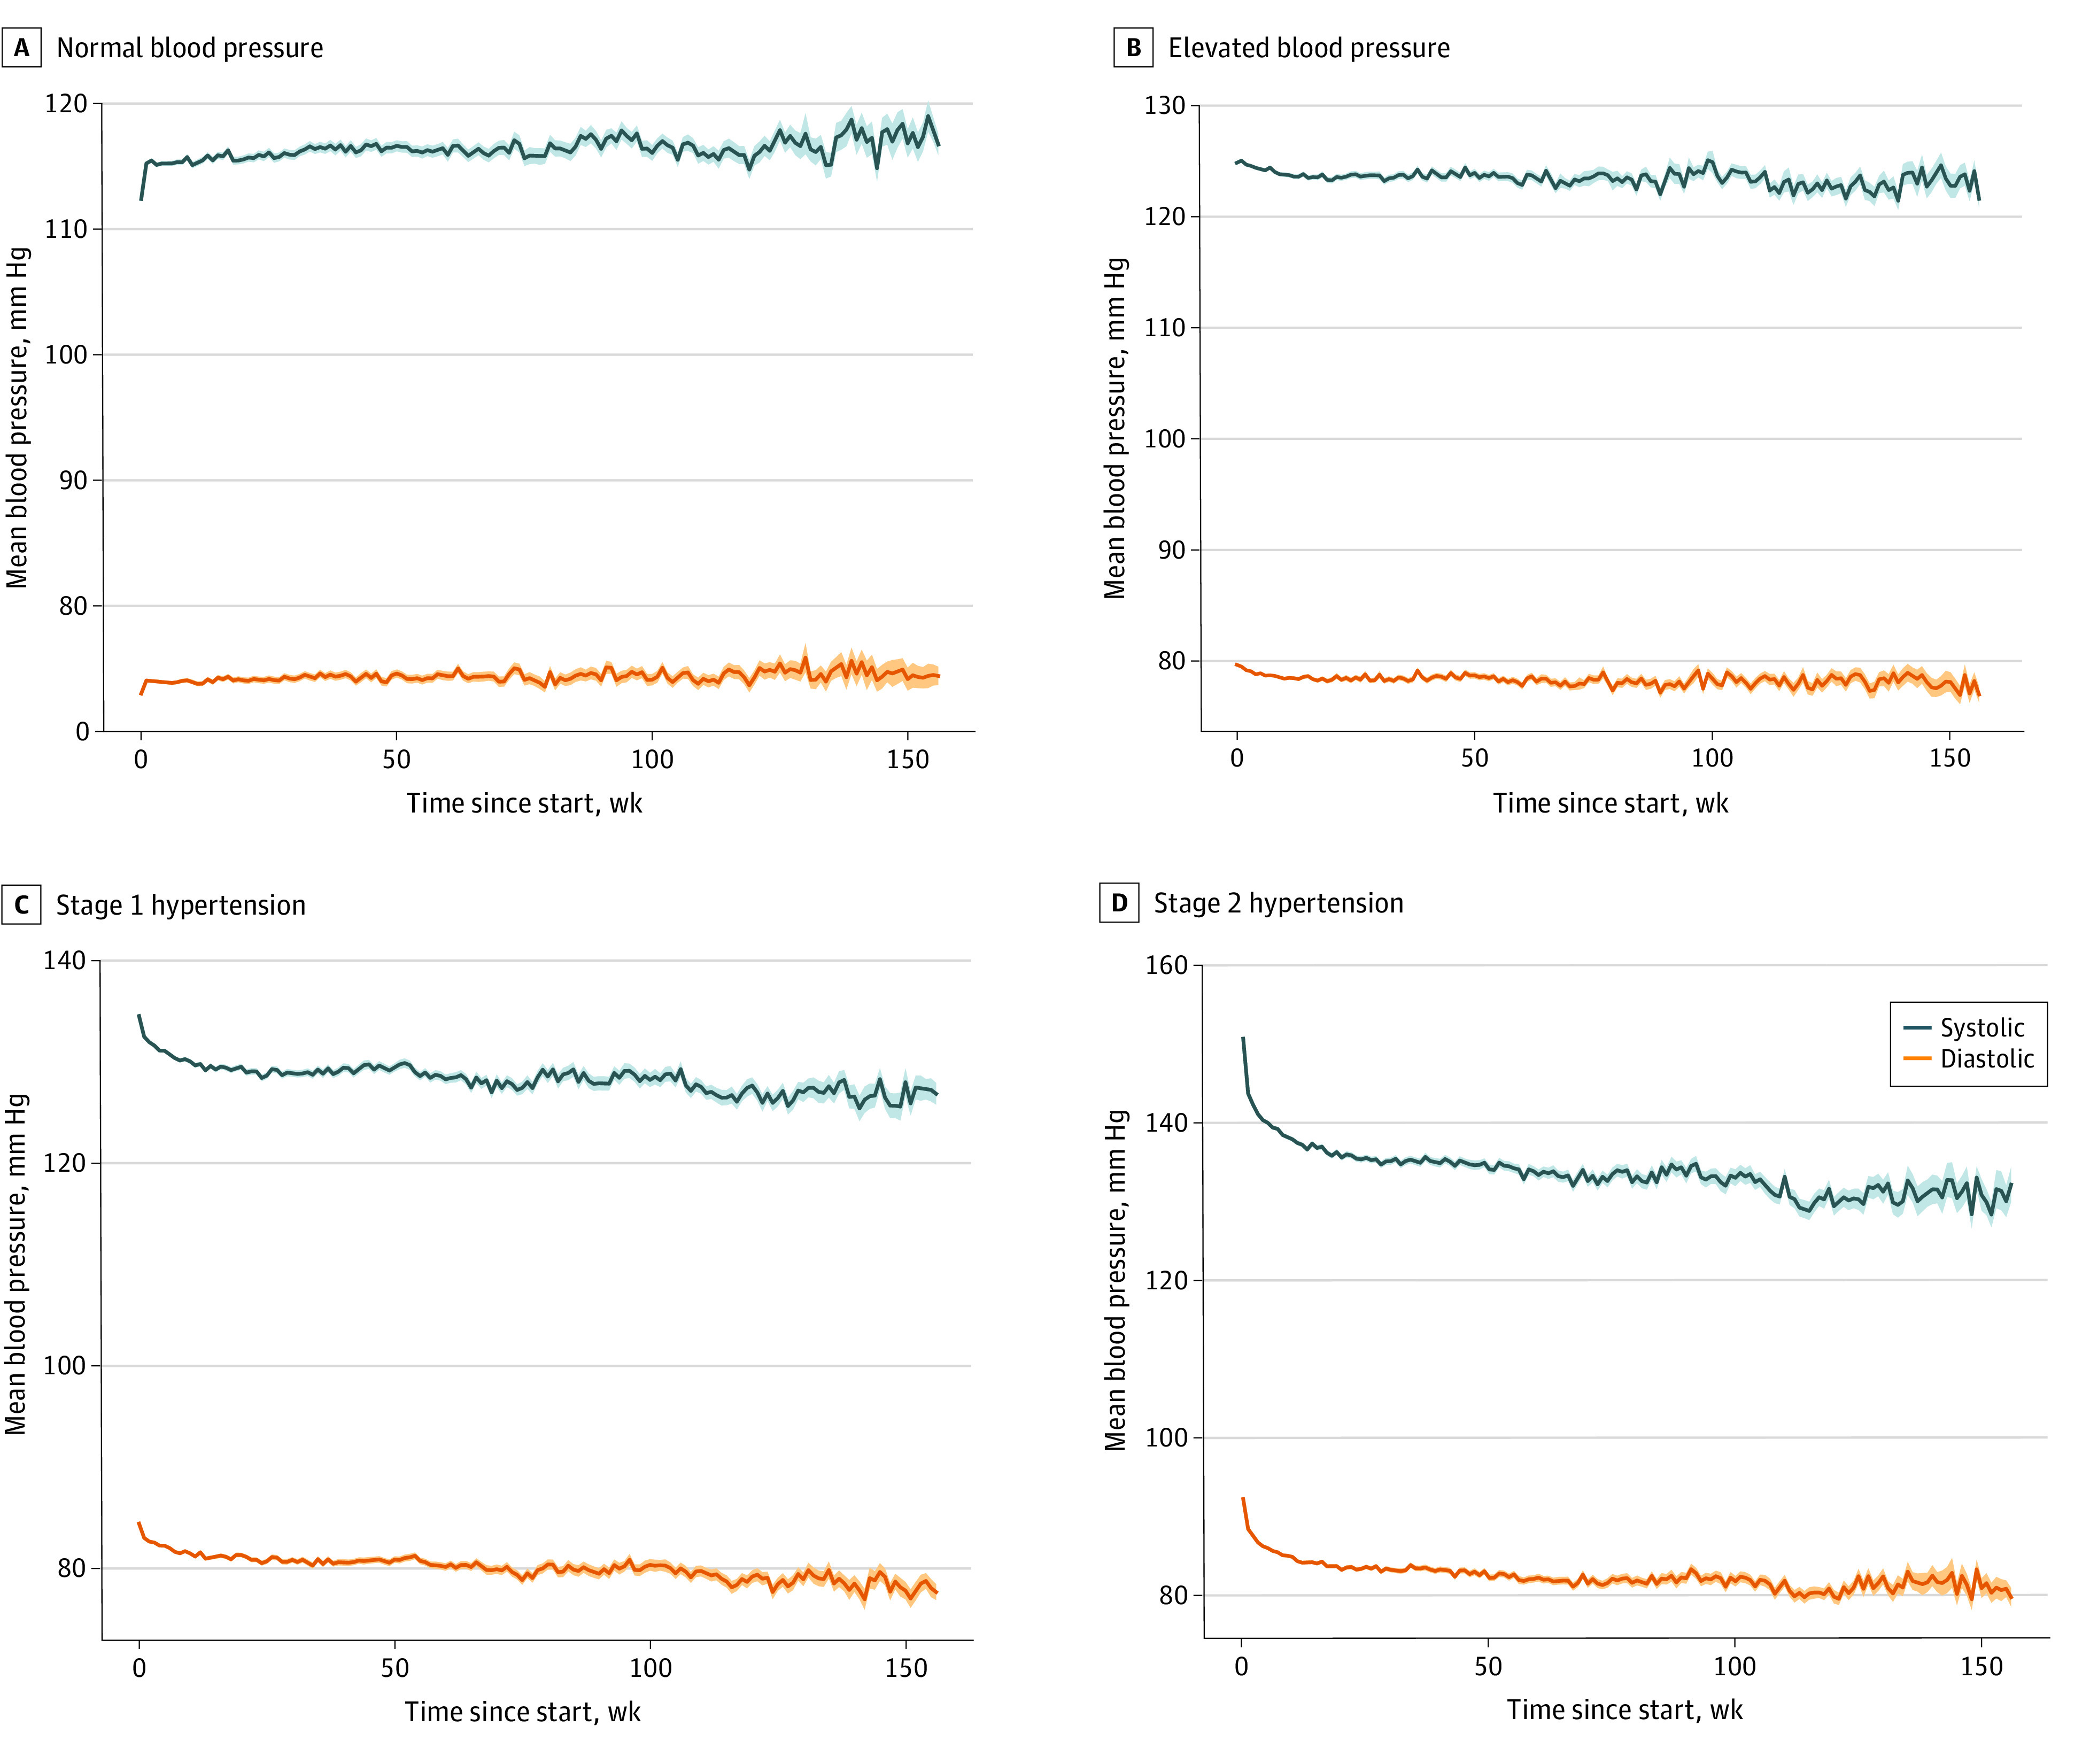
Normal blood pressure was defined as systolic blood pressure of less than 120 mm Hg; elevated blood pressure, systolic blood pressure of 120 to 129 mm Hg; stage 1 hypertension, systolic blood pressure of 130 to 139 mm Hg, and stage 2 hypertension, systolic blood pressure of 140 mm Hg or greater. Shaded areas indicate 95% CIs.
Table 3. BP Reduction Over Time by Initial BP Category.
| Time from enrollment | Included weeks | Participants, No.a | Participants who reduced median systolic BP, No. (%) | Mean difference in systolic BP (SEM)b | Mean difference in diastolic BP (SEM)b |
|---|---|---|---|---|---|
| Elevated BP | |||||
| 2 wk | 1-2 | 3363 | 1705 (50.7) | –6.3 (0.1) | –3.0 (0.1) |
| 4 wk | 3-4 | 3006 | 1611 (53.6) | –6.9 (0.1) | –3.7 (0.1) |
| 6 wk | 5-6 | 2630 | 1428 (54.3) | –7.3 (0.1) | –3.9 (0.1) |
| 12 wk | 11-12 | 1797 | 1021 (56.8) | –8.4 (0.2) | –4.6 (0.2) |
| 26 wk | 24-27 | 1269 | 717 (56.5) | –8.2 (0.2) | –4.6 (0.2) |
| 1 y | 48-55 | 934 | 495 (53.0) | –7.9 (0.2) | –4.4 (0.2) |
| 2 y | 96-111 | 489 | 258 (52.8) | –7.5 (0.3) | –4.7 (0.3) |
| 3 y | 148-163 | 154 | 83 (53.7) | –7.2 (0.4) | –4.4 (0.6) |
| Stage 1 hypertension | |||||
| 2 wk | 1-2 | 3291 | 2047 (62.2) | –7.9 (0.1) | –3.5 (0.1) |
| 4 wk | 3-4 | 2869 | 1859 (64.8) | –8.8 (0.1) | –4.3 (0.1) |
| 6 wk | 5-6 | 2513 | 1654 (65.8) | –9.4 (0.1) | –4.6 (0.1) |
| 12 wk | 11-12 | 1788 | 1250 (69.9) | –10.3 (0.2) | –5.2 (0.2) |
| 26 wk | 24-27 | 1372 | 1002 (73.0) | –11.0 (0.2) | –5.6 (0.2) |
| 1 y | 48-55 | 966 | 673 (69.7) | –10.2 (0.2) | –5.4 (0.2) |
| 2 y | 96-111 | 436 | 318 (72.9) | –10.4 (0.3) | –5.9 (0.4) |
| 3 y | 148-163 | 131 | 99 (75.3) | –12.2 (0.7) | –6.8 (0.6) |
| Stage 2 hypertension | |||||
| 2 wk | 1-2 | 3757 | 2814 (74.9) | –12.9 (0.2) | –5.6 (0.1) |
| 4 wk | 3-4 | 3272 | 2585 (79.0) | –14.7 (0.2) | –7.0 (0.2) |
| 6 wk | 5-6 | 2917 | 2351 (80.6) | –15.7 (0.2) | –7.5 (0.2) |
| 12 wk | 11-12 | 2061 | 1748 (84.8) | –17.5 (0.3) | –8.7 (0.2) |
| 26 wk | 24-27 | 1630 | 1410 (86.5) | –19.0 (0.3) | –9.5 (0.3) |
| 1 y | 48-55 | 1074 | 920 (85.7) | –19.2 (0.4) | –9.6 (0.4) |
| 2 y | 96-111 | 419 | 370 (88.4) | –19.4 (0.6) | –10.1 (0.6) |
| 3 y | 148-163 | 108 | 91 (84.4) | –20.9 (1.7) | –11.6 (1.9) |
Abbreviations: BP, blood pressure; SEM, standard error of mean.
Number of participants at each time represents participants who had been enrolled in the program long enough to have reached that point and who had application activity during the weeks listed. Since participants enrolled in the program at different times during the study period, duration of follow-up was not the same for all participants and not all participants provided data for all time points.
Differences were calculated only in participants who reduced systolic BP.
Among participants who started with stage 2 hypertension, 2150 of 4464 (48.2%), 1988 of 3909 (50.9%), 1521 of 2590 (58.7%), 1293 of 2007 (64.4%), 842 of 1323 (63.6%), and 354 of 507 (69.8%) improved their BP control after 4, 6, 12, 26, 52, and 104 weeks, respectively, from their first measurement. Similarly, among participants who started with stage 1 hypertension, 2059 of 4714 (43.7%), 1882 of 4090 (46.0%), 1403 of 2742 (51.2%), 1068 of 1992 (53.6%), 774 of 1505 (51.4%), and 366 of 642 (57.0%) improved their BP control after 4, 6, 12, 26, 52, and 104 weeks, respectively (eFigure 2 in the Supplement). Improvement in BP control was defined as at least 1 stage improvement (eg, from stage 2 to systolic BP <140 mm Hg or from stage 1 to systolic BP <130 mm Hg).
Association of Engagement With BP Over Time
Greater engagement with the app was associated with lower systolic BP in a mixed-effects model, with high-engagement participants having lower model-estimated mean systolic BP over time than medium-engagement or low-engagement participants (high-engagement: 131.2 mm Hg; 95% CI, 115.5-155.8 mm Hg; medium-engagement: 133.4 mm Hg; 95% CI 116.3-159.5 mm Hg; low-engagement: 135.5 mm Hg; 95% CI, 117.3-164.8 mm Hg; P < .001). Greater engagement was also associated with lower diastolic BP in a mixed-effects model, with high-engagement participants having lower diastolic BP over time than medium-engagement or low-engagement participants (high-engagement: 82.0 mm Hg; 95% CI 67.5-97.7 mm Hg; medium-engagement: 83.5 mm Hg; 95% CI, 69.0-100.3 mm Hg; low-engagement: 84.7 mm Hg; 95% CI, 69.0-104.5 mm Hg; P < .001). These differences persisted after adjusting for age, gender, depression, anxiety, diabetes, high cholesterol, smoking, area deprivation index, and region (eTable 3 in the Supplement). An association between engagement and BP was also observed when normalized engagement score was considered as a continuous variable, with each unit increase in engagement associated with a lower systolic BP (0.85 mm Hg; 95% CI, 0.78-0.93 mm Hg; P < .001) and diastolic BP (0.60 mm Hg; 95% CI, 0.55-0.66 mm Hg; P < .001).
Participants had 0.5 mm Hg (95% CI, 0.3-0.6 mm Hg) lower systolic BP per week in the period from 0 to 12 weeks across all engagement groups (P < .001). Participants had 0.3 mm Hg (95% CI, 0.3-0.4 mm Hg) lower diastolic BP per week in the period from 0 to 12 weeks (P < .001). BP reduction until week 12 was achieved for all engagement groups (eTable 4 in the Supplement). From 26 weeks onward, participants maintained BP, and no significant change in systolic or diastolic BP was observed.
Very High Blood Pressure
A very high BP (systolic BP >180 mm Hg) was observed 11 637 times from 3778 participants. The estimated probability of a very high BP was greater in the low-engagement group (1.42%; 95% CI, 1.26%-1.59%) compared with the medium-engagement group (0.79%; 95% CI, 0.71%-0.87%; P < .001) and the high-engagement group (0.53%; 95% CI, 0.45%-0.60%; P < .001 for comparison with both groups). After adjusting for age, gender, depression, anxiety, diabetes, high cholesterol, smoking, area deprivation index, and region, the association between engagement and risk of very high BP remained statistically significant.
Among very high BP events with at least 1 BP measurement within 10 days following a very high BP, 8509 of 9474 participants (89.8%) had systolic BP less than 180 mm Hg. Participants were observed to have gradually higher systolic BP in the 30 days before very high BP and a rapid decrease in systolic BP in the 30 days after (eFigure 3 in the Supplement). Among 882 participants with weekly mean systolic BP of greater than 140 mm Hg who were observed to have an increase of more than 10 mm Hg in mean weekly systolic BP over 3 weeks (without systolic BP >180 mm Hg), we evaluated the association of number of BP measurements entered into the app with probability of a very high BP and found that a greater number of BP measurements was associated with a lower probability of very high BP (eFigure 3 in the Supplement).
BP, Engagement, BMI, and Physical Activity
We investigated whether the association of engagement with BP was mediated by changes in participant BMI or physical activity. Changes in weight could be evaluated in 3229 participants who had recorded more than 1 weight more than 1 month apart; these were the only participants included in the analysis of BMI. We found that for each unit decrease in BMI there was a 0.74 mm Hg (95% CI, 0.19-1.29 mm Hg) decrease in systolic BP . No association with BMI and diastolic BP was found. Participants with obesity (BMI ≥30) had a greater decrease in systolic BP compared with those with normal weight (BMI 18.5 to <25; mean difference, 2.36 mm Hg; 95% CI, 0.93-3.78 mm Hg) or with overweight (BMI 25 to <30; mean difference, 1.57 mm Hg; 95% CI, 0.56-2.59 mm Hg; P for interaction < .001). Participants with obesity had a greater decrease in diastolic BP compared with those with normal weight (mean difference, 1.60 mm Hg; 95% CI, 0.60-2.59 mm Hg) or overweight (mean difference, 0.97 mm Hg; 95% CI, 0.26-1.67; P for interaction < .001). BMI change was not associated with engagement. Mediation analysis did not demonstrate that BMI mediated the association between engagement and reduction in either systolic or diastolic BP.
Physical activity, represented by daily steps, could be evaluated in 590 participants with connected data available in the same weeks as BP measurements. For each 1000-step increase in daily steps, there was a 0.8 mm Hg (95% CI, 0.08-1.48 mm Hg) lower systolic BP (P = .03). There was no statistically significant association between steps and diastolic BP. Participants in the high-engagement group (mean, 5236 steps/d; 95% CI, 4881-5590 steps/d) had higher physical activity than the medium-engagement group (4552 steps/d; 95% CI, 4131-4974 steps/d; P = .02). There was not a statistically significant difference between the low-engagement group and the other 2 groups (4841 steps/d; 95% CI, 4086-5596 steps/d). We found that daily steps partially mediated the association between engagement and BP reduction (proportion mediated, 17%; P = .04). There was not a statistically significant association with diastolic BP.
Discussion
In a large cohort of individuals with elevated BP or hypertension, engagement in a hypertension self-management program with a BP monitor and connected smartphone app with clinically based automated lifestyle coaching was associated with lower BP, with follow-up for as long as 3 years. The observation of very high BP could be made, with subsequent BP measurements at safer levels. Among individuals with objectively measured physical activity data available, higher physical activity partially mediated the association between engagement and lower BP, suggesting that the automated lifestyle coaching may influence BP in part by encouraging individuals to be physically active.
Previous studies of mobile technology–facilitated BP self-management interventions have found significant associations with BP control.5,6,7,13 This study’s findings of the association of engagement in a BP control program with lower BP in a real-world setting are consistent with these. Moreover, to our knowledge, this is the first study reporting long-term experience with a digital health application for hypertension management, with a magnitude of association that is potentially clinically meaningful. One small, underpowered study of BP self-monitoring and automated lifestyle coaching through a smartphone app did not show significant differences in BP control but did show improvements in self-confidence and physical activity.14 This study confirms an association with physical activity and suggests that physical activity may partially mediate the association between engagement and lower BP. This aligns with BP guideline recommendations for physical activity as a nonpharmacologic intervention.2 However, future studies should evaluate the nonlinearity of this association, as it may be limited to low or moderate activity.15,16 Although weight loss was associated with lower BP, weight loss did not appear to mediate the association between engagement and lower BP. Thus, other factors were likely responsible for the association of engagement and lower BP. Such factors may include medication adherence, sodium intake reduction, stress management, and sleep management, which are encouraged by the app’s recommendation system.
There has been little evidence published on the association of mobile technology–facilitated BP self-management with very high BP; our study suggests that engagement with a self-management program may be associated with lower risk of a very high BP. It also suggests that the program can play a clinically meaningful role even for the less-engaged population, since the program detected both very high BP and subsequent improvement in BP, even in less-engaged participants.
The strengths of this study are the large population of patients participating in the BP self-management program with as long as 3 years of real-world follow-up data. Previous studies have reported outcomes for as long as 18 months.6 Although not all participants contributed data for 3 years, it is notable that some participants continued to use the program and experienced continued BP control long-term. Additionally, this study was able to examine objectively measured physical activity as a mediator of the association between engagement and BP control. This is an important finding that helps us understand potential mechanisms for how automated lifestyle coaching may be associated with BP control. It also implies that different automated interventions of smartphone solutions may have different real-world associations with engagement, physical activity, and BP.
Since hypertension is a common disease with serious health consequences, including heart disease and stroke, and traditional strategies have been ineffective in achieving adequate BP control in the population, it is imperative to identify scalable interventions that can achieve BP control.1,2 This real-world evidence of a BP self-management program with a BP monitor connected to a smartphone app with automated lifestyle coaching demonstrates the potential of this strategy to achieve better BP control. Future studies should examine the efficacy and dissemination of mobile technology–facilitated BP self-management interventions and their real-world effectiveness in other settings and populations as well as deeper investigations into the mechanisms that drive their effects on BP control.
Limitations
This study has limitations. It was conducted in a population of middle-aged individuals with employer-sponsored health insurance. Results may not generalize to older individuals or those in safety-net populations. Although the sample size was very large, we cannot exclude the possibility of selection bias due to loss to follow-up, since not all participants remained engaged in the program over time. Healthy adherers may have been more likely to continue in the program long term. We cannot rule out that participation in the program was associated with a Hawthorne effect, with participants behaving differently because they are being monitored. Additionally, there may be residual confounding due to unmeasured factors. However, it is notable that associations were significant with adjustment for age, gender, depression, anxiety, diabetes, high cholesterol, smoking, region, and neighborhood socioeconomic status. We cannot exclude the possibility that improvement of BP over time represents regression to the mean, but a sensitivity analysis including an average of 4 measurements suggested similar results, indicating that measurement error from a single measurement is not the sole explanation of observed differences. Measurement error may be present in the identification of participants with very high BP. Measurement error may be present in the measurement of physical activity with smartphones, given that individuals do not always carry smartphones in a way that accurately reflects the individual’s physical activity. Because of the observational nature of the study, we are unable to make causal conclusions.
Conclusions
In this study, participants in a BP self-management program with a BP monitor connected to a smartphone app with automated lifestyle coaching on BP control achieved long-term control of BP. This real-world evidence suggests that mobile technology may be useful for BP monitoring and control.
eTable 1. Application Use by Gender
eTable 2. Application Use by Age
eTable 3. Adjusted Associations Between Blood Pressure, Engagement, and Time Since Enrollment
eTable 4. Blood Pressure Change Over Time by Engagement Group
eFigure 1. Blood Pressure Change Over Time for Participants With 4 or More Readings in First Week
eFigure 2. Change in Blood Pressure Control Over Time
eFigure 3. Very High Blood Pressure Temporal Profile and Association With Engagement
eMethods.
References
- 1.Virani SS, Alonso A, Aparicio HJ, et al. ; American Heart Association Council on Epidemiology and Prevention Statistics Committee and Stroke Statistics Subcommittee . Heart disease and stroke statistics—2021 update: a report from the American Heart Association. Circulation. 2021;143(8):e254-e743. doi: 10.1161/CIR.0000000000000950 [DOI] [PubMed] [Google Scholar]
- 2.Whelton PK, Carey RM, Aronow WS, et al. 2017 ACC/AHA/AAPA/ABC/ACPM/AGS/APhA/ASH/ASPC/NMA/PCNA guideline for the prevention, detection, evaluation, and management of high blood pressure in adults: a report of the American College of Cardiology/American Heart Association Task Force on Clinical Practice Guidelines. Hypertension. 2018;71(6):e13-e115. doi: 10.1161/HYP.0000000000000065 [DOI] [PubMed] [Google Scholar]
- 3.Tucker KL, Sheppard JP, Stevens R, et al. Self-monitoring of blood pressure in hypertension: a systematic review and individual patient data meta-analysis. PLoS Med. 2017;14(9):e1002389. doi: 10.1371/journal.pmed.1002389 [DOI] [PMC free article] [PubMed] [Google Scholar]
- 4.Burke LE, Ma J, Azar KMJ, et al. ; American Heart Association Publications Committee of the Council on Epidemiology and Prevention, Behavior Change Committee of the Council on Cardiometabolic Health, Council on Cardiovascular and Stroke Nursing, Council on Functional Genomics and Translational Biology, Council on Quality of Care and Outcomes Research, and Stroke Council . Current science on consumer use of mobile health for cardiovascular disease prevention: a scientific statement from the American Heart Association. Circulation. 2015;132(12):1157-1213. doi: 10.1161/CIR.0000000000000232 [DOI] [PMC free article] [PubMed] [Google Scholar]
- 5.Alessa T, Abdi S, Hawley MS, de Witte L. Mobile apps to support the self-management of hypertension: systematic review of effectiveness, usability, and user satisfaction. JMIR Mhealth Uhealth. 2018;6(7):e10723. doi: 10.2196/10723 [DOI] [PMC free article] [PubMed] [Google Scholar]
- 6.Lu X, Yang H, Xia X, et al. Interactive mobile health intervention and blood pressure management in adults. Hypertension. 2019;74(3):697-704. doi: 10.1161/HYPERTENSIONAHA.119.13273 [DOI] [PubMed] [Google Scholar]
- 7.Liu K, Xie Z, Or CK. Effectiveness of mobile app-assisted self-care interventions for improving patient outcomes in type 2 diabetes and/or hypertension: systematic review and meta-analysis of randomized controlled trials. JMIR Mhealth Uhealth. 2020;8(8):e15779. doi: 10.2196/15779 [DOI] [PMC free article] [PubMed] [Google Scholar]
- 8.Kaplan AL, Cohen ER, Zimlichman E. Improving patient engagement in self-measured blood pressure monitoring using a mobile health technology. Health Inf Sci Syst. 2017;5(1):4. doi: 10.1007/s13755-017-0026-9 [DOI] [PMC free article] [PubMed] [Google Scholar]
- 9.von Elm E, Altman DG, Egger M, Pocock SJ, Gøtzsche PC, Vandenbroucke JP; STROBE Initiative . The Strengthening the Reporting of Observational Studies in Epidemiology (STROBE) statement: guidelines for reporting observational studies. Ann Intern Med. 2007;147(8):573-577. doi: 10.7326/0003-4819-147-8-200710160-00010 [DOI] [PubMed] [Google Scholar]
- 10.Kind AJH, Buckingham WR. Making neighborhood-disadvantage metrics accessible—the Neighborhood Atlas. N Engl J Med. 2018;378(26):2456-2458. doi: 10.1056/NEJMp1802313 [DOI] [PMC free article] [PubMed] [Google Scholar]
- 11.US Department of Commerce, US Census Bureau . Census Regions and Divisions of the United States. Accessed April 2, 2021. https://www2.census.gov/geo/pdfs/maps-data/maps/reference/us_regdiv.pdf
- 12.Seabold S, Perktold J. Statsmodels: econometric and statistical modeling with Python. Proc Ninth Python in Science Conf. 2010:92-96. doi: 10.25080/Majora-92bf1922-011 [DOI] [Google Scholar]
- 13.Xu K, James R, Lu W, Sangha A, Shah BR. Abstract 15430: more frequent remote home monitoring decreases blood pressure in an unselected population of people with diabetes. Circulation. 2019;140(Suppl_1):A15430. doi: 10.1161/circ.140.suppl_1.15430 [DOI] [Google Scholar]
- 14.Persell SD, Peprah YA, Lipiszko D, et al. Effect of home blood pressure monitoring via a smartphone hypertension coaching application or tracking application on adults with uncontrolled hypertension: a randomized clinical trial. JAMA Netw Open. 2020;3(3):e200255. doi: 10.1001/jamanetworkopen.2020.0255 [DOI] [PMC free article] [PubMed] [Google Scholar]
- 15.Nelson L, Jennings GL, Esler MD, Korner PI. Effect of changing levels of physical activity on blood-pressure and haemodynamics in essential hypertension. Lancet. 1986;2(8505):473-476. doi: 10.1016/S0140-6736(86)90354-5 [DOI] [PubMed] [Google Scholar]
- 16.Durand MJ, Gutterman DD. Exercise and vascular function: how much is too much? Can J Physiol Pharmacol. 2014;92(7):551-557. doi: 10.1139/cjpp-2013-0486 [DOI] [PMC free article] [PubMed] [Google Scholar]
Associated Data
This section collects any data citations, data availability statements, or supplementary materials included in this article.
Supplementary Materials
eTable 1. Application Use by Gender
eTable 2. Application Use by Age
eTable 3. Adjusted Associations Between Blood Pressure, Engagement, and Time Since Enrollment
eTable 4. Blood Pressure Change Over Time by Engagement Group
eFigure 1. Blood Pressure Change Over Time for Participants With 4 or More Readings in First Week
eFigure 2. Change in Blood Pressure Control Over Time
eFigure 3. Very High Blood Pressure Temporal Profile and Association With Engagement
eMethods.