

Abstract
The redox state of mitochondria is determined by the levels of reducing and oxidizing species in the organelle, which reflects mitochondrial metabolic activity and overall fitness. Mitochondria are also the primary endogenous source of reactive oxygen species (ROS). This chapter describes methods to measure the mitochondrial superoxide levels and the redox state of the organelle in mammalian cells and yeast. We describe use dyhydroethidium (DHE) and MitoSOX (a derivative of dihydroethidium bound to a lipophilic cation) to detect mitochondrial superoxide in yeast and mammalian cells, respectively. We also describe use of genetically encoded fluorescent biosensors for quantitative analysis of mitochondrial NADPH levels (iNap) in mammalian cells and mitochondrial redox state (mito-roGFP) in yeast.
Rationale
The redox state of mitochondria is determined by the levels of reducing and oxidizing species in the organelle, including NAD+/NADH, FAD/FADH2, NADP+/NADPH, glutathione/gluthathione disulfide (GSH/GSSG) and reactive oxygen species (ROS). Conversely, the level of these molecules reflects mitochondrial metabolic activity and overall fitness. For example, uncoupling mitochondria or hypoxia affects mitochondrial respiratory activity and alters the ratio of NAD+ to NADH in the organelle. ROS produced from leakage of electrons from the electron transport chain or from the deamination of amines via monoamine oxidase in the outer mitochondrial membrane (Cadenas & Davies, 2000), can damage lipids, proteins and nucleic acids, and has been linked to aging and age-associated neurodegenerative diseases (Lin & Beal, 2006; Mammucari & Rizzuto, 2010; Schon & Przedborski, 2011). However, ROS also plays a role in signal transduction in mitochondria, through oxidation of GSH. For example, NADH dehydrogenase not only contributes to ROS production but is also regulated through interactions with the glutathione pool (Beer et al., 2004; Taylor et al., 2003). α-Ketoglutarate dehydrogenase and aconitase, components of the TCA cycle, exhibit reduced activity in oxidizing environments (Nulton-Persson & Szweda, 2001; Tretter & Adam-Vizi, 2000). Indeed, redox-dependent regulation of aconitase activity is conserved from bacteria to mammalian cells (Gardner & Fridovich, 1993; Gardner, Raineri, Epstein, & White, 1995). Thus, monitoring the redox state of mitochondria is crucial to understanding its function.
Biochemical methods have been used to assess cellular redox state based on measuring the levels of the redox pair GSH/GSSG (Schafer & Buettner, 2001). However, these methods provide an average of GSH/GSSG levels in all compartments of the cell and cannot be carried out in living cells. Other methods, which rely on GSH/GSSG measurements in subcellular fractions, are potentially problematic because the redox state of the compartment of interest may change during isolation of mitochondria. The use of mitochondria-targeted genetically encoded ratiometric fluorescent protein biosensors and membrane permeable non-invasive fluorescence dyes to visualize mitochondrial redox state in living cells overcomes many of these obstacles.
I. Visualization of mitochondrial ROS in C2C12 Myotubes
Rationale
Fluorescence microscopy–based imaging allows for in situ visualization of ROS in cells or tissues. Although mitochondria are the major source of ROS production in the cell, they are not the only source of ROS. Therefore, the development of fluorescent dyes that detect ROS and accumulate specifically within mitochondria provides a means for visualization and quantitative analysis of mitochondrial ROS. MitoSOX is a derivative of dihydroethidium that rapidly accumulates in actively respiring mitochondria due to its covalent link to triphenylphosphonium ion (TPP+), a lipophilic cation that promotes MitoSOX uptake by mitochondria (Kalyanaraman, 2011; Kauffman et al., 2016). Oxidation of MitoSOX by superoxide leads to the formation of 2-hydroxyethidium, which is retained by mitochondria and exhibits red fluorescence, the intensity of which is enhanced by the presence of nucleic acids (Robinson, Janes, & Beckman, 2008; H. Zhao et al., 2005). MitoSOX has been used to detect superoxide anion production within mitochondria using fluorometry, microscopy or flow cytometry. Here, we describe a method to measure mitochondrial ROS in C2C12 cells using fluorescence microscopy. To confirm that MitoSOX localizes to mitochondria, we use a mitochondrial-targeted dye that is membrane potential-insensitive, such as Mitotracker Green.
Materials, equipment and reagents
Materials
Cell culture equipment (tissue culture hood, microscope, CO2 incubator, etc.)
Glass bottom 35 mm Dish, No 1.5 coverslip, 10 mm glass diameter, collagen coated (MatTek Corporation, Ref. P35GCOL-1.5-10-C).
Equipment
Nikon A1 Laser scanning confocal microscope equipped with an inverted TiE Eclipse stand (Nikon Instruments, Melville, NY) , 40x/1.4NA objective, 488 nm laser line and emission filter 500–550 nm (to detect MitoTracker Green), 561 nm laser line and emission filter 570–620nm (to detect MitoSox), and a stage top incubator (Tokai Hit, Japan) for temperature and humidity control.
Reagents
Growth medium: Dulbecco’s modified Eagle medium (DMEM) high glucose (Gibco, Ref. 11965118), 20% Fetal Bovine Serum (Thermo Fisher, Ref. 10437028) and 1% Penicillin/Streptomycin (Sigma Aldrich, Ref. P4333).
Differentiation medium: DMEM high glucose, 2% Horse Serum (Thermo Fisher, Ref. 16050122) and 1% Penicillin/Streptomycin (Sigma Aldrich, Ref. P4333).
Phenol red-free DMEM medium (Gibco, Ref. 21063-029)
Trypsin-EDTA (0.25%), phenol red (Thermo Fisher, Ref. 25200056)
Phosphate Buffer pH 7.4 (Thermo Fisher, Ref. 10010)
MitoSOX™ Red Mitochondrial Superoxide indicator (Invitrogen, Ref. M36008)
Mitotracker Green FM (Molecular Probes, Ref. M7514)
Antimycin A (Sigma Aldrich, Ref. 8674)
Cytosine β-D-arabinofuranoside (AraC, Sigma Aldrich, Ref. C1768).
Trichostatin A (TSA, Sigma Aldrich, Ref. T8552)
Protocols
C2C12 cell culture and differentiation to form myotubes:
-
C2C12 cells are cultured in growth medium in collagen-coated 150 cm2 polystyrene flasks at 37°C in humidified atmosphere of 5% CO2.
CRITICAL STEP: To avoid premature myoblast differentiation, cells are kept at very low confluence (~40%) and propagated before they reach higher confluency.
Treat C2C12 myoblasts with trypsin. Seed at 1:10 dilution in growth medium into glass bottom dishes and grow at 37°C in humidified atmosphere containing 5% CO2 until they reach confluence.
Switch the cells from growth to differentiation medium and allow cells to differentiate for 5 days. Provide fresh differentiation medium every 24 hr.
On day 4 of differentiation, provide differentiation medium supplemented with 10 μg/mL of AraC.
On day 5 of differentiation, provide differentiation medium supplemented with 0.1 μM TSA and incubate for 24 hr.
Imaging of mitochondrial with Mitotracker Green and mitochondrial ROS with MitoSox:
-
Add 13 μL of DMSO to 50 μg of MitoSox (final concentration 5 mM).
CRITICAL STEP: protect from light.
-
Dilute 50 μg of Mitotracker Green to 1 mM using DMSO.
CRITICAL STEP: protect from light.
Wash cells twice with 1x PBS, which is pre-warmed to 37°C.
-
Prepare incubation medium by diluting MitoSOX to a final concentration of 1 μM and Mitotracker Green to a final concentration of 100 nM in phenol red-free DMEM medium.
TIP: Use the lowest concentration of MitoSOX that enables imaging without using excessive laser intensity. The concentration of MitoSox used must be optimized for each experiment condition and cell line.
CRITICAL STEP: MitoSOX will auto-oxidize when dissolved in aqueous solutions. MitoSox should be used within 30 min after it is dissolved in DMEM medium.
Incubate the cells for 30 min at 37°C (1 mL/plate) in incubation medium containing MitoSOX and Mitotracker Green.
Wash cells twice with phenol red-free DMEM medium.
Add 1 mL of phenol red-free DMEM medium to each dish and carry out live cell imaging.
- Acquire images using the following excitation/emission filters:
- Mitotracker Green: excitation/emission 490/516
- MitoSOX: excitation/emission 510/580
As positive control, add 1 μM antimycin A into the glass bottom dishes and incubate for 8 min prior to imaging.
Note: As a negative control, the commercially available mitochondrial-targeted antioxidant MitoTEMPO (Sigma-Aldrich, Ref. SML0737) can be used. However, MitoTEMPO accumulates in mitochondria in a membrane potential-dependent manner. Therefore, antioxidant activity will not be confined to mitochondria if membrane potential loss (Reily et al., 2013).
Analysis and statistics
ROS levels are measured using ImageJ software (NIH, Bethesda). To do so, regions within cells that contain mitochondria are identified by Mitotracker Green staining. The image is thresholded to generate a mask that defines the area that is occupied by mitochondria. The fluorescence of MitoSox is then measured in the mask. To determine the mean intensity of MitoSox, background fluorescence is subtracted from MitosSox fluorescence. For each experimental condition, the mean intensity of MitoSOX is measured in mitochondria of at least 50 cells. Data can be expressed as mean ± SD. Comparisons of multiple groups are analysed by one-way analysis of variance (ANOVA). Statistical significance for pairwise comparison was determined by using the Bonferroni test. P-values of < 0.05 are considered statistically significant.
ROS levels in mitochondria
Load the images onto ImageJ and split the channels. Go to Image tab → Color → Channels tool. In the Channels tool window go to More → Split Channels.
Draw a region of interest (ROI) in an area in the red (MitoSox) channel where there are no cells. Go to Measurement tab, export data including mean intensity to a spreadsheet for analysis as mean background intensity.
Draw a region of interest (ROI) in an area that contains mitochondria in myotubes in the green (Mitotracker Green) channel.
To threshold the image go to Image tab → Adjust → Threshold.
To create a mask from the thresholded image go to Edit tab → Selection → Create Mask.
To select the objects within the mask go to Edit tab → Selection → Create Selection.
Open the ROI Manager (Analyze → Tools → ROI Manager) and load each selection into the ROI Manager by selecting Add in the ROI Manager.
To measure MitoSOX mean intensity go to the red (MitoSox) channel, select each ROI in the ROI manager and select Measure. A new window will appear showing the Area, mean, min and max intensity.
Subtract the background intensity obtained in step 2 from the value measured in step 8.
Anticipated results
Superoxide levels are expected to increase in mitochondria in response to treatment with antimycin, as shown in Figure 1.
Figure 1.

Superoxide levels by MitoSOX staining in C2C12 myotubes treated with antimycin. Mitochondrial superoxide generation was visualized using MitoSOX staining (red) in cells incubated with or without antimycin (1 μM for 8 min). Total mitochondria were visualized using Mitotracker Green staining (green). Quantification of mitochondrial superoxide levels was performed by measuring mean MitoSOX intensity (n>50 cells per condition, two-tailed t-test * p<0.01). Scale bar = 20 μm.
Related techniques
Other techniques for ROS detection rely on the use of different compounds that are oxidized by specific ROS species which leads to an increase in their fluorescence intensity. Dihydroethidine (DHE), the reduced form of ethidium bromide stain, is a probe specifically oxidized by superoxide anions. Once oxidized, there is an increase in DHE fluorescence (Degli Esposti, 2002). The fluorogenic probe dichlorodihydrofluorescein diacetate (DCFDA) is oxidized mainly by hydrogen peroxide, leading to an intense green fluorescence (Garcia-Ruiz, Colell, Mari, Morales, & Fernandez-Checa, 1997). DCFDA is used both in mitochondrial preparations and live cell imaging.
MitoTracker Red (CM-H2XRos) can accumulate within mitochondria in response to the positive charge acquired by oxidation by ROS and is retained in the organelle by covalently binding to mitochondrial proteins. However, MitoTracker Red CM-H2XROS also accumulates in the organelle in response to mitochondrial membrane potential. If the mitochondrial membrane potential is collapsed during oxidation of the probe, it can diffuse to other cellular compartments, especially the nucleus (Scorrano, Petronilli, Colonna, Di Lisa, & Bernardi, 1999).
Pros and cons
| Pros | Cons |
|---|---|
| Fast and easy | Partial-dependency to mitochondrial membrane potential. MitoSOX can redistribute out of mitochondria in response to stimuli that decrease mitochondrial membrane potential (Polster, Nicholls, Ge, & Roelofs, 2014). |
| Rapidly and selectively targeted to the mitochondria. | High concentrations (5 μM) MitoSOX can affect the mitochondrial electron transport chain, which reduces membrane potential and leads to diffusion of MitoSOX from mitochondria (Roelofs, Ge, Studlack, & Polster, 2015). |
| Specific detection of superoxide radicals but not by other ROS. |
Troubleshooting & Optimization
| Problem | Solution |
|---|---|
| Signal is too low or diffuse. | The concentration of MitoSox used should be optimized for each experimental condition and cell line. In general, concentrations lower than those recommended by the manufacturer (e.g. 0.2–1 μM rather than 5 μM) are usually optimal. |
Safety considerations and standards
AraC may cause an allergic skin reaction and may lead to infertility in humans during development.
II. Visualization of mitochondrial superoxide in yeast
Rationale
Cytosolic dihydroethidium (DHE) exhibits blue fluorescence. Early studies raised the possibility that DHE reacts with superoxides and forms ethidium, which intercalates within DNA and stains the nucleus (Carter, Narayanan, & Robinson, 1994; Rothe & Valet, 1990). However, other studies indicate that the product of DHE oxidation is 2-hydroxyethidium, which is similar to MitoSOX Red mitochondrial superoxide indicator (H. Zhao et al., 2005). Thus, DHE staining has been extensively used to examine superoxide levels in different model organisms. Here, we provide methods to measure 1) superoxide levels in whole cells or mitochondria using DHE staining and 2) colocalization of superoxides and mitochondria.
Materials, equipment and reagents
Strain
EJG168 (MATa his3Δ1 leu2Δ0 met15Δ0 ura3Δ0 CIT1-GFPEnvy-HIS3) for visualization of mitochondria.
Reagents
Synthetic complete glucose-based yeast media (SC): Bacto-yeast nitrogen base (YNB) containing ammonium sulfate and no amino acids (6.7% wt/vol), glucose (20 g/l), adenine hemisulfate (2 mglml), uracil (20 mg/l), arginine (10 mg/l), histidine (10 mg/l), leucine (100 mg/l), lysine (30 mg/l), methionine (20 mg/l), phenylalanine (50 mg/l), tryptophan (20 mg/l) and tyrosine (30 mg/l). YNB was purchased from Becton Dickerson and Co Sparks NV. All other components are from Sigma-Aldrich (St. Louis, MO). Autoclave and store at RT.
Dihydroethidium (Invitrogen, Catalog number: D11347)
Stock solution
10 mM DHE in DMSO
Equipment
Incubators and plastic ware for yeast cell growth in synthetic complete (SC) glucose-based medium. Note: YPD media (rich, glucose-based media containing yeast extract, peptone and dextrose) is autofluorescent and should not be used for imaging.
Microscope slides and cover slips (No. 1.5, 170 μm thick)
Fluorescence microscope equipped with a high numerical aperture (e.g. 1.4 NA) 100x objective lens, a high quantum efficiency and low noise cooled CCD or cMOS detector, a piezo-electric stepper on the objective lens or stage, and an LED illuminator (e.g. pE-400 CoolLED Ltd, Andover, MA) with for excitation/emission filters imaging DHE and GFP (Chroma, Catalog number: 59222).
Protocols
On the morning before the imaging, inoculate cells from a colony in 5 ml of SC in a 50 ml conical centrifuge tube and grow to mid-log phase at 30 °C with shaking at 200 rpm.
On the evening before the experiment, inoculate the mid-log phase culture into 5 mL of fresh SC medium in a 50 ml conical centrifuge tube and grow cells to mid-log phase at 30 °C with shaking (200 rpm) overnight.
Transfer 1 mL of culture to a 1.5-mL microcentrifuge tube and add DHE to a final concentration of 40 μM (4 μl of a 10 mM stock to 1000 μl of cell suspension).
Incubate for 30 min at 30 °C in the dark.
Concentrate cells by centrifugation at 6000 × g for 30 s, remove supernatant, and resuspend the cell pellet with 1 ml SC to wash cells.
Repeat step 5 once.
Concentrate cells by centrifugation at 6000 × g for 30 s, and remove supernatant, leaving a volume of supernatant in the tube approximately twice the volume of the pellet.
Resuspend the pellet in residual medium, transfer 1.7 μl cell suspension to a microscope slide, and cover by a coverslip. This slide can be used to image for about 10 min.
- Acquire an optical z-series of cells using the following settings and excitation/emission filters to image DHE and GFP (Chroma, Catalog number: 59222)
- GFPEnvy: excitation/emission 470/507 nm, 20% power, 200 ms exposure
- DHE: excitation/emission 550/610 nm, 80% power, 300 ms exposure
- 1×1 binning
- 21 z sections with 0.3 μm spacing
- Set software to acquire sequentially at each z-step
Analysis and statistics
Images acquired using a widefield microscope are first deconvolved. The background is then subtracted and the images are thresholded. Superoxide levels are represented as mean DHE intensity in cells or in mitochondria. Colocalization of superoxides with mitochondria can be measured using the Pearson’s correlation coefficient between the fluorescence of DHE and mitochondria-targeted GFPEnvy. We use Volocity software for analysis. Detailed steps are described as follows.
Deconvolution
Set up length/pixel of X, Y, and Z pixels in Edit→ Properties.
Go to Actions→ Create New→ Calculated PSF (PSF stands for Point Spread Function)
Set up PSF by Microscope type, Oil Medium Reflective Index, Numerical Aperture, and wavelength. For example, 507 nm and 610 nm emission for GFPEnvy and DHE, respectively.
Go to Tools→ Interactive Restoration. We use 60 iterations and a 100% confidence criterion for termination in corresponding channels, and start deconvolving.
Superoxide levels in cells or mitochondria
Draw a region of interest (ROI) in an area where there are no cells. Go to Measurement tab, export data including mean intensity to a spreadsheet for analysis as mean background intensity.
Draw an outline of a cell using a freehand ROI tool. Obtain mean intensity in the DHE channel as described above.
Cellular superoxide levels are the mean DHE intensity minus intensity in background.
To obtain mitochondrial DHE intensity, create a protocol in Measurement tab as follows. Find Objects→ Clip Objects to ROIs→ Measure Objects. Identify mitochondria in Find Objects by thresholding mito-GFPEnvy signals. Clip these mitochondrial objects to ROIs which represent outlines of cells and measure mean intensity in the DHE channel.
Mitochondrial superoxide levels are shown as mean DHE intensity in mitochondria subtract intensity in background.
Colocalization of superoxides and mitochondria
Draw a region of interest (ROI) in an area where there are no cells. Go to Colocolization tab, and Set up Thresholds from ROI.
Select Channel X and Channel Y as DEH channel and GFPEnvy channel, respectively.
Draw an outline of a cell using a freehand ROI tool. Pearson’s Correlation and Overlap Coefficient are shown in the Thresholded Statistics panel.
Anticipated Results
Superoxide formation is almost exclusively in mitochondria in yeast cells. Superoxide levels are expected to increase in whole cells or mitochondria in response to treatment with paraquat, which induces superoxide formation (Figure 2).
Figure 2. Measurement of superoxide levels by DHE staining in cells with PQ treatment.

(A) Representative images of DHE staining to detect superoxide in living yeast cells. Mitochondrial superoxides (red) were visualized using DHE in cells incubated +/− paraquat (2.5 mM) for 8 hr. Mitochondria (green) were visualized by tagging a mitochondrial marker protein (CIT1) at its chromosomal locus with GFPEnvy. Scale bar, 2 μm. (B) Quantification of cellular or mitochondrial superoxide levels by measuring mean DHE intensity. Colocalization of DHE-stained superoxides and mitochondria using Pearson’s correlation coefficient. (n>250 cells for each strain, two-tailed t-test,**p<0.01, ****p < 0.0001).
Pros and cons
| Pros | Cons |
|---|---|
| Imaging of mitochondrial redox state in living cells. | DHE staining is not stable and cannot be used for long-term time-lapse imaging. |
| Since DHE and mitochondria-targeted GFP fluorescence are imaged in the same cells, this method allows for measurement of superoxide per mitochondrial volume. | |
| Since this method offers subcellular resolution, it can detect heterogeneity in the superoxide levels in mitochondria within individual cells. |
Troubleshooting & Optimization
| Problem | Solution |
|---|---|
| Low DHE intensity |
|
III. Visualization of mitochondrial NADPH in mammalian cells using iNap sensors
Rationale
A few genetically encoded fluorescent sensors were developed for visualization of intracellular reduced nicotinamide adenine dinucleotides (Bilan et al., 2014; Hung, Albeck, Tantama, & Yellen, 2011; Tao et al., 2017; Y. Zhao et al., 2015; Y. Zhao et al., 2011; Zou et al., 2018), which are ubiquitous electron carriers in all organisms. Most of these sensors are engineered chimera of circularly permuted YFP (cpYFP) and the Rex protein, a bacterial repressor that switches its conformation upon binding with NAD(H). These conformational changes are then transduced to the fused fluorescent protein and alter its fluorescence’s properties. Among these sensors, SoNar is a bright and highly responsive probe for measuring NADH/NAD+ ratios in the cytosol of cells and in vivo (Y. Zhao et al., 2015; Y. Zhao et al., 2016).
iNap sensors were derived from SoNar sensor through rational design of ligand selectively. The mutations introduced to the ligand binding pocket of Rex protein successfully switched the specificity of Rex domain from NADH to NADPH (Tao et al., 2017; Zou et al., 2018). iNap sensors have two excitation peaks at around 420 nm and 500 nm, and one emission peak near 515 nm. Binding of NADPH to iNap sensors results in a 3.5-fold increase in excitation at 420 nm and 2.5-fold decrease in excitation at 500 nm, leading to large ratiometric change in fluorescence. iNap sensors respond very rapidly to alterations in NADPH levels. Therefore, the ratio of iNap fluorescence excited at 420 and 500 nm reports the sensor’s occupancy, which enables real-time spatiotemporal quantification of cytosolic and mitochondrial NADPH pools.
There are four versions of iNap sensors, iNap1 to iNap4, which have apparent dissociation constants (Kd) for NADPH ranging from ~2.0 μM to ~120 μM. Since the levels of free NADPH in mitochondria are significantly elevated compared to that of cytosol, iNap3, which has a lower affinity for NADPH compared to other iNaps and can be targeted to the mitochondrial matrix without affecting mitochondrial function, is well suited for measuring mitochondrial NADPH. Mit-iNap3 is pH sensitive. When pH fluctuations occur, the non-binding control sensor iNapc can be used to correct for pH effects of on iNap fluorescence. Alternatively, iNap3 fused with the red fluorescent protein mCherry (mit-mCherry-iNap3) allows for ratiometric and pH-resistant measurement of mitochondrial NADPH levels.
Materials, equipment and reagents
The materials and equipment needed for mit-iNap3 imaging in mammalian cells are similar to those described above for imaging mitochondrial ROS in C2C12 myotubes. The laser scanning confocal microscope must be equipped with 405 nm and 488 nm laser lines, and ideally with super-sensitive GaAsP or HyD hybrid detectors. The wide-field automatic fluorescent microscope that we use is equipped with a Xenon light source (Lambda XL from Sutter Instrument) and a fast switching filter wheel (Lambda 10-3, Shutter Instruments). For dual-excitation ratio imaging, we use 407 BP 17 nm or 482 BP 35-nm bandpass excitation filters (Semrock) and a 535 BP 40-nm emission filter (Omega). Alternatively, 420 nm and 490 nm excitation light generated by a multi-spectra LED light source (e.g. pE-4000, CoolLED) can be used for dual excitation imaging. For Nikon microscopes, the Perfect Focus System is critical to correct for focus drift in long-term imaging studies.
Reagents
Cell culture reagents needed for mit-iNap3 imaging are similar to those described above for imaging mitochondrial ROS. Modifications may be made according to cell type.
35 mm glass-bottom dish (In Vitro Scientific, Ref. D35C4-20-1-N)
96-well glass-bottom plate (In Vitro Scientific, Ref. P96-0-N)
Hieff Trans Liposomal Transfection Reagent (Yeasen, Ref. 40802ES03)
FuGENE HD Transfection Reagent (Promega, Ref. E2311)
Opti-MEM I reduced-serum medium (Invitrogen, Ref. 31985-070)
Dulbecco’s phosphate-buffered saline with calcium and magnesium (Invitrogen, Ref. 14040117)
NADPH (Roche, Ref. 60302ES01)
D-glucose (Sigma, Ref. G7021)
Poly-D-lysine (Yeasen, Ref. 40119ES10)
Isopropyl-β-D-thiogalactoside (Yeasen, Ref. 10902ES08)
Ampicillin (Yeasen, Ref. 60203ES10)
Poly-D-lysine (Yeasen, Ref. 40119ES10)
LB Broth, Powder (Invitrogen, Ref. 12795027)
NaCl (Sigma, Ref. 746398)
Imidazole (Sigma, Ref. 576166)
KH2PO4 (Vetec, Ref. V900041)
Na2HPO4 · 12 H2O (Shanghai Titan, Ref. G10267A)
Buffer A: 30 mM sodium phosphate, 500 mM sodium chloride, and 10 mM imidazole, pH 7.4. Filter the solution with a 0.22 μm filter unit and store at room temperature (RT; 20–25 °C).
Buffer B: 30 mM sodium phosphate, 500 mM sodium chloride, and 300 mM imidazole, pH
NADPH: NADPH stock solution (200 mM) made by dissolving the NADPH powder into H2O. Prepare fresh and protect from light.
Plasmids: pRSETb-iNap3, pRSETb-iNapc, pcDNA3.1/Hygro(+)-mit-iNap3, pcDNA3.1/Hygro(+)-mit-iNapc, pcDNA3.1/Hygro(+)-mit-rxRFP1.1,
Cells: Control Hela cells, NADK over-expressing Hela stable cell line, NADK knockdown Hela stable cell line 1, NADK knockdown Hela stable cell line 2.
Protocols
Mammalian cell culture and transfection
-
Coat the 35-mm imaging dishes or 96-well glass bottom plates with 0.1 mg/ml poly-D-lysine and incubate at 37°C for 3 hr. Wash twice with PBS to remove coating reagents after the incubation.
TIP: Coat with fibronectin, collagen, laminin or fibrinogen, as needed for cells of interest, to avoid cell detachment during long-term imaging.
Plate cells on imaging dishes or plates at a density of 20% confluency.
Incubate the cells at 37 °C in a CO2 incubator for 24 hr.
-
Transfect cells with mit-iNap3 or the control mit-iNapc expressing plasmid using Hieff Trans liposomal transfection reagent. Keep the ratio of the total amount of plasmids and the volume of Hieff reagent (1 μg plasmid/3 μl Hieff reagent) fixed. Follow the manufacturer’s protocol for transfection procedures.
CRITICAL STEP: Cell confluency during transfection and the quantity of reagent used should be optimized to enhance sensor’s expression and maintain cell viability. Low toxicity transfection reagents such as Fugene HD or Lipofectamine 3000 may be used to reduce cell death.
-
4–6 hrs after transfection, replace medium with fresh Phenol red-free medium. Incubate the cells at 37 °C using a CO2 incubator for 24 hr.
CRITICAL STEP: Culturing cells in Phenol red-free medium can significantly reduce the background fluorescence during imaging.
Note: mit-iNap3 and mit-iNapc are expressed well when transiently transfected into a wide range of cell lines. Recombinant lentivirus or AAV virus may be used for deliver iNap genes into difficult-to-transfect cells, such as cells in primary cultures. Alternatively, stable cell lines expressing the mit-iNap sensor or mit--iNapc control may be engineered for long-term imaging of mitochondrial NADPH levels.
Imaging of mitochondrial NADPH with mit-iNap3 sensor
-
Remove the medium and add pre-warmed DPBS buffer supplemented with 5 mM glucose to cell (0.5 ml for 35-mm imaging dishes or 0.1 ml for each well of 96-well glass bottom plates).
CRITICAL STEP: Handle carefully to avoid dislodging the cells from culture surface.
TIP: Phenol red-free medium can be used instead of the glucose-supplemented DPBS buffer to maintain the cells under physiological condition if the sensor is expressed at high levels and the background fluorescence is not a concern.
-
Maintain cells at 37°C in a humidified atmosphere in a CO2 incubator for 10–20 min.
CRITICAL STEP: It is necessary to adapt the cells to the culture environment to avoid artificial pH fluctuations.
Visualize the cells using wide-field with a 40× objective and 482 nm excitation. Choose 3–4 moderately fluorescent cells.
-
Acquire images when the fluorescence intensities of mit-iNap3 or mit--iNapc are stable. We typically obtain images at 10–30 s intervals for a total imaging time of 60 min using a focus stabilization system (e.g. Perfect Focus). For confocal imaging, use excitation/emission 405/516 for channel A and 488/516 for channel B. For wide-field imaging, use excitation/emission 407/532 for channel A, and 482/535 for channel B.
CRITICAL STEP: Adjust the laser intensity and gain (for confocal imaging) or exposure time and gain (for wide field imaging) so that the fluorescence intensity of both channels are similar and not saturated, and phototoxcity is minimal.
Export raw data to ImageJ software as 12-bit TIF for analysis.
Note: Multiplex imaging of mitochondrial NADPH levels and thiol redox state is possible when cells are transfected with pcDNA3.1/Hygro(+)-mit-iNap3 together with pcDNA3.1/Hygro(+)-mit-rxRFP1.1. Acquire the rxRFP signal using a 561 nm excitation laser and 570–630 nm emission range.
Preparation and use of iNap protein for in vitro analysis
Inoculate E. coli JM109 cells carrying pRSETb-iNap3 or pRSETb-iNapc into 100 ml of LB medium containing 0.1 mg/ml ampicillin. Culture at 37°C until the OD600 of the culture reaches 0.5.
Add IPTG to a final concentration of 1 mM to induce the iNap gene expression, and culture cells at 18 °C for 30 hr.
Centrifuge the bacteria culture at 4,000 rpm at 4°C for 20 min, suspend the cell pellets in Buffer A, and lyse the cells by sonication.
Use a 1 ml NTA column (GE Healthcare) to purify iNap protein. Wash the column with 10 ml Buffer A, and then elute the proteins with Buffer B. Desalt and exchange the protein preparations into 100 mM HEPES buffer containing 100 mM NaCl (pH 7.3) for in vitro characterization.
Desalt the protein preparations, and exchange them into 100 mM potassium phosphate buffer (pH 8.0) before assay.
Calibrate the microscope system using iNap3 and iNapc solution. Measure the fluorescence signal of recombinant 1 μM iNap3 and iNapc protein at 0 μM NADPH or at saturating 400 μM NADPH, using the same microscope setting for imaging of iNap3 expressing cells.
Analysis and statistics
Mitochondrial NADPH levels are measured using ImageJ software. To do so, use mit-iNap3 fluorescence to identify regions within cells that contain mitochondria. Mitochondrial NADPH level is measured by RiNap3, the ratio of iNap3 fluorescence when excited at 420 nm and 485 nm, in individual cells or individual mitochondria. For qualitative analysis of the time course of NADPH fluctuation, measure RiNap3 of at least 50 cells for each experimental condition. Measure RiNapc of another 50 cells in an independent experiment to exclude any pH alteration in mitochondria. For quantifying mitochondrial NADPH level, measure mit-iNap3 and mit-iNapc fluorescence in parallel. Data can be expressed as mean ± SD. Statistical significance is determined by unpaired two-tailed Student’s test. P-values of < 0.05 are considered statistically significant.
NADPH level in mitochondria
Load the images onto ImageJ.
Draw a region of interest (ROI) in an area where there are no cells. Go to Measurement tab, export data including mean intensity to a spreadsheet for analysis as mean background intensity.
Draw a region of interest (ROI) in an area that contains mitochondria in the cells.
To threshold the image go to Image tab → Adjust → Threshold.
To create a mask from the threshold image go to Edit tab → Selection → Create Mask.
To select the objects within the mask go to Edit tab → Selection → Create Selection.
Open the ROI Manager (Analyze → Tools → ROI Manager) and load each selection into the ROI Manager by selecting Add in the ROI Manager.
Select each ROI in the ROI manager and select Measure. A new window will appear showing the Area, mean, min and max intensity of different channel.
Subtract the background intensity obtained in step 2 from the value measured in step 8.
Calculate RiNap3 for each cells expressing mit-iNap3 using the mean fluorescence intensity of channel A and channel B. RiNap3 represent the excitation ratio 420/485 nm of mit-iNap3.
Calculate RiNapc for each cells expressing mit-iNapc using the mean fluorescence intensity of channel A and channel B. RiNapc represent the excitation ratio 420/485 nm of mit-iNapc.
Calculate the pH-corrected ratio of cells as follows: R=RiNap3/ RiNapc.
Calculate the minimum ratio (Rmin) of apo iNap3 and the maximum ratio (Rmax) NADPH bound iNap3 protein corrected by iNapc protein according to calibration data of the microscope system using iNap3 and iNapc solution.
-
Convert the pH-corrected fluorescence ratio of cells to the NAD+/NADH ratio as follows:
Kd is the apparent dissociation constant of iNap3 to NADPH. iNap3 has an apparent Kd of 25 μM.
Anticipated Results
NAD+ kinase (NADK) catalyse NADP+ synthesis at the expense of NAD+ and ATP. Mitochondrial NADPH levels are expected to increase in NADK overexpressing cells, or to decrease in NADK knock down cells (Fig 3).
Figure 3. Effects of NADK expression on mitochondrial free NADPH level in HeLa cells.

(A) Representative images mit-iNap3 in wild-type, NADK-overexpressing, and NADK-deficient HeLa cells. Images were pseudocolored with the ratio of fluorescence excited at 407 nm and 482 nm. Scale bar, 10 μm. (B) Quantification of mit-iNap3 (d) fluorescence in NADK overexpressing or knockdown cells. Unpaired t-test. *p < 0.05, **p < 0.01, and ***p < 0.001.
Related techniques
The endogenous fluorescence of mitochondrial NAD(P)H fluorescence has been used to measure cellular redox states. However, it is difficult to distinguish the fluorescence of NADH and NADPH, which have similar spectra but distinct functions. Recently, fluorescence lifetime imaging (FLIM) was shown to be able to distinguish NADPH and NADH fluorescence in live cells (Blacker et al., 2014). However, FLIM requires sophisticated instruments and complicated analysis that may not be available for majority labs.
Pros and cons
| Pros | Cons |
|---|---|
| Imaging of mitochondrial redox state in living cells. | It takes some time to transfect the gene encoding the sensor, and to express the sensor. These concerns can be alleviated by establish stable cell lines expressing the sensor. |
| Cells express the genetically encoded sensor, which enables long-term real-time imaging. | |
| Since this method offers subcellular resolution, it can detect heterogeneity in the NADPH levels in mitochondria within individual cells. | |
| iNap3 sensor allows ratiometric imaging and quantitative measurement of NADPH levels, which is not affected by changes in the sensor’s concentration or variability in sample thickness or illumination. |
Troubleshooting & Optimization
| Problem | Solution |
|---|---|
| Low fluorescence signal of iNap3 sensor | Improve the fluorescence intensity by optimizing the transfection conditions or establishing stable cell lines highly expressing mit-iNap3 |
| Large fluctuation of baseline fluorescence intensity in resting cells. | These may be produced by an unstable light source or sample temperature variation. Turn on the light source and wait 30 min before data acquisition. Incubate sample 10–20 min in CO2 incubator and/or increase pH buffering capacity of the medium. |
IV. Use of genetically encoded biosensors to detect mitochondrial redox state in yeast
Rationale
Redox-sensitive GFP (roGFP) (Dooley et al., 2004; Hanson et al., 2004) is a GFP variant in which surface-exposed cysteines are added to the molecule. roGFP, like wild-type GFP, has two widely spaced excitation peaks (at ~400 nm and ~480 nm) and one emission at ~510 nm. Oxidation of the cysteines in roGFP results an increase in excitation at ~400 nm; while reduction of those cysteines favors excitation of roGFP at ~480 nm. Thus, the ratio of 510 nm emission upon excitation of roGFP at 480 and 400 nm reveals the relative amount of reduced and oxidized roGFP, which reflects the redox state of the environment.
Two versions of roGFP are widely used: roGFP1 (which is based on wild-type GFP) and roGFP2 (which is based on S65T GFP). roGFP1 is less pH sensitive than roGFP2 and its dynamic range extends further into the reduced range. Thus, it may be more useful for monitoring more reducing compartments such as mitochondria or the cytosol, and compartments with variable pH, such as endosomes. roGFP2 offers brighter signal, and in some studies, a greater dynamic range compared to roGFP1 (Hanson et al., 2004; Schwarzlander et al., 2008). Studies in Arabidopsis thaliana indicate that the time required for response to changes in redox state is similar for both sensors (t1/2 for oxidation, 65 and 95 sec and t1/2 for reduction, 272 and 206 sec, for roGFP1 and roGFP2, respectively) (Schwarzlander et al., 2008).
To detect mitochondrial redox state in living yeast cells, we inserted a gene encoding the mitochondrial targeting sequence of ATP9 fused roGFP1 into the yeast genome at the HO locus. The resulting mito-roGFP is targeted exclusively to mitochondria and has no effect on cell growth rates or on mitochondrial morphology or distribution.
Materials, equipment and reagents
The materials and equipment needed for mito-roGFP imaging are similar to those described above for imaging mitochondrial superoxides in yeast. Here, the LED light source on the fluorescent microscope must be equipped with filters excitation/emission filters for oxidized roGFP (365/500–550 nm) and reduced roGFP (470/500–550 nm) (Chroma, Catalog number: 49002).
Strain
JYY134 (MATa his3Δ1 leu2Δ0 met15Δ0 ura3Δ0 ho:: GPDp-mito-roGFP::KanMX4)
Plasmid
EP41: HO-GPDpro-mito-roGFP::KanMX4-HO
Protocol
The morning before imaging, inoculate a single colony of cells that express mito-roGFP into SC media (5 ml in a 50 ml conical-bottom tube) and grow at 30°C with shaking at 200 rpm until OD600 has reached a mid-log phase (OD600 of 0.1–0.3).
The evening before imaging, use the appropriate volume of pre-culture to inoculate 5 ml of SC media in a 50 ml conical-bottom tube and grow cells as described above for overnight until they reach mid-log phase (~0.5 – 1 × 10⁷ cells/ml; OD600 of 0.1–0.3)
Concentrate 1 ml of culture in a microcentrifuge tube by centrifugation at 6,000 × g for 15 sec and resuspend the cell pellet in 20 μl of SC media.
Apply 2 μl of the resuspended cells to a slide and cover with a coverslip. This slide can be used to image mitochondria for 10 min.
- Obtain optical z-series of cells using the following conditions:
- Oxidized mito-roGFP: excitation/emission 365/500–550 nm, 50% power, 300 ms exposure
- Reduced mito-roGFP: excitation/emission 470/500–550 nm, 20% power, 200 ms exposure
- 1×1 binning
- 21 z sections with 0.3 μm spacing
- Set software to acquire 365 and 470 nm emissions sequentially at each z-step
Analysis and statistics
The redox state of the organelle is measured as the reduced to oxidized (R/O) ratio of mito-roGFP; i.e. emission at 510 nm upon excitation at 470 nm divided by emission at 510 nm upon excitation at 365 nm. Before calculating the ratio, we subtract background and determine a threshold value for pixels belonging to the fluorescent mitochondria. Public domain (e.g. ImageJ) or commercially available (e.g. Volocity, Quorum Technologies, Puslinch, Ontario, Canada) software can be used for analysis of mito-roGFP1. Depending on the software used for image acquisition and for analysis, the images may first need to be converted to another format, such as TIFF, before opening them in the analysis software. If images are converted, it is essential to verify that pixel values are not changed during the conversion. Analysis of mito-roGFP1 data, using both programs is described below. Program menus and options to select within each menu are highlighted in bold italics.
ImageJ analysis
Open images and change type to 32 bit: Image→ Type → 32 bit.
Draw a region of interest (ROI) in an area where there are no cells. Calculate the mean intensity in this ROI: Analyze → Measure.
Subtract the calculated mean background from the stack: Process → Math → Subtract.
Using the subtracted z-stack, find the middle slice and threshold on mitochondria: Image → Adjust → Threshold and click Apply on the Threshold window. Apply to all slices in the stack. Check Set background pixels to NaN.
Create the ratio z stack: Process → Image Calculator Divide the reduced stack by the oxidized z stack for mito-roGFP1 analysis.
Draw an ROI around the area of interest. Choose Analyze → Tools → ROI Manager, and click Add to record the ROI. Multiple regions may be stored in the manager. In ROI Manager, select all ROIs, then choose More → Multi-Measure to measure all stack slices. Export data to a spreadsheet for analysis.
Volocity analysis
Import images into a Volocity library and create an image sequence with 2 channels.
Draw a region of interest (ROI) in an area where there are no cells. Choose: Tools → Ratio.
Use Volocity to calculate the background: Get From ROI.
Adjust the threshold to include mitochondrial structures.
Check the option to apply a rainbow LUT to the ratio channel. The intensity-modulated channel may produce a less noisy image for presentation, but it should not be used for quantitation of average ratio.
Select the Measurement tab, select the ratio channel and draw an ROI around the area of interest. Measure the ratio channel, excluding zero values. Multiple regions may be selected and measured at the same time. Export data to a spreadsheet for analysis.
Anticipated Results
Mito-roGFP1 also offers subcellular resolution of mitochondrial redox state. This subcellular resolution reveals that mitochondria within individual yeast cells differ in relative redox state. Typically, mitochondria in bud cells are more reduced compared to mother cells (Fig. 4A). The dynamic range of the oxidized and reduced states of mito-roGFP1 in cells is demonstrated by 30 min-treatment with 5 mM hydrogen peroxide (H2O2) and DTT, respectively (Fig. 4B).
Figure 4. Mitochondrial quality measurement by mito-roGFP.
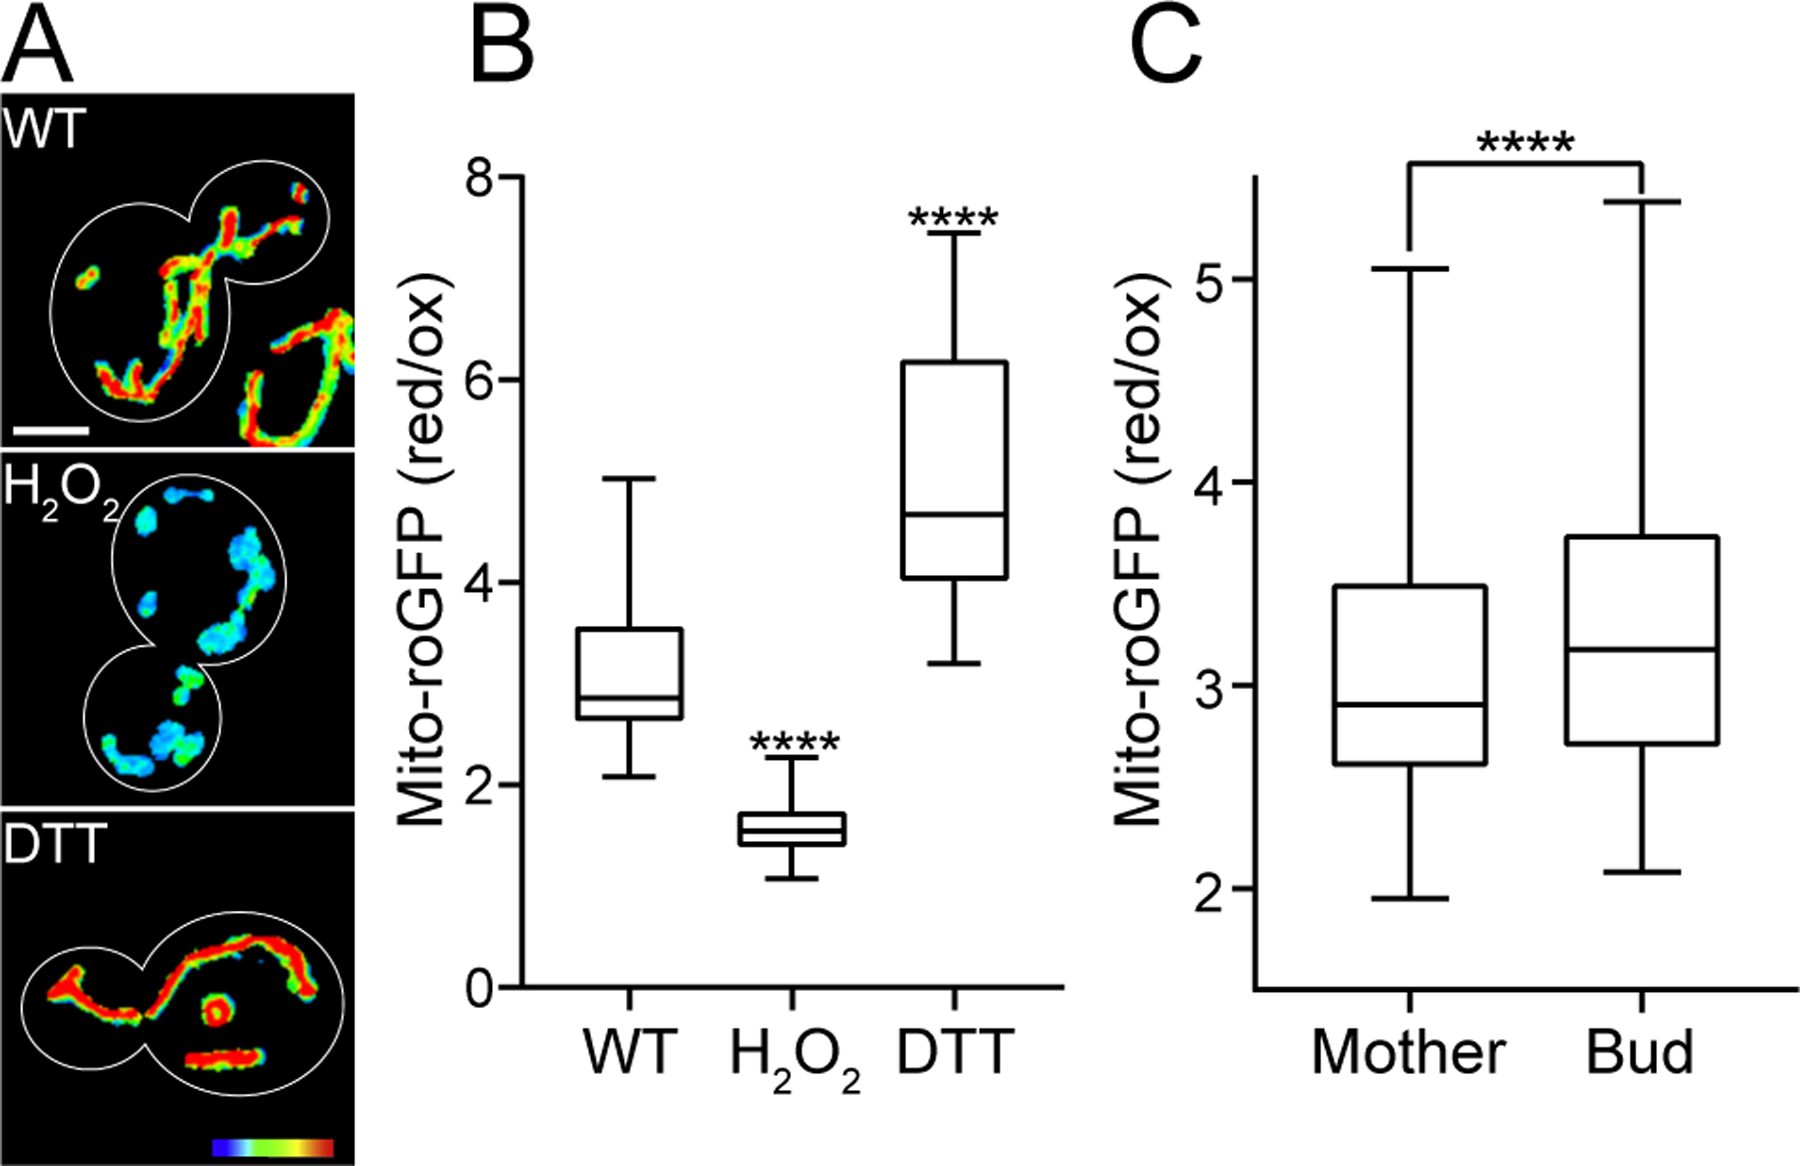
(A) Representative images of mito-roGFP1 in wild-type (WT), and cells treated with 5 mM H2O2 or DTT. The ratio of the reduced to oxidized roGFP signals is shown in heat maps. Warmer colors represent more reducing enviroments and cooler colors represent more oxidizing environments. Scale bar, 2 μm. (B) Quantification of mitochondrial redox state shown in (A). H2O2 and DTT treatment represents the dynamic range of the oxidized and reduced state of mito-roGFP1 in cells, respectively (n>54 for each strain, Kruskal-Wallis test with Dunn’s multiple comparisons test, ****p<0.0001). (C) Quantification of mitochondrial redox state in wild-type mother and bud cells (n=154, Wilcoxon matched-pairs signed rank test, ****p<0.0001).
Related techniques
We find that integration of mito-roGFP into the yeast genome results in less cell-to-cell variability in roGFP fluorescence intensity and more consistent measurements. However, for some studies, plasmid borne mito-roGFP may be useful. We constructed a fusion protein (mito-roGFP1) consisting of roGFP1 fused to the ATP9 leader sequence and expressed under control of the GPD promoter from a centromere-based (low copy number) plasmid that contains an auxotrophic marker for uracil (Vevea, Alessi Wolken, Swayne, White, & Pon, 2013).
Pros and cons
| Pros | Cons |
|---|---|
| Imaging of mitochondrial redox state in living cells. | Oxidized mito-roGFP photobleaches quickly. Therefore, this reagent cannot be used for time lapse imaging. |
| As a genetically encoded sensor, roGFP can be introduced and maintained in cells without permeabilization. | Mito-roGFP does not offer the temporal resolution to detect bursts of ROS associated with ROS signalling. |
| mito-roGFP1 offers subcellular resolution and can detect heterogeneity in the redox state of mitochondria within individual cells. | |
| mito-roGFP1 is a ratiometric biosensor, and is not affected by changes in concentration or variability in sample thickness or illumination. |
Alternative methods/procedures
Troubleshooting & Optimization
| Problem | Solution |
|---|---|
| Differences in mitochondrial redox potential not just upon carbon source-induced differences in cell metabolism, but also upon propagation of yeast in different batches of the same medium. | The same carbon source and media batch must be used for all biological replicates of a given experiment. |
| Exciting at 400 nm optimally excites the oxidized species of roGFP. However, it also excites reduced roGFP to a lesser extent compared to excitation at 365 nm, which leads to reduced sensitivity in measuring mitochondrial redox state. Exposure of mito-roGFP1 to high-intensity illumination at 400 nm also leads to photoconversion of the protein. | Use 365 nm for excitation of oxidized mito-roGFP. |
Acknowledgements
This work was supported by grants from the National Institutes of Health (NIH) (GM45735, GM122589 and AG051047) to LP, and NSFC (grant nos. 91857202, 21937004, 31225008 and 31470833), the Shanghai Science and Technology Commission (grant nos. 18JC1411900 and 16430723100) to YY.
References
- Beer SM, Taylor ER, Brown SE, Dahm CC, Costa NJ, Runswick MJ, & Murphy MP (2004). Glutaredoxin 2 catalyzes the reversible oxidation and glutathionylation of mitochondrial membrane thiol proteins: implications for mitochondrial redox regulation and antioxidant DEFENSE. J Biol Chem, 279(46), 47939–47951. doi: 10.1074/jbc.M408011200 [DOI] [PubMed] [Google Scholar]
- Bilan DS, Matlashov ME, Gorokhovatsky AY, Schultz C, Enikolopov G, & Belousov VV (2014). Genetically encoded fluorescent indicator for imaging NAD(+)/NADH ratio changes in different cellular compartments. Biochim Biophys Acta, 1840(3), 951–957. doi: 10.1016/j.bbagen.2013.11.018 [DOI] [PMC free article] [PubMed] [Google Scholar]
- Blacker TS, Mann ZF, Gale JE, Ziegler M, Bain AJ, Szabadkai G, & Duchen MR (2014). Separating NADH and NADPH fluorescence in live cells and tissues using FLIM. Nat Commun, 5, 3936. doi: 10.1038/ncomms4936 [DOI] [PMC free article] [PubMed] [Google Scholar]
- Cadenas E, & Davies KJ (2000). Mitochondrial free radical generation, oxidative stress, and aging. Free Radic Biol Med, 29(3–4), 222–230. doi: 10.1016/s0891-5849(00)00317-8 [DOI] [PubMed] [Google Scholar]
- Carter WO, Narayanan PK, & Robinson JP (1994). Intracellular hydrogen peroxide and superoxide anion detection in endothelial cells. J Leukoc Biol, 55(2), 253–258. doi: 10.1002/jlb.55.2.253 [DOI] [PubMed] [Google Scholar]
- Degli Esposti M (2002). Measuring mitochondrial reactive oxygen species. Methods, 26(4), 335–340. doi: 10.1016/S1046-2023(02)00039-7 [DOI] [PubMed] [Google Scholar]
- Dooley CT, Dore TM, Hanson GT, Jackson WC, Remington SJ, & Tsien RY (2004). Imaging dynamic redox changes in mammalian cells with green fluorescent protein indicators. J Biol Chem, 279(21), 22284–22293. doi: 10.1074/jbc.M312847200 [DOI] [PubMed] [Google Scholar]
- Garcia-Ruiz C, Colell A, Mari M, Morales A, & Fernandez-Checa JC (1997). Direct effect of ceramide on the mitochondrial electron transport chain leads to generation of reactive oxygen species. Role of mitochondrial glutathione. J Biol Chem, 272(17), 11369–11377. doi: 10.1074/jbc.272.17.11369 [DOI] [PubMed] [Google Scholar]
- Gardner PR, & Fridovich I (1993). Effect of glutathione on aconitase in Escherichia coli. Arch Biochem Biophys, 301(1), 98–102. doi: 10.1006/abbi.1993.1120 [DOI] [PubMed] [Google Scholar]
- Gardner PR, Raineri I, Epstein LB, & White CW (1995). Superoxide radical and iron modulate aconitase activity in mammalian cells. J Biol Chem, 270(22), 13399–13405. doi: 10.1074/jbc.270.22.13399 [DOI] [PubMed] [Google Scholar]
- Hanson GT, Aggeler R, Oglesbee D, Cannon M, Capaldi RA, Tsien RY, & Remington SJ (2004). Investigating mitochondrial redox potential with redox-sensitive green fluorescent protein indicators. J Biol Chem, 279(13), 13044–13053. doi: 10.1074/jbc.M312846200 [DOI] [PubMed] [Google Scholar]
- Hung YP, Albeck JG, Tantama M, & Yellen G (2011). Imaging cytosolic NADH-NAD(+) redox state with a genetically encoded fluorescent biosensor. Cell Metab, 14(4), 545–554. doi: 10.1016/j.cmet.2011.08.012 [DOI] [PMC free article] [PubMed] [Google Scholar]
- Kalyanaraman B (2011). Oxidative chemistry of fluorescent dyes: implications in the detection of reactive oxygen and nitrogen species. Biochem Soc Trans, 39(5), 1221–1225. doi: 10.1042/BST0391221 [DOI] [PubMed] [Google Scholar]
- Kauffman ME, Kauffman MK, Traore K, Zhu H, Trush MA, Jia Z, & Li YR (2016). MitoSOX-Based Flow Cytometry for Detecting Mitochondrial ROS. React Oxyg Species (Apex), 2(5), 361–370. doi: 10.20455/ros.2016.865 [DOI] [PMC free article] [PubMed] [Google Scholar]
- Lin MT, & Beal MF (2006). Mitochondrial dysfunction and oxidative stress in neurodegenerative diseases. Nature, 443(7113), 787–795. doi: 10.1038/nature05292 [DOI] [PubMed] [Google Scholar]
- Mammucari C, & Rizzuto R (2010). Signaling pathways in mitochondrial dysfunction and aging. Mech Ageing Dev, 131(7–8), 536–543. doi: 10.1016/j.mad.2010.07.003 [DOI] [PMC free article] [PubMed] [Google Scholar]
- Nulton-Persson AC, & Szweda LI (2001). Modulation of mitochondrial function by hydrogen peroxide. J Biol Chem, 276(26), 23357–23361. doi: 10.1074/jbc.M100320200 [DOI] [PubMed] [Google Scholar]
- Polster BM, Nicholls DG, Ge SX, & Roelofs BA (2014). Use of potentiometric fluorophores in the measurement of mitochondrial reactive oxygen species. Methods Enzymol, 547, 225–250. doi: 10.1016/B978-0-12-801415-8.00013-8 [DOI] [PMC free article] [PubMed] [Google Scholar]
- Robinson KM, Janes MS, & Beckman JS (2008). The selective detection of mitochondrial superoxide by live cell imaging. Nat Protoc, 3(6), 941–947. doi: 10.1038/nprot.2008.56 [DOI] [PubMed] [Google Scholar]
- Roelofs BA, Ge SX, Studlack PE, & Polster BM (2015). Low micromolar concentrations of the superoxide probe MitoSOX uncouple neural mitochondria and inhibit complex IV. Free Radic Biol Med, 86, 250–258. doi: 10.1016/j.freeradbiomed.2015.05.032 [DOI] [PMC free article] [PubMed] [Google Scholar]
- Rothe G, & Valet G (1990). Flow cytometric analysis of respiratory burst activity in phagocytes with hydroethidine and 2’,7’-dichlorofluorescin. J Leukoc Biol, 47(5), 440–448. [PubMed] [Google Scholar]
- Schafer FQ, & Buettner GR (2001). Redox environment of the cell as viewed through the redox state of the glutathione disulfide/glutathione couple. Free Radic Biol Med, 30(11), 1191–1212. doi: 10.1016/s0891-5849(01)00480-4 [DOI] [PubMed] [Google Scholar]
- Schon EA, & Przedborski S (2011). Mitochondria: the next (neurode)generation. Neuron, 70(6), 1033–1053. doi: 10.1016/j.neuron.2011.06.003 [DOI] [PMC free article] [PubMed] [Google Scholar]
- Schwarzlander M, Fricker MD, Muller C, Marty L, Brach T, Novak J, … Meyer AJ (2008). Confocal imaging of glutathione redox potential in living plant cells. J Microsc, 231(2), 299–316. doi: 10.1111/j.1365-2818.2008.02030.x [DOI] [PubMed] [Google Scholar]
- Scorrano L, Petronilli V, Colonna R, Di Lisa F, & Bernardi P (1999). Chloromethyltetramethylrosamine (Mitotracker Orange) induces the mitochondrial permeability transition and inhibits respiratory complex I. Implications for the mechanism of cytochrome c release. J Biol Chem, 274(35), 24657–24663. doi: 10.1074/jbc.274.35.24657 [DOI] [PubMed] [Google Scholar]
- Tao R, Zhao Y, Chu H, Wang A, Zhu J, Chen X, … Yang Y (2017). Genetically encoded fluorescent sensors reveal dynamic regulation of NADPH metabolism. Nat Methods, 14(7), 720–728. doi: 10.1038/nmeth.4306 [DOI] [PMC free article] [PubMed] [Google Scholar]
- Taylor ER, Hurrell F, Shannon RJ, Lin TK, Hirst J, & Murphy MP (2003). Reversible glutathionylation of complex I increases mitochondrial superoxide formation. J Biol Chem, 278(22), 19603–19610. doi: 10.1074/jbc.M209359200 [DOI] [PubMed] [Google Scholar]
- Tretter L, & Adam-Vizi V (2000). Inhibition of Krebs cycle enzymes by hydrogen peroxide: A key role of [alpha]-ketoglutarate dehydrogenase in limiting NADH production under oxidative stress. J Neurosci, 20(24), 8972–8979. [DOI] [PMC free article] [PubMed] [Google Scholar]
- Vevea JD, Alessi Wolken DM, Swayne TC, White AB, & Pon LA (2013). Ratiometric biosensors that measure mitochondrial redox state and ATP in living yeast cells. J Vis Exp(77), 50633. doi: 10.3791/50633 [DOI] [PMC free article] [PubMed] [Google Scholar]
- Zhao H, Joseph J, Fales HM, Sokoloski EA, Levine RL, Vasquez-Vivar J, & Kalyanaraman B (2005). Detection and characterization of the product of hydroethidine and intracellular superoxide by HPLC and limitations of fluorescence. Proc Natl Acad Sci U S A, 102(16), 5727–5732. doi: 10.1073/pnas.0501719102 [DOI] [PMC free article] [PubMed] [Google Scholar]
- Zhao Y, Hu Q, Cheng F, Su N, Wang A, Zou Y, … Yang Y (2015). SoNar, a Highly Responsive NAD+/NADH Sensor, Allows High-Throughput Metabolic Screening of Anti-tumor Agents. Cell Metab, 21(5), 777–789. doi: 10.1016/j.cmet.2015.04.009 [DOI] [PMC free article] [PubMed] [Google Scholar]
- Zhao Y, Jin J, Hu Q, Zhou HM, Yi J, Yu Z, … Loscalzo J (2011). Genetically encoded fluorescent sensors for intracellular NADH detection. Cell Metab, 14(4), 555–566. doi: 10.1016/j.cmet.2011.09.004 [DOI] [PMC free article] [PubMed] [Google Scholar]
- Zhao Y, Wang A, Zou Y, Su N, Loscalzo J, & Yang Y (2016). In vivo monitoring of cellular energy metabolism using SoNar, a highly responsive sensor for NAD(+)/NADH redox state. Nat Protoc, 11(8), 1345–1359. doi: 10.1038/nprot.2016.074 [DOI] [PubMed] [Google Scholar]
- Zou Y, Wang A, Shi M, Chen X, Liu R, Li T, … Zhao Y (2018). Analysis of redox landscapes and dynamics in living cells and in vivo using genetically encoded fluorescent sensors. Nat Protoc, 13(10), 2362–2386. doi: 10.1038/s41596-018-0042-5 [DOI] [PMC free article] [PubMed] [Google Scholar]