Abstract
In this paper, we propose a pathological image compression framework to address the needs of Big Data image analysis in digital pathology. Big Data image analytics require analysis of large databases of high-resolution images using distributed storage and computing resources along with transmission of large amounts of data between the storage and computing nodes that can create a major processing bottleneck. The proposed image compression framework is based on the JPEG2000 Interactive Protocol and aims to minimize the amount of data transfer between the storage and computing nodes as well as to considerably reduce the computational demands of the decompression engine. The proposed framework was integrated into hotspot detection from images of breast biopsies, yielding considerable reduction of data and computing requirements.
Keywords: Compression, pathology images, JPIP, Ki-67, hotspot detection, Alpha shapes
I. INTRODUCTION
Modern imaging techniques generate very large images and the wide-spread utilization of image data in many areas has created significant challenges associated with processing, analysis, and management of these large datasets. The need to handle large volumes of image data is pervasive today in nearly every industry, government, and institutional sector. For example, in digital pathology, a single digital whole slide image produces a file ranging in size from 2 to 60 gigabytes (GBs). When an entire case is considered (typically between 4 to 30 different slides), the raw data size can exceed 100 GB. Considering the daily slide volumes of a typical academic pathology department, the volume of data generated by a fully digital pathology practice can be enormous.
It is important to point out that the information present in medical images has immediate as well as long-term relevance: The pathology images associated with a case have immediate diagnostic relevance for that case. However, some information in these images becomes relevant only when it is considered as part of a large cohort. Subtle characteristics of disease can only be identified when a large set of images are analyzed collectively. Therefore, there has been growing interest in Big Data analytics in information sciences over the last few years [1]. While extraction and quantification of relevant [2] and task-specific information [3] from images has long been an active area of research within the image processing community, the emergence of Big Data poses additional challenges particularly in processing resources/speed and scalability.
One of the most prominent Big Data challenges in histopathological image processing is how to transmit, store, and, most importantly, manage this large amount of data efficiently. Conventional image compression methods were designed to act as an input-output filter used for compression enabling access to the image at a single image quality, size, resolution, and spatial extent that was envisioned at the time of compression [4]. However, these conventional methods are impractical for Big Data image analytics. Many Big Data image analytics applications employ distributed storage and computing, and transmission of large amounts of data between the storage and computing nodes creates a major processing bottleneck. Furthermore, Big Data databases are often mined for different tasks and the image quality, resolution, and spatial extent relevant for different tasks can be vastly different [5]. In this work, we propose a pathological image compression framework that acts as part of a Big Data histopathological image processing system providing efficient and scalable interaction with histopathology images. The proposed framework is based on the JPEG2000 image compression standard [6] and the JPEG2000 Interactive Protocol (JPIP) [7]. Through the use of an example application, we illustrate that when image compression is tightly integrated with the image processing methods, both compression and computational efficiency can be significantly improved. So, the aim of this study is to develop and validate an image compression paradigm where information most relevant to the task at hand is stored and transmitted preferentially.
II. SUBJECTS AND METHODS
II.I. JPIP server and client Architecture
The JPEG2000 image compression standard was designed with the central theme of scalability. In addition to resolution and quality scalability, JPEG2000 provides spatial and image component accessibility. This rich family of scalability features enables JPEG2000 code-streams to be easily parsed to extract subsets of compressed data that represent a desired region of interest with a desired set of color components, at a desired resolution and with a selected level of quality. The JPIP protocol [7] builds on this strong foundation to allow interactive access to JPEG2000 compressed images over networks. The block diagram in Figure 1 illustrates the basic architecture of a JPIP server and client. [Figure 1.]
Figure 1:
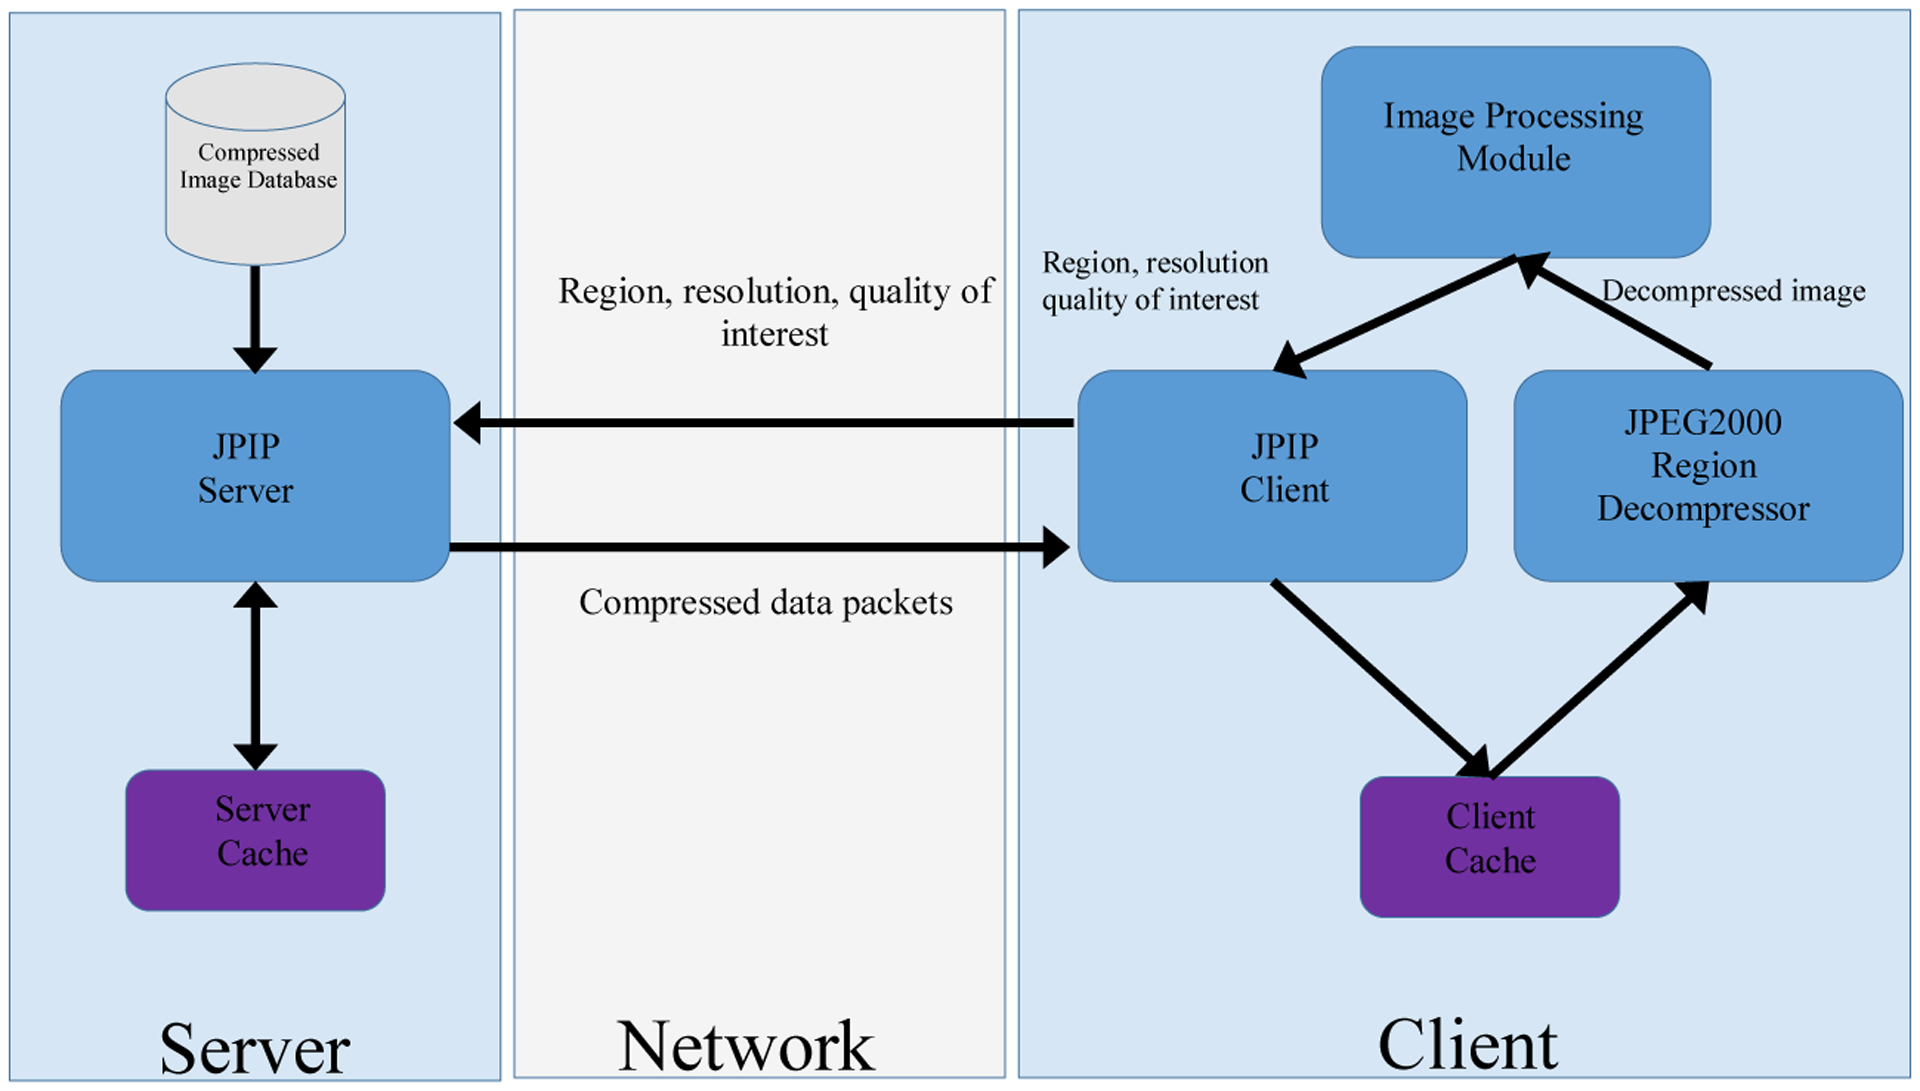
Basic JPIP Client/Server Architecture. This architecture provides efficient transmission and utilization of the images on a remote server. The client requests the server for an image with certain attributes (region coordinates, resolution, and color component). The server responds by transmitting the compressed data that is necessary to obtain the image with the desired attributes. The client then decompresses this image before passing it to the Image Processing Module. In our implementation, the Image Processing Module in Figure 1 is responsible for identification of hotspots.
As suggested in the figure, the client sends request to the server about its desired region, resolution, and color component of interest and the server responds by transmitting the compressed data that is necessary to obtain an image with the desired attributes. While the JPIP framework has been shown to be useful for remote browsing of very large images, it can also provide the essential ingredients for image processing applications that employ distributed storage and computing. The JPIP client can be integrated within the image processing method and communicate the current region, resolution, and color components of interest to the server which, in turn, transmits the corresponding compressed data to the client. A region decompressor can then decompress this compressed data and return it to the image processing method. Note that this framework not only minimizes the amount of data transfer between the storage and computing nodes but also minimizes the computational resources consumed by the compression engine since only data required by the image processing method is transmitted and decompressed. Using the Kakadu Software Development Kit [8], we have created a MATLAB® (Mathworks, Natick, Massachusetts) interface which allows seamless integration of a JPIP client with image processing methods. Using this interface, we have implemented an image analysis method to identify hotspots in breast cancer. In our implementation, the client request a low resolution copy of the color image from the JPIP server. This server responds by transferring the compressed low resolution image over the network which is decompressed by the JPEG2000 Region Decompressor (See Figure 1 for details). In our case, the Image Processing Module in Figure 1 corresponds to the Hotspot Detection module, which is responsible for segmenting and identifying the hotspots in the image. Once the hotspots are identified in low resolution images, their corresponding regions in high resolution images are requested from the server at a higher magnification for viewing/diagnosis.
II.II. Ki-67 and hotspots
Ki-67 is a nuclear protein expressed exclusively during the active cell cycle phases with no expression in quiescent cells [9]. Its presence appears to be necessary for cell proliferation, although its exact function is unclear [10]. In breast cancer, Ki67 has shown promise as an independent prognostic marker and as a predictive marker of responsiveness or resistance to chemotherapy or hormone therapy [11]. According to the published recommendations of the Breast Cancer working group [12], Ki-67 score or index is defined as the percentage of positively stained cells within the total number of malignant cells scored. In Ki-67 scoring, hotspots are generally defined as areas in which Ki-67 staining is most prevalent; or those areas with the highest number of positively staining nuclei within the invasive component.
From image analysis perspective, hotspot detection can be considered as a local density approximation problem. In the past, hotspot detection was partially addressed by a few studies [13–15]. Some of these earlier methods [14, 15] were only tested on small region-of-interest images and their extension to whole slide images is not trivial due to computational challenges. In this work we present an efficient method that approximates the hotspots from a whole slide image within reasonable time using our proposed compression frame-work. The hotspot detection component of this framework is generalization of [16, 17] to whole slide images.
Ki-67 positive cells manifest themselves as brown hue cells in images of breast tissues. The large variations in specimen preparation, staining, and imaging as well as true biological heterogeneity of breast tissue often results in variable brown intensities in Ki-67 stained images [17]. These variations affect the segmentation accuracy of Ki-67 nuclei. Here, we present a modified version of [17] to perform segmentation of breast tissue images. For the sake of completeness, we briefly review the method in [17] and its shortcoming followed by its generalization to whole slide images.
II.III. HotSpot Detection in K-67 Stained Breast Tissue
The method in [17] exploits the intrinsic properties of CIE L*a*b* color space to translate complex Ki67 image segmentation problem into an automatic entropy based thresholding problem. It consists of three main components; clustering of RGB color pixels into three clusters based on cluster centroids, color space transformation in the CIE L*a*b* color space, and entropy thresholding to segment the Ki-67 positive nuclei. Computationally, clustering is the most expensive component among the three. The absence of a closed form solution for clustering and the need for iterative refinement turns [17] into a computational bottleneck. Moreover, the method was originally designed for region of interest (ROI) images with an assumption that each ROI image has some Ki-67 positive nuclei. However, its block-by-block application to a whole slide image usually contains blocks where Ki-67 positive nuclei are completely absent. In those situations, the method erroneously starts to consider negative nuclei as Ki-67 positive nuclei. To reduce the computational complexity and the number of false positives, we propose a modified version of [17] which extends its application to whole slide images. The modified and efficient version consists of three main steps; automatic ROI selection from a whole slide image, extraction of parameters from the selected ROI, and application of [17] to whole slide images with the extracted parameters.
1). Automatic Selection of an ROI from a whole slide image
The aim of this step is to automatically select an ROI image with some Ki-67 positive nuclei. To accomplish this, we manually cropped 25 ROI images with different concentration of Ki-67 positive nuclei from 25 different whole slide images. The size of these ROI images varies between 1K×0.5K and 9K×5K. Nine out of 25 whole slides images were acquired at Cleveland Clinic while the rest were acquired at The Ohio State University. From the 25 manually cropped ROI, we extracted: cluster centroids, the color transformation matrices, and the thresholds resulting from entropy thresholding using [17].
1.1. Cluster Centroids
Figure 2 shows the resulting cluster centroids as piecewise linear functions. Each function consists of nine points – the first three points correspond to first cluster centroid, the next three points represent the second cluster centroid, and the last three points represent the third cluster centroid. Although all ROI images contain Ki-67 positive nuclei, there exists a huge variation in cluster centroids across images. However, the cluster centroids seems to differ less if the ROI images (containing Ki-67 nuclei) are selected from within the same slide. This prompted us to automatically find an ROI from the whole slide image and apply the resulting cluster centroids to whole slide image.
Figure 2:
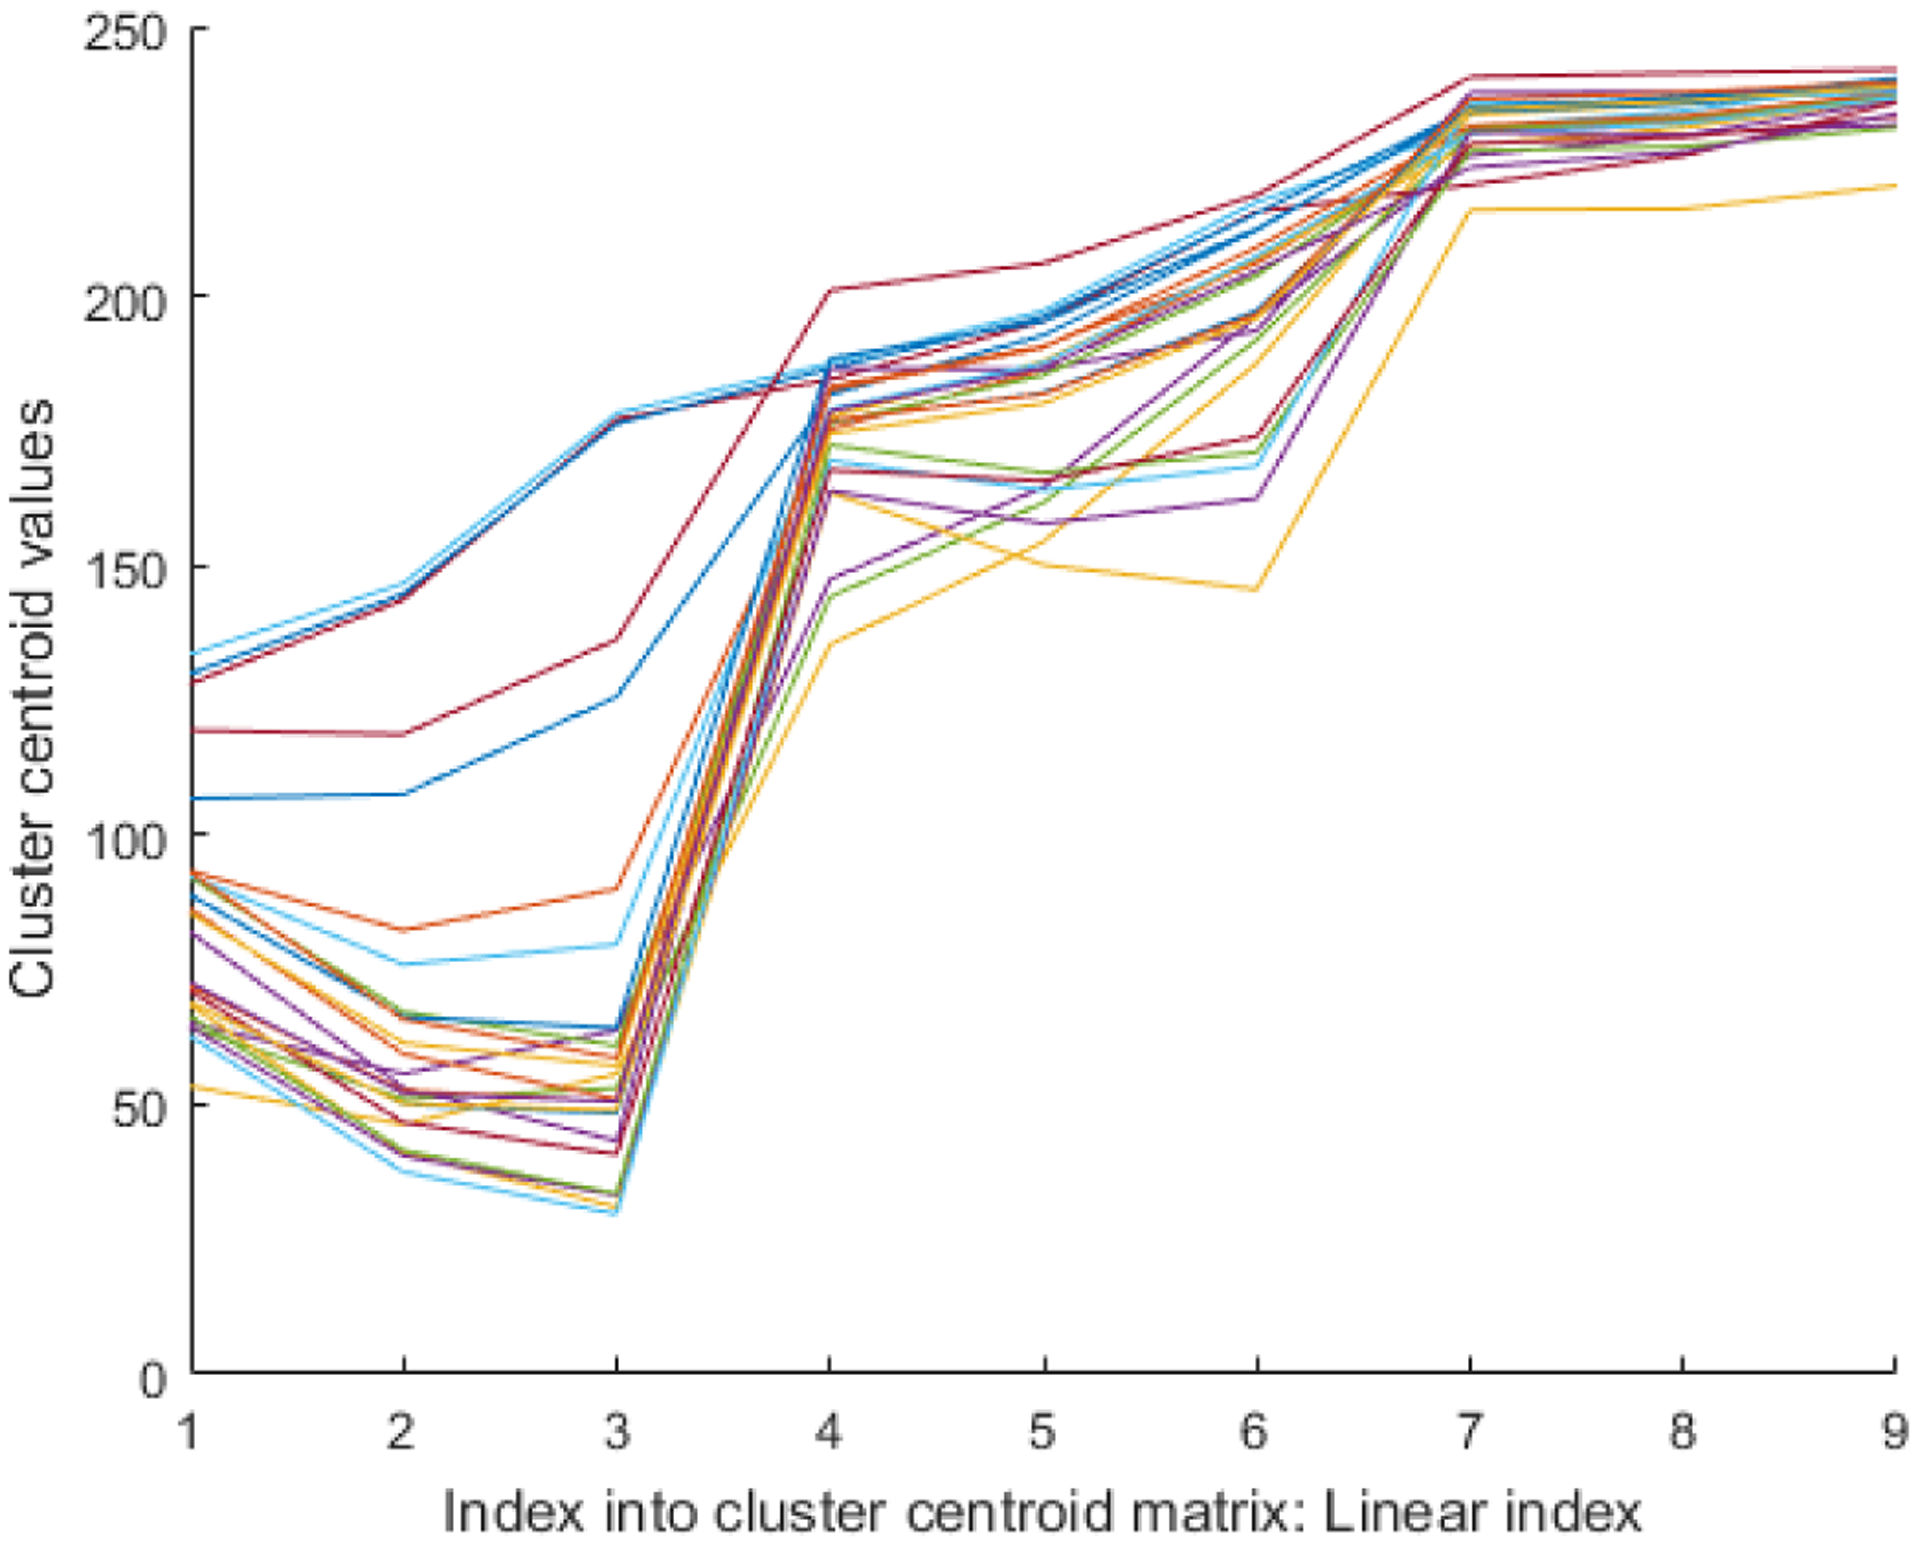
Analysis of cluster centroids: The cluster centroids for 25 ROI images are shown as piecewise linear functions. The cluster centroids for each ROI image are first appended next to each other, hence resulting in a 9 element vector.
To accomplish this we computed the average centroid matrix, as:
Here Cn is the cluster centroid matrix for ROI image n. The columns of the resulting matrix correspond to the cluster centroid. It is worth mentioning that is just an approximation. The true cluster centroids will be extracted after automatic selection of a ROI.
For visualization and other practical reasons, most whole slides images are stored in multi-page format. Our 25 whole slide images in the training dataset are also stored in multipage Tiff format. We extracted a 2.5x magnified image from the multipage Tiff file. The resulting images at 2.5x magnification for our training dataset are nearly 6K×6K in size. We selected 2.5x magnification as the number of Ki-67 nuclei extracted are relatively close to what we get at 40x magnification (highest magnification). The number of Ki-67 positive nuclei tend to drop drastically in images with less than 2.5x magnification. For each 2.5x whole slide image in the training set, we grouped RGB color pixels based on its Euclidean distance from .
1.2. Color transformation matrices
We also computed the color transformation matrices (using [17]) for 25 ROI images. Figure 3 shows the resulting color transformation matrices as piecewise linear function for 25 ROI images. The Eigen vectors in each color transformation matrix are first appended next to each other, hence resulting in a 9 element vector as shown in Figure 3. Interestingly, the color transformation matrix (Figure 3) seems nearly identical for the 25 ROI images. This allowed us to use an average of this transformation matrix, as a color transformation matrix for whole slide images. So, instead of re-computing the color transformation for each block of the whole slide image, we used the same transformation matrix for all of the whole slide images.
Figure 3:
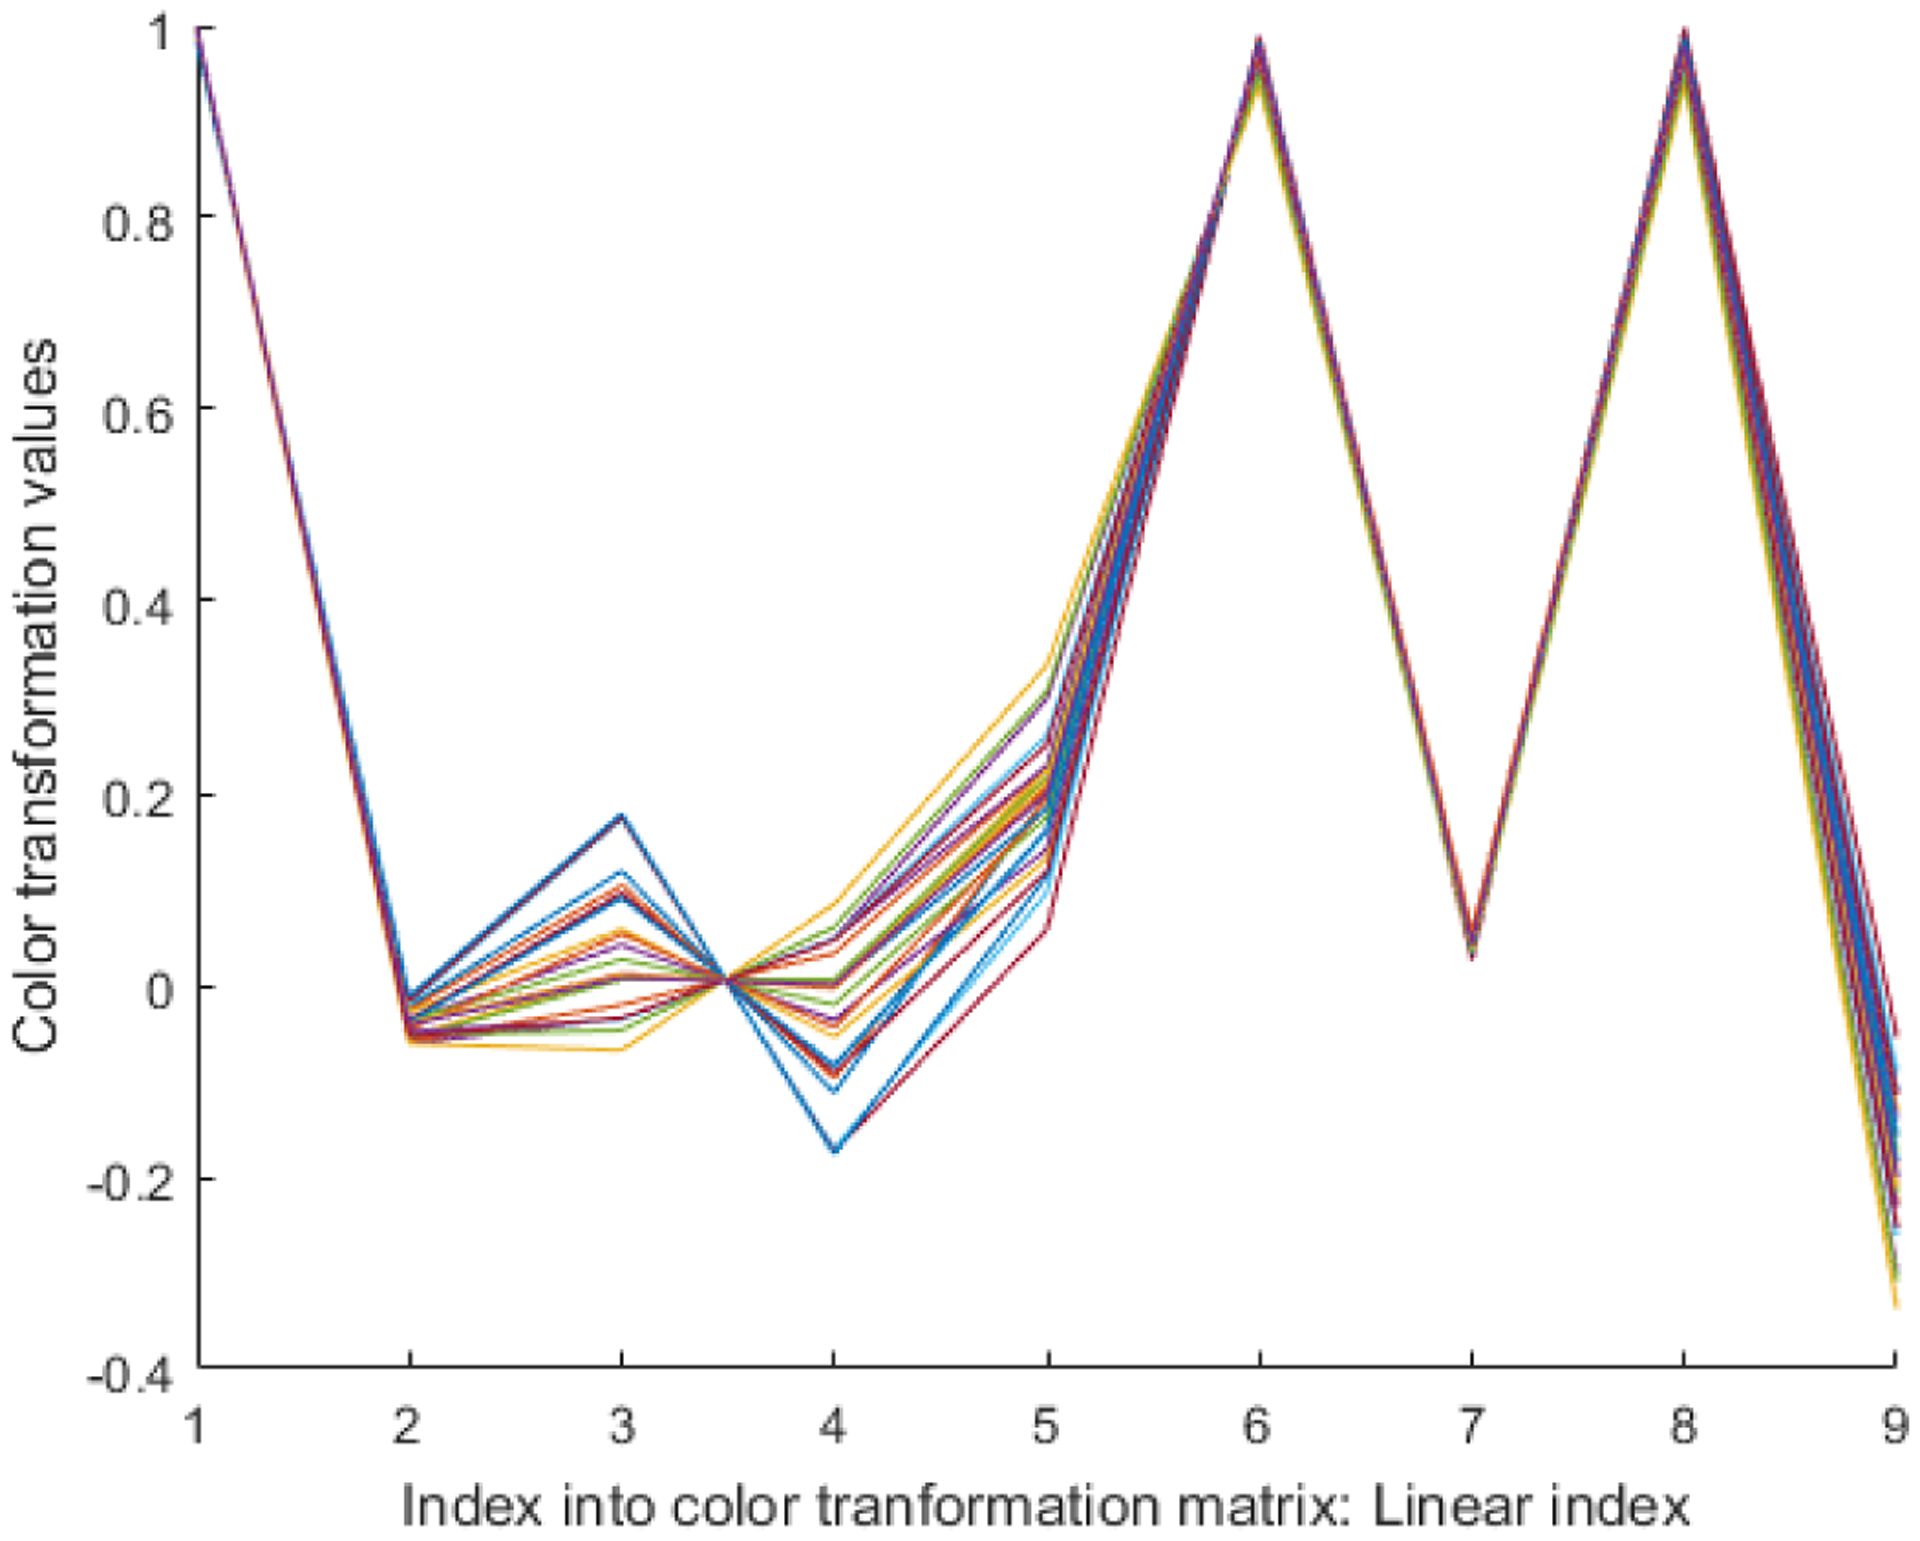
Analysis of color transformation matrix: The color transformation matrices for 25 images are shown as 25 different piecewise linear functions.
1.3. Thresholds
Figure 4 shows the threshold values in terms of a graph for 25 ROI images. The graph reveals that the threshold values change considerably in each image. For this reason, we computed individual thresholds for each block in a whole slide image.
Figure 4:
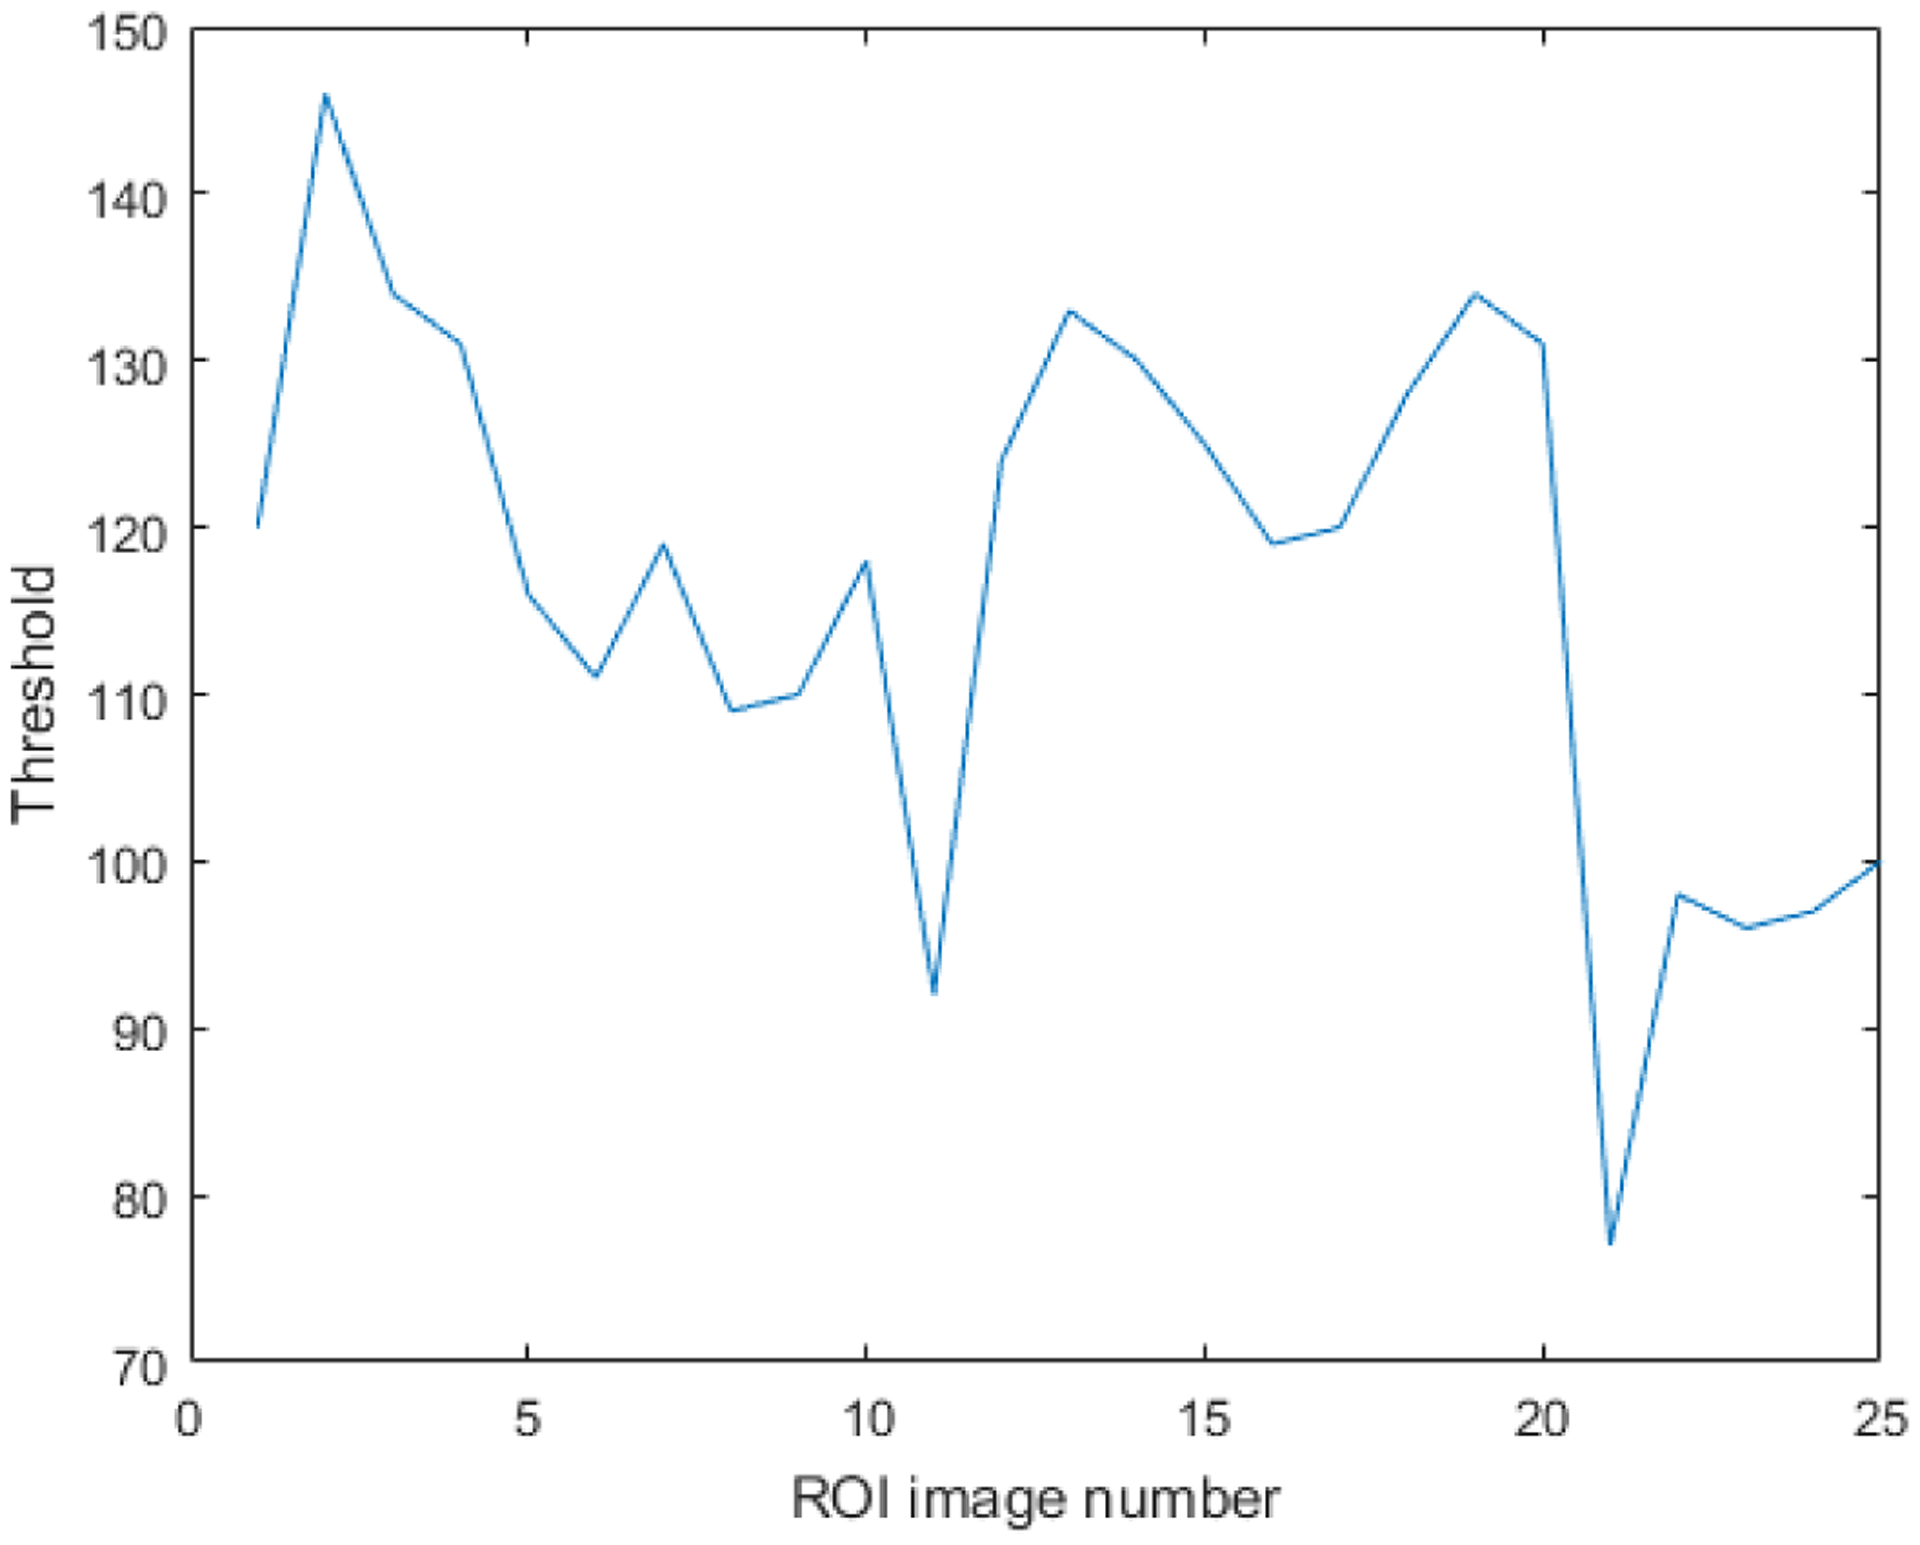
The threshold values for each ROI image as a result of entropy thresholding.
In summary, while and were kept unchanged for all 2.5x images, we computed the individual threshold using entropy thresholding. The pre-computation of and bring considerable computational savings as these do need to be iteratively refined for clustering.
The next step in automatic selection of an ROI is to segment all 2.5x images with precomputed and and entropy thresholding. Once segmented, the images are reduced to 0.25x magnification using bilinear interpolation. The resulting images are again converted into binary images by setting all non-zero elements to 1. The use of bilinear interpolation followed by setting of non-zero elements to 1 ensures that any potential nuclei are not lost as a result of down sampling. The next step is to group the location of the resulting non-zero pixels into seven clusters. One may opt for different number of clusters than 7. Our choice was mainly driven by computational efficiency as it resulted in a large enough ROI regions to reliably extract true cluster centroids. The automatic selection of an ROI takes nearly 8 seconds per image. As a last step, we use the convex shape of the cluster with the minimum point to centroid distance as an automatically selected ROI.
2). Extraction of parameters from the selected ROI
Once a ROI is automatically selected, we compute the true cluster centroids from the selected ROI according to the method in [17]. It is evident from Figure 3 that the color transformation matrix is relatively constant. For this reason, we decided to use as our color transformation matrix in [17]. From Figure 4, it is necessary that we compute entropy thresholding for each whole slide image. For this reason, entropy thresholding needs to be computed along the same line as it was computed in [17].
3). Application of [17] to whole slide images
For efficient segmentation of our whole slide images, we used lower resolution images (8x). To segment a given image, we computed its ROI and its respective We plugged and as constants in [17] to perform segmentation at lower resolution for a whole slide image.
In [16], we used an automated method to detect individual nuclei from nuclei clumps at 40x magnification. However, this method is computationally demanding. For computational efficiency, we benefit from relatively uniform size of Ki-67 positive nuclei to approximate the number of nuclei within nuclei clumps. During training, average nucleus size was manually measured and it was used during testing to approximate the number of nuclei within clusters of nuclei.
Once the nuclei centroids are approximated, we used a modified version of α-shape maps [16] to generate a heat-map from nuclei centroids. The α-shape was computed from the k-nearest centroids of the ith centroid. α-shape is a generalization of convex hull to non-convex shapes and attempts to define the shape of a finite set of point in the space. Each α-shape is a binary image where the points inside the α-shape are assigned the value of 1. We further compute the weighted map by using the equation:
| (1) |
Here, Λi is the area function which computes the area of the ith α-shape and represents the set of k-nearest centroids of Ci (represents the centroid of the ith nucleus). The heat map, Hm, can be computed as:
| (2) |
However, computing α-shapes in a large size image is computationally challenging. As we are only utilizing the nuclei centroids (locations), we can afford to use a much lower resolution image to generate heat-maps without losing much information. Dividing the location of nuclei centroids by a factor of d directly corresponds to d-times lower resolution of resulting heat-map. However, dividing the location by a factor of d will not result in loss of any nuclei but will only bring them closer in proximity. In our experiments, we set d = 10 as it results in least number of overlapping nuclei. After generating the heat maps, the heat map is segmented using fast marching [18]. We used gray-scale intensity difference as weights for image pixels. The top 2% (highest values in the heat-map) were set to initialize the fast marching. Once again, this step was also performed at the same resolution as the heat-maps. The method is summarized in Image 5.
III. RESULTS
This hotspot detection method was implemented in MATLAB and integrated with the proposed client-server framework. A total of 50 images of breast tissue scanned at 40× magnification with ScanScope™ (Aperio, Vista CA) were used in this study. The images ranged between 2.2 gigapixels to 53 gigapixels in size. An expert pathologist manually annotated the tumor as well as the hotspots in all of the images. We selected 25 images for training and 25 for testing. All processing was performed within tumor regions which were outlined by the pathologist. The hotspots detected by the proposed method were evaluated against the hotspots outlined by the pathologists. For 5 images, we detected more hotspots then the pathologist. Those images were then re-evaluated by the pathologists. After the re-evaluation, the pathologists agreed with the extra hotspots detected by the proposed method.
Three different approaches for image transfer were evaluated within the proposed framework and the results of the experiments on seven out of 25 images are provided in Table 1. The Table was only limited to seven images due to space constraints. The first approach (denoted as “Full Tissue Image” in the table) corresponds to a “conventional approach” where the entire compressed codestream is transferred to the computing node at full magnification. In this case, the average effective compression ratio (ECR) calculated as the ratio of the number of bytes used to represent the uncompressed image to the number of bytes transferred over the network is roughly 21(±17) on 25 test images. A Ki-67 image contains both foreground (tissue) and background (non-tissue or unstained region). The background is usually smooth in nature which leads to better compression ratio. In general, images with large quantity of tissue results in lower ECR while images with small quantity of tissue leads to higher ECR. The runtimes for decompression of the transferred data are also tabulated in Table 1. It is easy to see that the decompression runtimes in this case are high and considerably exceed the runtime of the hotspot detection method. The second approach (denoted as “Full ROI” in the table) corresponds to an intermediate integration of the hotspot detection method with the proposed framework. In this case, the tumor region is determined and a minimum enclosing rectangular region of interest around the tumor region is requested from the server for further processing. The average ECR in this case is 127 (±19), roughly an order of magnitude higher than the ECR of the conventional method. Correspondingly, there is a considerable decrease in the decompression runtimes as well. Finally, the third approach (denoted as ”Only ROI” in the table) represents a much tighter integration of the client software with the hotspot detection method where only the tumor region is requested from the server (instead of the enclosing rectangular region). The average ECR in this case was 222 (±13) and the decompression runtimes are on average 10 times faster than the conventional approach.
Table 1.
The runtimes and total data transfers for different approaches for seven different images. S, RT, TD, and TS stand for Image number, Runtime (seconds), Total Data (Megabytes), and the Size (Gigabytes) of the Whole slide image, respectively.
| S | Only ROI | Full ROI | Full Tissue Image | ||||
|---|---|---|---|---|---|---|---|
| RT (Sec) | TD (MB) | RT (Sec) | TD (MB) | RT (Sec) | TD (MB) | SW (GB) | |
| 1 | 110 | 72.78 | 260 | 176.17 | 686.4 | 487.67 | 28 |
| 2 | 73 | 49.46 | 180 | 116.83 | 1074.5 | 445.90 | 24 |
| 3 | 127 | 83.78 | 240 | 156.17 | 712.8 | 486.35 | 25 |
| 4 | 56 | 37.88 | 97 | 60.75 | 1063.12 | 698.14 | 30 |
| 5 | 121 | 81.29 | 221 | 142.28 | 3202.29 | 2161.80 | 26 |
| 6 | 41 | 22.24 | 67 | 36.09 | 1163.12 | 657.02 | 28 |
| 7 | 80 | 87.65 | 140 | 131.49 | 515.2 | 507.40 | 22 |
Table 2 shows the comparison of the proposed method to the method in [17]. We performed the comparison in terms of correctly identifying hotspots for the 25 whole slide test images. It is evident from the results that the method in [17] gives rise to a large number of false positives. During block-by-block implementation, the method in [17] gives rise to false Ki67 positives nuclei in areas where there are no positive nuclei. These false nuclei results in numerous false positive nuclei.
Table 2.
Comparison of the proposed method with [17] in terms of correctly identifying hotspots for 25 test images.
| [17] | Proposed Method | |
|---|---|---|
| True positives | 45 | 57 |
| False Positives | 39 | 0 |
| False Negatives | 12 | 0 |
IV. DISCUSSION & CONCLUSIONS
Clinicians and researchers in histopathology are increasingly generating and using whole slide images. The slide volumes of a typical academic pathology department require round-the-clock operation of multiple scanners which can be loaded with hundreds of slides and can scan continuously [19]. Thus, the volume of data that is expected to be generated by a fully digital pathology practice is enormous. In addition to tremendous storage requirements, the large data sizes also present challenges for rapid and interactive access to image data. High performance image rendering with low-lag times are critical to match or exceed the current productivity levels of pathologists using the light microscope. While there is an increased interest in the use of quantitative image analysis algorithms for disease detection, diagnosis, and prognosis prediction to complement the opinion of the pathologist, these algorithms require efficient access to image data. The practice of pathology in the era of Big Data requires development of advanced data compression methods. The current manuscript is geared towards creating an integrated computational framework for image compression that allows us to efficiently store, process, and provide rapid access to the high quality images. In this regards, our contribution is twofold;
We presented a task specific image compression framework which provides the user with the flexibility to perform context aware image compression. This enabled us to use a variable compression rate within the same image. As a consequence, the proposed framework minimizes the data transfer between storage and computing nodes and significantly reduces the computational resources consumed by the decompression engine. For instance, the variable nature of our framework allows for higher compression ratios in areas outside of the tumor and relatively lower compression ratios within the tumor region. This is currently not possible with the existing compression methodologies.
We presented an efficient method to detect hotspots from whole slide images of breast tissues. On average it took 88.6 seconds (standard deviation of 36.3 seconds) to detect hotspots from whole slide images. This processing time does not include the time required to read/transfer the image.
Natural directions for future research include exploration of the impact of quality scalability features with various image processing methods as well as incorporation of task-based image quality metrics into the proposed framework.
Figure 5:
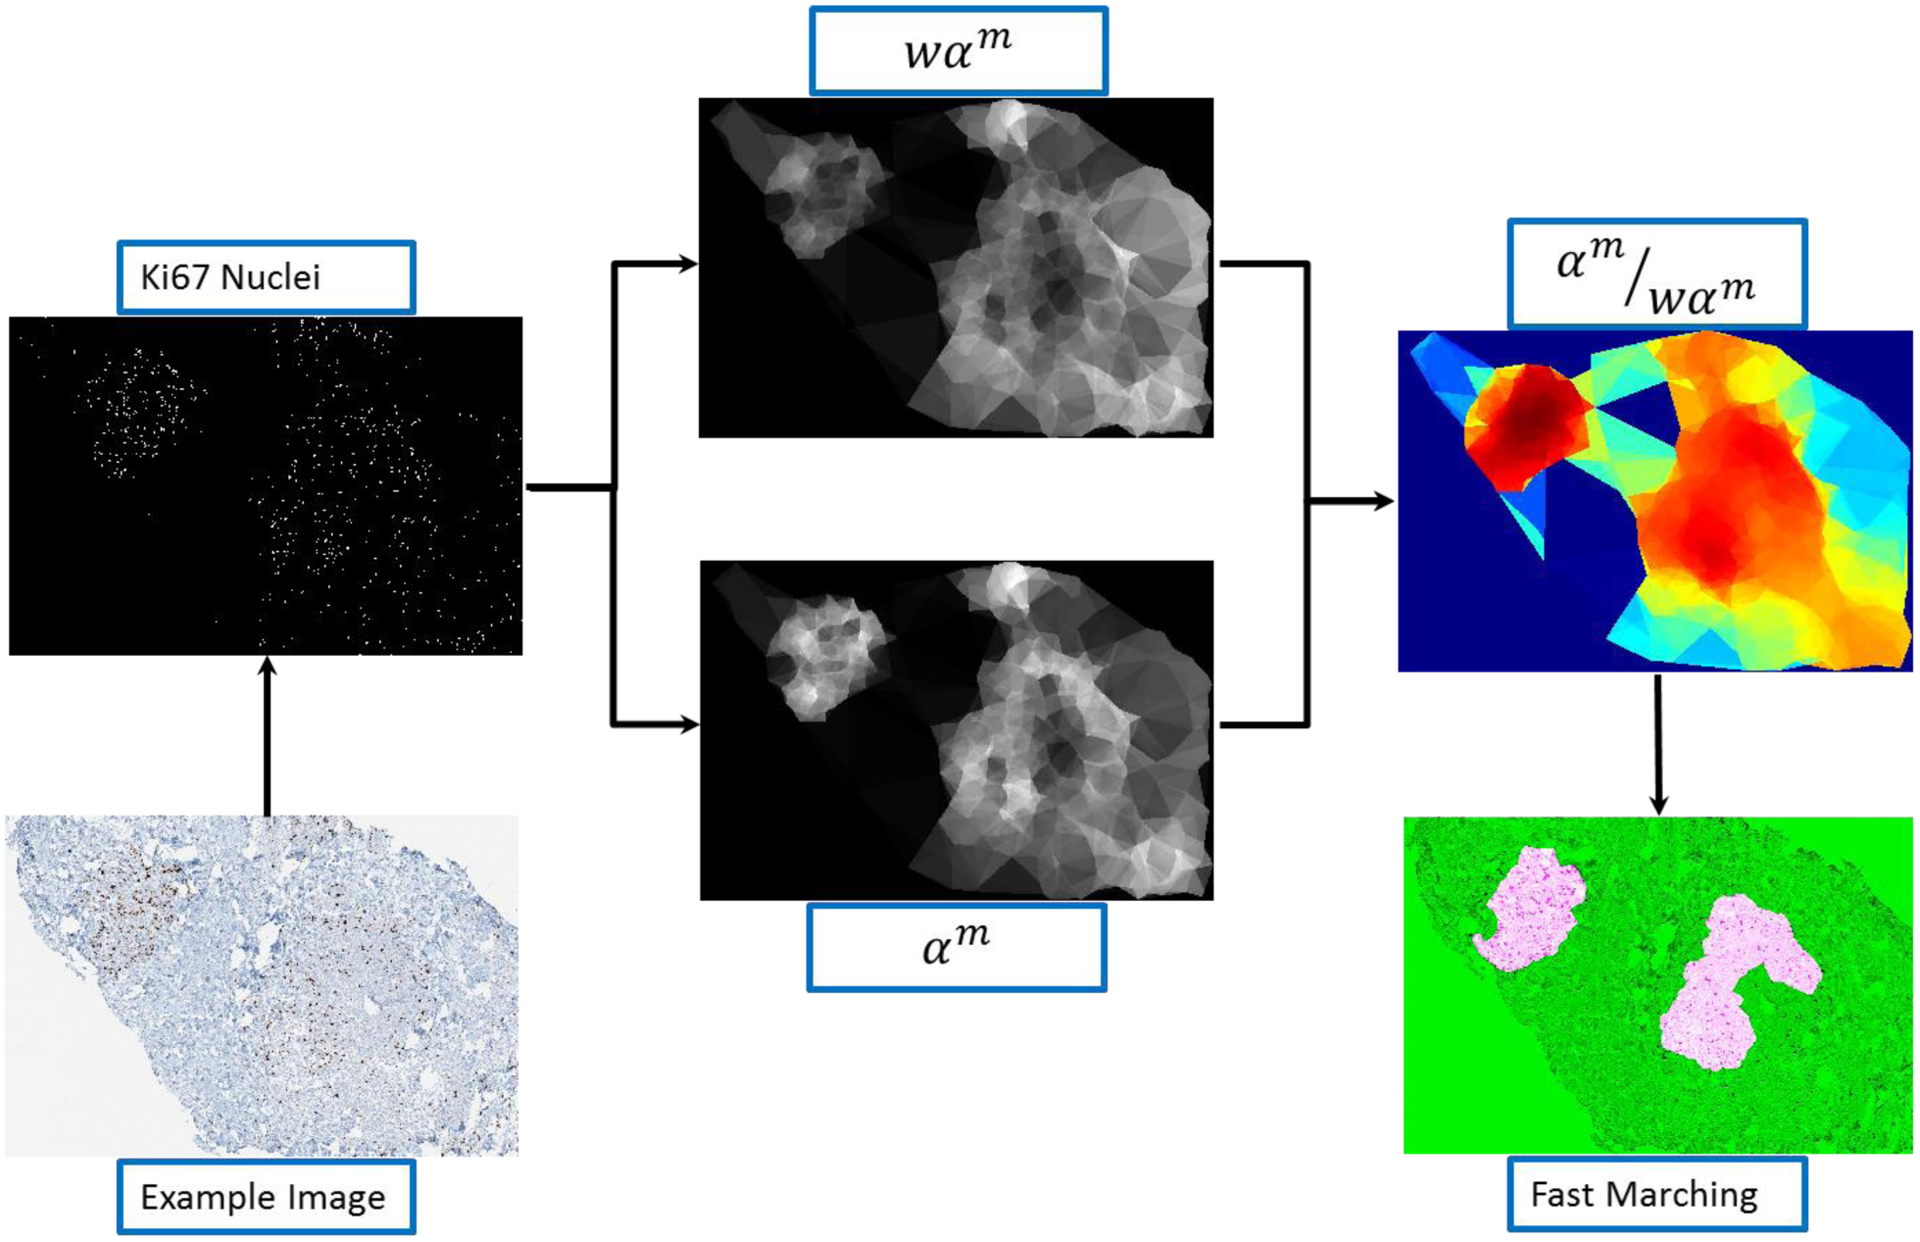
Depiction of the hotspot detection process.
Acknowledgement:
This work was supported in part by the National Institutes of Health (NCI 1U01CA198945-01).
REFERENCES
- [1].Chen CP and Zhang C-Y, “Data-intensive applications, challenges, techniques and technologies: A survey on Big Data,” Information Sciences, vol. 275, pp. 314–347, 2014. [Google Scholar]
- [2].Barrett HH, Yao J, Rolland JP, and Myers KJ, “Model observers for assessment of image quality,” Proceedings of the National Academy of Sciences, vol. 90, pp. 9758–9765, 1993. [DOI] [PMC free article] [PubMed] [Google Scholar]
- [3].Neifeld MA, Ashok A, and Baheti PK, “Task-specific information for imaging system analysis,” JOSA A, vol. 24, pp. B25–B41, 2007. [DOI] [PubMed] [Google Scholar]
- [4].Skodras A, Christopoulos C, and Ebrahimi T, “The JPEG 2000 still image compression standard,” IEEE Signal processing magazine, vol. 18, pp. 36–58, 2001. [Google Scholar]
- [5].Pu L, Marcellin MW, Bilgin A, and Ashok A, “Image compression based on task-specific information,” in 2014 IEEE International Conference on Image Processing (ICIP), 2014, pp. 4817–4821. [Google Scholar]
- [6].Taubman D and Marcellin M, JPEG2000 Image Compression Fundamentals, Standards and Practice: Image Compression Fundamentals, Standards and Practice vol. 642: Springer Science & Business Media, 2012. [Google Scholar]
- [7].“Information technology -- JPEG 2000 image coding system: Interactivity tools, APIs and protocols,” ed: ISO/IEC 15444–9, 2005. [Google Scholar]
- [8].“Kakadu Software,” ed: http://www.kakadusoftware.com, Date last accessed 1-February-2015.
- [9].Gerdes J, Schwab U, Lemke H, and Stein H, “Production of a mouse monoclonal antibody reactive with a human nuclear antigen associated with cell proliferation,” International journal of cancer, vol. 31, pp. 13–20, 1983. [DOI] [PubMed] [Google Scholar]
- [10].Schlüter C, Duchrow M, Wohlenberg C, Becker M, Key G, Flad H-D, and Gerdes J, “The cell proliferation-associated antigen of antibody Ki-67: a very large, ubiquitous nuclear protein with numerous repeated elements, representing a new kind of cell cycle-maintaining proteins,” The Journal of cell biology, vol. 123, pp. 513–522, 1993. [DOI] [PMC free article] [PubMed] [Google Scholar]
- [11].Yerushalmi R, Woods R, Ravdin PM, Hayes MM, and Gelmon KA, “Ki67 in breast cancer: prognostic and predictive potential,” The lancet oncology, vol. 11, pp. 174–183, 2010. [DOI] [PubMed] [Google Scholar]
- [12].Dowsett M, Nielsen TO, A’Hern R, Bartlett J, Coombes RC, Cuzick J, Ellis M, Henry NL, Hugh JC, and Lively T, “Assessment of Ki67 in breast cancer: recommendations from the International Ki67 in Breast Cancer working group,” Journal of the National Cancer Institute, 2011. [DOI] [PMC free article] [PubMed] [Google Scholar]
- [13].Lopez XM, Debeir O, Maris C, Rorive S, Roland I, Saerens M, Salmon I, and Decaestecker C, “Clustering methods applied in the detection of Ki67 hot‐spots in whole tumor slide images: An efficient way to characterize heterogeneous tissue‐based biomarkers,” Cytometry Part A, vol. 81, pp. 765–775, 2012. [DOI] [PubMed] [Google Scholar]
- [14].Niazi MKK, Downs-Kelly E, and Gurcan MN, “Hot spot detection for breast cancer in Ki-67 stained slides: image dependent filtering approach,” in SPIE Medical Imaging, 2014, pp. 904106-904106-8. [Google Scholar]
- [15].Khan Niazi MK, Yearsley MM, Zhou X, Frankel WL, and Gurcan MN, “Perceptual clustering for automatic hotspot detection from Ki‐67‐stained neuroendocrine tumour images,” Journal of microscopy, vol. 256, pp. 213–225, 2014. [DOI] [PubMed] [Google Scholar]
- [16].Niazi MKK, Hartman DJ, Pantanowitz L, and Gurcan MN, “Hotspot detection in pancreatic neuroendocrine tumors: Density approximation by α-shape maps,” in SPIE Medical Imaging, 2016, pp. 97910B–97910B. [Google Scholar]
- [17].Niazi MKK, Pennell M, Elkins C, Hemminger J, Jin M, Kirby S, Kurt H, Miller B, Plocharczyk E, and Roth R, “Entropy based quantification of Ki-67 positive cell images and its evaluation by a reader study,” in SPIE Medical Imaging, 2013, pp. 86760I–86760I. [Google Scholar]
- [18].Sethian JA, Level set methods and fast marching methods: evolving interfaces in computational geometry, fluid mechanics, computer vision, and materials science vol. 3: Cambridge university press, 1999. [Google Scholar]
- [19].Huisman A, Looijen A, van den Brink SM, and van Diest PJ, “Creation of a fully digital pathology slide archive by high-volume tissue slide scanning,” Human pathology, vol. 41, pp. 751–757, 2010. [DOI] [PubMed] [Google Scholar]


