

Abstract
Background
The aim of the study was to define the clinical significance of circulating tumor cells (CTCs)/circulating tumor endothelial cells (CTECs) and their subtypes in small cell lung cancer (SCLC) patients.
Methods
CTCs/CTECs and their subtypes were determined using SE‐iFISH technology in 33 SCLC patients before initial treatment (B1), after two cycles of chemotherapy (B2), at the completion of chemotherapy (B3), and disease progression (B4). The correlations with clinical characteristics, progression‐free survival (PFS), and overall survival (OS) were analyzed.
Results
CTCs and CTECs were detected in 96.6% and 65.5% of patients, respectively. Patients had higher levels of CTCs compared with CTECs in circulation (p < 0.05). Extensive‐stage SCLC patients tended to have higher CTEC counts (p = 0.035), and the detection of CTC‐white blood cell (CTC‐WBC) clusters was associated with a worse response to treatment (p = 0.030). Patients with CTC‐WBC clusters at B1 (17.3 vs. 22.6 months, p = 0.041) and B2 (19.9 vs. 25.2 months, p = 0.018) had significantly shorter OS than those with no detection. Additionally, their presence was revealed as independent predictors for a worse OS in multivariable analyses (B1: HR 9.3, 95% CI: 1.4–48, p = 0.0079; B2: HR 4.4, 95% CI: 1.1–18, p = 0.041). A high CTC level at B4 was an adverse prognostic factor for SCLC patients (PFS: 8.7 vs. 22.5 months, p = 0.0026; OS: 19 months vs. not reached, p = 0.0086). CTC clusters and CTECs also showed prognostic values.
Conclusions
The presence of CTC‐WBC clusters at baseline and after two‐cycle chemotherapy and the total CTC counts at the completion of chemotherapy are strong predictors for the prognostic survival of SCLC patients receiving first‐line treatment.
Keywords: circulating tumor cells, circulating tumor endothelial cells, prognosis, small cell lung cancer, therapeutic efficacy
It has been proved in many studies that CTCs can be used as a prognostic biomarker in SCLC patients. Here, we report that CTC‐WBC clusters may also be a valuable predictor for SCLC prognosis. In this study, patients with CTC‐WBC clusters before chemotherapy (17.3 vs. 22.6 months, p = 0.041) and after two cycles of treatment (19.9 vs. 25.2 months, p = 0.018) tended to have a significantly shorter overall survival duration.
INTRODUCTION
Small cell lung cancer (SCLC) accounts for approximately 15% of all lung cancer cases, with an estimated 250 000 new diagnoses and 200 000 deaths worldwide each year. 1 Characterized by rapid growth and early metastatic potential, SCLC is often detected late and more than 70% of patients are diagnosed with an advanced stage at presentation. 2 Therefore, systemic chemotherapy has remained the mainstay of first‐line treatment for SCLC, with the addition of concurrent radiotherapy for some early stage diseases. 3 Despite the initially remarkable sensitivity to platinum‐based chemotherapy, most SCLC patients inevitably relapse or progress during a short period, resulting in a clinically dismal prognosis. 2 Liquid biopsy, known for its noninvasiveness, may provide important information about the tumor status during treatment and throughout the course of the disease.
Circulating tumor cells (CTCs) are cancer cells shed from solid tumor lesions into the bloodstream and are considered precursors of metastatic colonization. 4 In contrast to circulating tumor DNA (ctDNA), CTCs could be defined as a category of the functional representatives of tumor status. SCLC has a relatively high level of CTCs compared with other tumor types. 5 Although no consensus has been reached on the optimal CTC threshold, its prognostic value in SCLC has been validated by a series of studies. 6 , 7 , 8 , 9 , 10 Moreover, it has been shown that white blood cells (WBCs) can accelerate this seeding process through a direct interaction with CTCs to regulate the cell cycle. 11 However, the role of CTC–WBC clusters in SCLC prognostication has not previously been reported.
Circulating tumor endothelial cells (CTECs) are tumor‐derived endothelial cells that are shed into the peripheral circulation. 12 They are detached from the tumor vasculature with chaotic structures and may reflect the properties of pathological angiogenesis in the tumor microenvironment. 12 The enumeration of CTECs has been shown not only to distinguish healthy volunteers from colorectal cancer patients, but also to correlate with tumor burden in esophageal cancer and non‐small cell lung cancer (NSCLC) patients. 13 , 14 Recently, CTECs expressing programmed death‐ligand 1 (PD‐L1) were investigated as biomarkers for resistance to checkpoint blockade immunotherapy, and were found to exhibit more significantly prognostic values than PD‐L1–positive CTCs in NSCLC patients. 15
In this study, CTCs and CTECs were isolated dynamically from the peripheral blood of 33 SCLC patients using a subtraction enrichment (SE) strategy, and their phenotypic characterizations, including CTC–WBC clusters and the expression of the cancer stem cell (CSC) marker, CD44, and the epithelial to mesenchymal transition (EMT) marker, vimentin, were also evaluated by immunostaining–fluorescence in situ hybridization (iFISH) technology of cytelligen. The prognostic value of these potential biomarkers for progression‐free survival (PFS) and overall survival (OS) was subsequently determined.
METHODS
Study design
This was a prospective, multicenter study (registered at the Chinese Clinical Trial Registry as ChiCTR1900023956) conducted at three hospitals from November 2018 to January 2020. Patients were eligible if they were 18–75 years old with a histologically‐confirmed SCLC, were systemic treatment‐naïve, and had an Eastern Cooperative Oncology Group (ECOG) performance status between 0 and 1. Peripheral blood samples were collected for CTC/CTEC isolation and analysis before initial treatment (baseline, B1), following two cycles of chemotherapy (B2), at the completion of first‐line treatment (B3), and disease progression (B4). If a patient's progressive disease occurred before the completion of chemotherapy, the time point of the blood sample collection was considered B4. This study was approved by independent ethical committees, and all enrolled patients signed informed consent forms. Data were collected for the patients' sex, age, smoking status, site of metastasis, clinical stage, performance status, treatment received, therapeutic response, and survival duration.
Treatment and evaluation
All enrolled patients received four to six cycles of a first‐line chemotherapy regimen. Concurrent thoracic radiotherapy was administered for limited‐stage (LS) patients. Prophylactic cranial irradiation (PCI) was also given for LS patients who had a positive response to initial chemoradiotherapy. Both the Veterans Administration Lung Cancer Study Group (VALSG) and the eighth American Joint Committee on Cancer (AJCC) TNM staging systems were used to determine the disease stage of SCLC patients. CT examinations were performed after every two cycles of chemotherapy for tumor response assessments, and thereafter imaging was carried out every 12 weeks. The tumor size and its response to therapy were evaluated according to the Response Evaluation Criteria in Solid Tumors (RECIST) version 1.1. 16 PFS was defined as the time from the initial treatment until the first objective evidence of progressive disease. OS was defined as the time from the initial treatment until death by any cause.
SE‐iFISH for CTC/CTEC analysis
CTC and CTEC isolation were performed according to the manufacturer's updated instructions with minor modifications (Cytelligen). 17 A volume of 6 ml of blood was collected using a tube containing ACD anticoagulant (Becton Dickinson). Blood samples stored at room temperature were processed within 48 h. First, the samples were centrifuged at 200 × g for 15 min at room temperature to obtain sedimented blood cells. Then, after mixing with 3.5 ml of hCTC buffer, were loaded onto a nonhematopoietic cell separation matrix and centrifugation was implemented at 450 × g for 5 min to obtain a solution containing tumor cells and WBCs without red blood cells. Third, the solution was incubated with 300 μl of immunomagnetic beads conjugated to a cocktail of antileukocyte mAbs in a 50 ml tube at room temperature for 30 min with gentle shaking. A magnetic separator was used to deplete the WBCs bound to immunobeads. Finally, a cell mixture was obtained when solutions free of magnetic beads were mixed again with hCTC buffer and subsequently centrifuged at 500 × g for 4 min.
The cell mixtures obtained from the blood samples based on the SE technique described above can be used for various experimental applications, such as cell viability evaluations and primary tumor cell culture. In this study, cell smears with a special fixative were prepared on the coated and formatted CTC slides (Cytelligen) for subsequent iFISH procedures. Briefly, dried monolayer cells on the slides were rinsed to hybridize with the Vysis chromosome 8 centromere probe (CEP8) SpectrumOrange (Abbott Laboratories), followed by incubation with CD44, CD45, and vimentin mAbs conjugated to different fluorescence labels. Finally, an automated system for CTC scanning and analyzing was applied to processed samples.
Statistical considerations
The difference between CTC and CTEC levels and the distribution of CTC/CTEC counts within the different groups of clinical characteristics were compared using the Mann–Whitney or Kruskal–Wallis tests. The correlation of CTC–WBC clusters with clinical characteristics was analyzed using Fisher's exact test. To determine the cutoff value of CTCs or CTECs that provided the best separation in survival estimation, a rank statistic was calculated at each cut point, and the statistics were then maximized through the method of Hothorn and Lausen. 18 The PFS and OS were assessed by a Kaplan–Meier analysis and compared using the log–rank test. A univariate Cox proportion hazard regression analysis for PFS and OS was carried out for clinicopathological factors, including age, sex, ECOG performance status, TNM stage, and CTCs/CTECs counts and their subtypes. Patients (N = 3) with no data at both B1 and B2 were excluded, and the data at B3 and B4 were also discarded to reduce the potential bias due to missing data. The factors with a statistical significance of p ≤ 0.1 in the univariate analysis for either PFS or OS were included in the multivariable Cox model. p‐values of <0.05 were considered to be statistically significant and all statistical analyses were two‐sided. All data analyses were carried out with R version 4.0.4.
RESULTS
Patient demographics
A total of 33 patients with SCLC were enrolled in this study between November 2018 and January 2020. All patients were evaluable and included in the final analysis. The clinical characteristics and treatment information of all patients are summarized in Table 1. Notably, an objective response was found in 26 (78.8%) patients and disease control was achieved in 32 (97.0%) patients. By the cutoff date, May 10, 2021, 24 (72.7%) patients had experienced disease progression and 17 (51.5%) patients had died. The median PFS and OS of SCLC patients was 11.5 months (range, 1.7–25.9 months) and 19.7 months (range, 2.8–30.2 months), respectively. The median follow‐up time for all patients was 20.0 months (range, 2.8–30.2 months).
TABLE 1.
Clinicopathological characteristics of patients (N = 33)
| Characteristics | Number of patients (%) | Characteristics | Number of patients (%) |
|---|---|---|---|
| Age | Metastases | ||
| Median (range) | 63 (43~69) | Yes | 8 (24.2%) |
| Sex | No | 25 (75.8%) | |
| Male | 24 (72.7%) | Efficacy | |
| Female | 9 (27.3%) | PR | 26 (75.8%) |
| Smoking status | SD | 5 (15.2%) | |
| Current smoker | 22 (66.7%) | PD | 1 (3.0%) |
| Former smoker | 4 (12.1%) | Chemotherapy regimen | |
| Never smoker | 7 (21.2%) | EP | 31 (93.9%) |
| ECOG PS | Others | 2 (6.1%) | |
| 0 | 21 (63.6%) | Chemotherapy cycles | |
| 1 | 12 (36.4%) | Median (range) | 6 (2 ~ 8) |
| VALSG stage | Thoracic radiotherapy | ||
| Limited disease | 24 (72.7%) | Yes | 25 (75.8%) |
| Extensive disease | 9 (27.3%) | No | 8 (24.2%) |
| TNM stage | PCI | ||
| II | 2 (6.1%) | Yes | 15 (45.5%) |
| III | 23 (69.7%) | No | 17 (51.5%) |
| IV | 8 (24.2%) | Unknown | 1 (3.0%) |
Abbreviations: ECOG PS, Eastern Cooperative Oncology Group performance status; PCI, prophylactic cranial irradiation; VALSG, Veterans Administration Lung Cancer Study Group.
CTC and CTEC counts before and after chemotherapy
Blood samples were collected from 29, 27, and 17 patients at the B1, B2, and B3 points, respectively. There were 26 patients with both B1 and B2 blood samples and 14 patients who had all blood samples at the B1, B2, and B3 points; however, blood samples at disease progression were available from only eight patients. Thus, subsequent analyses were confined to the data from the B1 to B3 time points.
CTCs were detected in almost all the blood samples at baseline except for only one patient. CTECs, however, were detected in only 65.5% (19/29) of patients before treatment (Table 2). The results revealed that SCLC patients have an obviously higher level of CTCs than CTECs in circulation during the treatment process (Figure 1a). Unexpectedly, both the CTC and CTEC counts among the three time points did not show a statistically significant change (p > 0.05, Figure 1b). The median CTC counts were eight, 10, and 7 at the B1, B2, and B3 time points, respectively. The median CTEC counts were two, one and one at the three time points (Table 2).
TABLE 2.
Detection of CTCs, CTECs, CTC clusters, and CTC–WBC clusters at baseline, after two cycles of treatment, and at the completion of chemotherapy
| B1 | B2 | B3 | |
|---|---|---|---|
| Blood samples (N, %) | 29 | 27 | 17 |
| CTCs, median (range) | 8 (0–30) | 10 (1–98) | 7 (1–25) |
| CTCs positive (N, %) | 28 (96.6) | 27 (100) | 17 (100) |
| CTECs, median (range) | 2 (0–8) | 1 (0–42) | 1 (0–16) |
| CTECs positive (N, %) | 19 (65.5) | 16 (59.3) | 10 (58.8) |
| CTC clusters positive (N, %) | 4 (13.8) | 7 (25.9) | 4 (23.5) |
| CTC–WBC clusters positive (N, %) | 7 (24.1) | 13 (48.1) | 4 (23.5) |
Abbreviations: B1, baseline; B2, after two cycles of treatment; B3, at the completion of chemotherapy; CTCs, circulating tumor cells; CTECs, circulating tumor endothelial cells; WBC, white blood cells.
FIGURE 1.
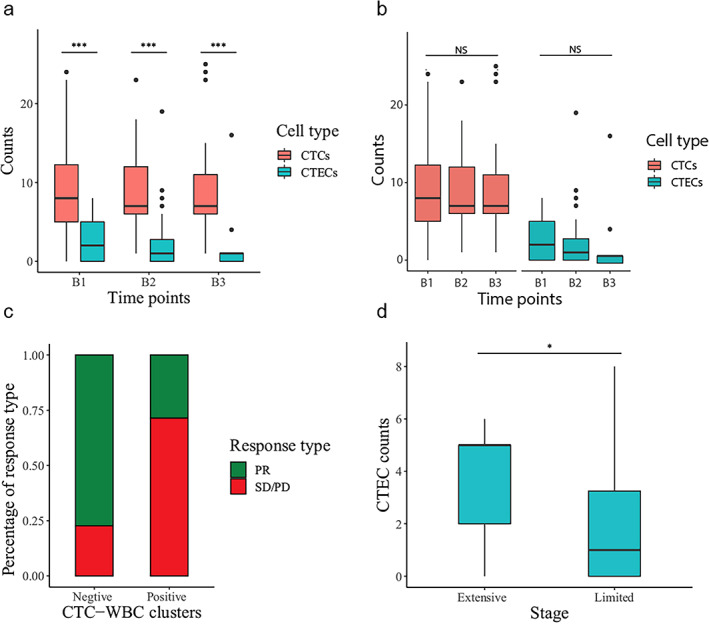
CTC/CTEC counts and their associations with clinicopathological factors (a, b). Comparison of CTC and CTEC levels before chemotherapy (B1), after two cycles of treatment (B2), and at the completion of chemotherapy (B3). (c) Fractions of partial response (PR) patients in CTC–WBC positive and negative groups. (d) Difference in CTEC counts in limited‐stage (LS) and extensive‐stage (ES) SCLC patients
The associations between the clinical characteristics and the CTC/CTEC counts and their subtypes were analyzed. The detection of CTC–WBC clusters in the blood samples correlated significantly with the therapeutic efficacy of the patients (p = 0.03024). Patients with CTC–WBC clusters were less likely to experience a remission of tumors (Figure 1c). Extensive‐stage (ES) SCLC patients tended to have a higher level of CTEC counts than LS SCLC patients (p = 0.03537, Figure 1d), whereas age, sex, smoking status, and performance status were not significantly associated with these cell counts.
Survival analysis
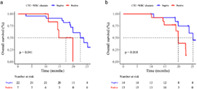
CTC–WBC clusters were detected in seven, 13, and four patients at the B1, B2, and B3 time points, respectively (Table 2). The detection of CTC–WBCs in the blood at the B1 and B2 time points demonstrated a prognostic value in SCLC patients. The median OS of patients without CTC–WBC detection was significantly longer than those CTC–WBC–positive patients both at baseline (17.3 vs. 22.6 months, p = 0.041, Figure 2a) and after two cycles of chemotherapy (19.9 vs. 25.2 months, p = 0.018, Figure 2b).
FIGURE 2.
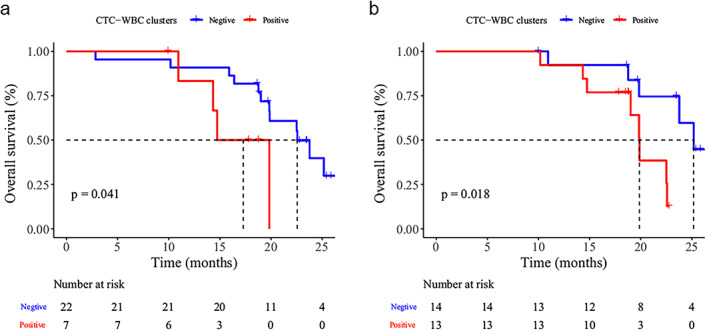
Survival analysis of SCLC patients before chemotherapy (a) and after two cycles of treatment (b). Kaplan–Meier curves for overall survival (OS) for patients with or without CTC–WBC clusters
An optimal prognostic CTC threshold correlating with OS at three time points was defined on the basis of maximally selected rank statistics. This method divided patients into a high post‐treatment group (≥12 CTCs) and a low post‐treatment group (<12 CTCs). The median PFS for patients with <12 CTCs was 22.5 months (N = 13), compared with 8.7 months (N = 4, p = 0.0026) for patients whose CTC counts ≥12 (Figure 3a). The median OS for patients with <12 CTCs was not reached (N = 13); comparatively, for patients with ≥12 CTCs, the median OS was 19 months (N = 4, p = 0.0086, Figure 3b). However, CTC counts at the B1 and B2time points did not show a significant discrimination in both OS and PFS.
FIGURE 3.
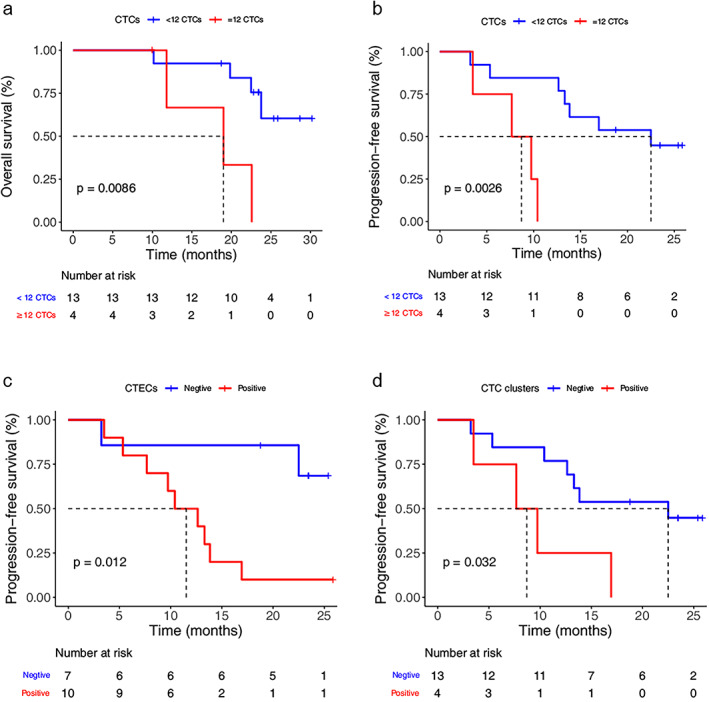
Survival analysis of SCLC patients at the completion of chemotherapy (a, b). Kaplan–Meier curves for OS and progression‐free survival (PFS) for patients with ≥12 CTCs and <12 CTCs. (c) Kaplan–Meier curves for PFS for patients with CTECs. (d) Kaplan–Meier curves for PFS for patients with CTC clusters
Furthermore, the detection of CTECs and CTC clusters after chemotherapy also predicted a higher risk of disease recurrence for SCLC patients. The median PFS for patients without CTEC detection was significantly longer than those with at least one CTEC detected (not reached vs. 11.5 months, p = 0.012, Figure 3c). CTC clusters were detected in four of 17 patients at the third time point. The presence of CTC clusters after chemotherapy demonstrated a significantly shorter PFS (8.7 months) compared with the absence of CTC clusters (22.5 months, p = 0.032, Figure 3d).
Univariate and multivariate Cox proportional hazards regression analysis
The results of the univariate analysis revealed that only sex (HR 3.6, 95% CI: 1–12, p = 0.043) was significantly associated with the PFS of SCLC patients (Table 3). Some factors were also associated with the OS of SCLC patients (Table 4), including sex (HR 6.5, 95% CI: 1.4–31, p = 0.017) and the detection of CTC–WBC clusters after two‐cycle chemotherapy (HR 4.5, 95% CI: 1.2–17, p = 0.03) as well as the detection of CTC–WBC clusters before chemotherapy with a slight statistical significance (HR 3.6, 95% CI: 1–13, p = 0.05). In the multivariable model, sex (HR 5.6, 95% CI: 1.2–27, p = 0.032) and the detection of CTC–WBC clusters both at baseline (HR 9.3, 95% CI: 1.4–48, p = 0.0079) and after two‐cycle chemotherapy (HR 4.4, 95% CI: 1.1–18, p = 0.041) were all independent predictors for the OS of SCLC patients (Table 4). However, no factor showed a significant association with PFS in the multivariate analysis (Table 3).
TABLE 3.
Univariate and multivariate analyses of progression‐free survival in SCLC patients
| Univariate analyses | Multivariate analyses | |||
|---|---|---|---|---|
| HR (95% CI) | p‐value | HR (95% CI) | p‐value | |
| Age | 1 (0.98–1.1) | 0.26 | ||
| Sex (male vs. female) | 3.6 (1–12) | 0.043* | 3.2 (0.93–11) | 0.064 |
| ECOG PS (1 vs. 0) | 0.67 (0.27–1.7) | 0.39 | ||
| TNM stage (IV/IIIB/IIIC vs. IIIA/IIB) | 3.1 (0.9–11) | 0.073# | 2.8 (0.79–9.8) | 0.110 |
| CTCs (B1) | 1 (0.96–1.1) | 0.63 | ||
| CTCs (B2) | 1 (0.98–1) | 0.84 | ||
| CTECs (B1, Pos vs. Neg) | 1.1 (0.94–1.3) | 0.23 | ||
| CTECs (B2, Pos vs. Neg) | 0.96 (0.89–1) | 0.32 | ||
| CTC clusters (B1, Pos vs. Neg) | 1.7 (0.5–6) | 0.39 | ||
| CTC clusters (B2, Pos vs. Neg) | 0.59 (0.19–1.8) | 0.35 | ||
| CTC–WBC clusters (B1, Pos vs. Neg) | 1.9 (0.66–5.2) | 0.24 | ||
| CTC–WBC clusters (B2, Pos vs. Neg) | 1.4 (0.52–3.5) | 0.53 | ||
Note: *p< 0.05; # p ≤ 0.1.
Abbreviations: B1, Baseline; B2, after two cycles of treatment; CTCs, circulating tumor cells; CTECs, circulating tumor endothelial cells; ECOG PS, Eastern Cooperative Oncology Group performance status; Neg, negative; Pos, positive; WBC, white blood cells.
TABLE 4.
Univariate and multivariate analyses of overall survival in SCLC patients
| Univariate analyses | Multivariate analyses | |||
|---|---|---|---|---|
| HR (95% CI) | p‐value | HR (95% CI) | p‐value | |
| Age | 1.1 (0.98–1.1) | 0.15 | ||
| Sex (male vs. female) | 6.5 (1.4–31) | 0.017* | 5.6 (1.2–27) | 0.032* |
| ECOG PS (1 vs. 0) | 0.75 (0.26–2.2) | 0.59 | ||
| TNM stage (IV/IIIB/IIIC vs. IIIA/IIB) | 2.5 (0.69–9) | 0.16 | ||
| CTCs (B1) | 1 (0.98–1.1) | 0.17 | ||
| CTCs (B2) | 1 (0.98–1) | 0.73 | ||
| CTECs (B1, Pos vs. Neg) | 1.1 (0.87–1.3) | 0.51 | ||
| CTECs (B2, Pos vs. Neg) | 0.94 (0.85–1.1) | 0.32 | ||
| CTC clusters (B1, Pos vs. Neg) | 1.8 (0.51–6.5) | 0.36 | ||
| CTC clusters (B2, Pos vs. Neg) | 1.2 (0.31–4.4) | 0.81 | ||
| CTC–WBC clusters (B1, Pos vs. Neg) | 3.6 (1–13) | 0.05# | 9.3 (1.8–48) | 0.0079* |
| CTC–WBC clusters (B2, Pos vs. Neg) | 4.5 (1.2–17) | 0.03* | 4.4 (1.1–18) | 0.041* |
Note: *p < 0.05; # p ≤ 0.1.
Abbreviations: B1, baseline; B2, after two cycles of treatment; CTCs, circulating tumor cells; CTECs, circulating tumor endothelial cells; ECOG PS, Eastern Cooperative Oncology Group performance status; Neg, negative; Pos, positive; WBC, white blood cells.
DISCUSSION
CTC detection is an indisputable cornerstone of liquid biopsy. It has advantages in clinical application as it is noninvasive and can overcome the heterogeneity problem of tissue biopsy, thus allowing for dynamic tumor monitoring and assisting treatment decisions for patients by convenient serial blood testing. 19 The most widely accepted technology for CTC research has been the CellSearch platform, which captures CTCs positively through immunoaffinity to an epithelial cell adhesion molecule (EpCAM) and has been approved for clinical application in advanced breast, colorectal, and prostate cancers. 20 Furthermore, CTC isolation can also be based on physical properties such as size and density. 20 In this study we applied a negative immunomagnetic enrichment method for CTC detection and enumeration, and CTCs were present in 97% of patients (32 of 33 patients) at baseline. Deng et al. detected CTCs in the blood samples of all 20 SCLC patients in their study prior to PCI by utilizing another similar negative selection technique. 10 By comparison, the previous percentage of CTC‐positive findings in SCLC was between 60% and 87% as reported by other investigators applying the CellSearch‐based approach. 6 , 7 , 8 , 9
In fact, it has been demonstrated that CTCs can be used as a prognostic reference indication for cancer patients including SCLC. Some studies based on CellSearch have revealed that SCLC patients with a higher CTC level before chemotherapy or concurrent chemoradiotherapy were prone to have a poorer prognosis. 6 , 7 , 8 , 9 Patients with CTC counts less than 12 at the completion of chemotherapy had a significantly lower risk of disease progression and death in our cohort. However, the CTC counts did not correlate to the prognostic survival of patients both at baseline and after two cycles of chemotherapy. This discrepancy may be due to the difference between the CTC‐enriching platforms. The recent study on the prognostic value of CTCs for SCLC patients receiving PCI after responding well to chemoradiotherapy using another negative enrichment platform for CTC detection showed similar results. 10 In addition, the relationship between the CTC reduction rate and prognosis of patients receiving PCI was also reported by this study. 10 Unfortunately, the CTC variation in our study was not a predictor of prognosis for patients because there was a limited number of patients that had matched blood samples both at baseline and the completion of chemotherapy.
PD‐L1 expression on CTECs could predict resistance to anti‐PD‐1 immunotherapy in NSCLC patients, and HER2 expression on CTCs has predicted resistance to trastuzumab‐targeted therapy in gastric cancer patients. 15 , 21 In addition, patients with biomarker‐positive CTCs in their circulation had worse prognoses than others in each study. However, because of the lack of therapeutic targets, antiapoptotic, cancer stem cells and epithelial to mesenchymal transition biomarker expression on CTCs did not reveal significant predictive or prognostic values for SCLC patients. 22 , 23 As seen with our results, CD44 and vimentin were rarely expressed on CTCs and CTECs in SCLC, and they had no relationship with the therapeutic efficacy and survival of patients.
CTCs usually exist as single cells but can also assemble to form clusters. In an elegant study performed by Aceto et al., 24 CTC clusters were found to have greater metastatic potential compared with single CTCs, despite their rarity in peripheral blood. Previously, Hou et al. had already reported that SCLC patients with the absence of CTC clusters at baseline had significantly improved PFS (8.2 vs. 4.6 months, p < 0.001) and OS (10.4 vs. 4.3 months, p < 0.001) compared with those with the presence of CTC clusters. 6 Our study further proved that SCLC patients with detectable CTC clusters after completing chemotherapy treatment may have a greater risk of recurrence. The study by Gkountela et al. indicated that CTC clusters obtained stem cell biology through epigenetic modifications, which is reversible in the process of CTC aggregation and separation. 25
Furthermore, CTCs were occasionally observed to travel with WBCs. There is mounting evidence that neutrophils have a crucial role in cancer metastasis. Neutrophils not only facilitate an escape from attack by immune cells and invasion in distant tissue of cancer cells, but also support CTC survival in circulation by promoting the cell cycle. 11 , 26 Aceto and his colleagues conducted another study to analyze blood samples of 70 metastatic breast cancer patients and five mouse models with detectable CTC clusters and CTC–WBC clusters were detected in 8.6% and 3.4% of 34 patients with CTCs in circulation, respectively. 11 The researchers found that both patients and mouse models with CTC–WBC clusters had a lower survival rate compared with those with only CTCs (no WBCs). 11 Luo et al. also found CTC–WBC clusters in hepatocellular carcinoma patients before surgery. 27 The five‐year survival rates of the CTC–WBC cluster–positive group and –negative group were 17.9% and 70.0% (p < 0.001), respectively. 27 Similarly, the CTC–WBC clusters detected in the peripheral blood of SCLC in the present study were associated with shorter OS at baseline and after two‐cycle chemotherapy, which was the only prognostic biomarker at the former two time points.
In conclusion, the key findings suggest that high post‐treatment CTC counts in circulation is a valuable indicator of poor survival for SCLC patients. These findings complement previous studies that were mainly focused on the prognostic value of pretreatment CTC levels. More importantly, the present study demonstrated the presence of CTC–WBC clusters and their prognostic significance for the first time in SCLC patients. CTC–WBC clusters in peripheral blood at baseline and during chemotherapy can serve as independent predictors for the prognosis of patients. It should be noted, however, that the reliability of these new findings is limited due to the small sample size of the cohort, and larger‐scale prospective studies are needed to draw more definitive conclusions.
CONFLICT OF INTEREST
None.
ACKNOWLEDGMENT
This study was supported in part by grants from CAMS Innovation Fund for Medical Sciences (CIFMS), Grant/Award Number: 2016‐I2M‐1‐001.
Zhu H‐H, Liu Y‐T, Feng Y, Zhang L‐N, Zhang T‐M, Dong G‐L, et al. Circulating tumor cells (CTCs)/circulating tumor endothelial cells (CTECs) and their subtypes in small cell lung cancer: Predictors for response and prognosis. Thorac Cancer. 2021;12:2749–2757. 10.1111/1759-7714.14120
Funding information CAMS Innovation Fund for Medical Sciences (CIFMS), Grant/Award Number: 2016‐I2M‐1‐001
Contributor Information
Yuan‐Kai Shi, Email: syuankai@cicams.ac.cn.
Xing‐Sheng Hu, Email: huxingsheng66@163.com.
REFERENCES
- 1. Rudin CM, Brambilla E, Faivre‐Finn C, Sage J. Small‐cell lung cancer. Nat Rev Dis Primers. 2021;7:3. [DOI] [PMC free article] [PubMed] [Google Scholar]
- 2. Nicholson AG, Chansky K, Crowley J, Beyruti R, Kubota K, Turrisi A, et al. The International Association for the Study of Lung Cancer lung cancer staging project: proposals for the revision of the clinical and pathologic staging of small cell lung cancer in the forthcoming eighth edition of the TNM classification for lung cancer. J Thorac Oncol. 2016;11:300–11. [DOI] [PubMed] [Google Scholar]
- 3. Wang S, Zimmermann S, Parikh K, Mansfield AS, Adjei AA. Current diagnosis and management of small‐cell lung cancer. Mayo Clin Proc. 2019;94:1599–622. [DOI] [PubMed] [Google Scholar]
- 4. Massagué J, Obenauf AC. Metastatic colonization by circulating tumour cells. Nature. 2016;529:298–306. [DOI] [PMC free article] [PubMed] [Google Scholar]
- 5. Hou J‐M, Greystoke A, Lancashire L, Cummings J, Ward T, Board R, et al. Evaluation of circulating tumor cells and serological cell death biomarkers in small cell lung cancer patients undergoing chemotherapy. Am J Pathol. 2009;175:808–16. [DOI] [PMC free article] [PubMed] [Google Scholar]
- 6. Hou J‐M, Krebs MG, Lancashire L, Sloane R, Backen A, Swain RK, et al. Clinical significance and molecular characteristics of circulating tumor cells and circulating tumor microemboli in patients with small‐cell lung cancer. J Clin Oncol. 2012;30:525–32. [DOI] [PubMed] [Google Scholar]
- 7. Hiltermann TJN, Pore MM, van den Berg A, Timens W, Boezen HM, Liesker JJ, et al. Circulating tumor cells in small‐cell lung cancer: a predictive and prognostic factor. Ann Oncol. 2012;23:2937–42. [DOI] [PubMed] [Google Scholar]
- 8. Cheng Y, Liu X‐Q, Fan Y, Liu YP, Liu Y, Liu Y, et al. Circulating tumor cell counts/change for outcome prediction in patients with extensive‐stage small‐cell lung cancer. Future Oncol. 2016;12:789–99. [DOI] [PubMed] [Google Scholar]
- 9. Tay RY, Fernández‐Gutiérrez F, Foy V, Burns K, Pierce J, Morris K, et al. Prognostic value of circulating tumour cells in limited‐stage small‐cell lung cancer: analysis of the concurrent once‐daily versus twice‐daily radiotherapy (CONVERT) randomised controlled trial. Ann Oncol. 2019;30:1114–20. [DOI] [PMC free article] [PubMed] [Google Scholar]
- 10. Deng L, Zhang Y, Zhang W, Feng L, Zhang K, Wang W, et al. Prospective exploratory study of the clinical significance of circulating tumor cells in patients with small cell lung cancer exposed to prophylactic cranial irradiation. Front Oncol. 2020;10:575394. [DOI] [PMC free article] [PubMed] [Google Scholar]
- 11. Szczerba BM, Castro‐Giner F, Vetter M, Krol I, Gkountela S, Landin J, et al. Neutrophils escort circulating tumour cells to enable cell cycle progression. Nature. 2019;566:553–7. [DOI] [PubMed] [Google Scholar]
- 12. Lin PP. Aneuploid circulating tumor‐derived endothelial cell (CTEC): a novel versatile player in tumor neovascularization and cancer metastasis. Cell. 2020;9(6):1539. [DOI] [PMC free article] [PubMed] [Google Scholar]
- 13. Cima I, Kong SL, Sengupta D, Tan IB, Phyo WM, Lee D, et al. Tumor‐derived circulating endothelial cell clusters in colorectal cancer. Sci Transl Med. 2016;8:345ra89. [DOI] [PubMed] [Google Scholar]
- 14. Mehran R, Nilsson M, Khajavi M, Du Z, Cascone T, Wu HK, et al. Tumor endothelial markers define novel subsets of cancer‐specific circulating endothelial cells associated with antitumor efficacy. Cancer Res. 2014;74:2731–41. [DOI] [PMC free article] [PubMed] [Google Scholar]
- 15. Zhang L, Zhang X, Liu Y, Zhang T, Wang Z, Gu M, et al. PD‐L1+ aneuploid circulating tumor endothelial cells (CTECs) exhibit resistance to the checkpoint blockade immunotherapy in advanced NSCLC patients. Cancer Lett. 2020;469:355–66. [DOI] [PubMed] [Google Scholar]
- 16. Eisenhauer EA, Therasse P, Bogaerts J, Schwartz LH, Sargent D, Ford R, et al. New response evaluation criteria in solid tumours: revised RECIST guideline (version 1.1). Eur J Cancer. 2009;45:228–47. [DOI] [PubMed] [Google Scholar]
- 17. Lin PP, Gires O, Wang DD, Li L. Wang H Comprehensive in situ co‐detection of aneuploid circulating endothelial and tumor cells. Sci Rep. 2017;7:9789. [DOI] [PMC free article] [PubMed] [Google Scholar]
- 18. Hothorn T, Lausen B. Maximally selected rank statistics in R. R News. 2002;2:3–5. [Google Scholar]
- 19. Zhong X, Zhang H, Zhu Y, Liang Y, Yuan Z, Li J, et al. Circulating tumor cells in cancer patients: developments and clinical applications for immunotherapy. Mol Cancer. 2020;19:15. [DOI] [PMC free article] [PubMed] [Google Scholar]
- 20. Bankó P, Lee SY, Nagygyörgy V, Zrínyi M, Chae CH, Cho DH, et al. Technologies for circulating tumor cell separation from whole blood. J Hematol Oncol. 2019;12:48. [DOI] [PMC free article] [PubMed] [Google Scholar]
- 21. Li Y, Zhang X, Liu D, Gong J, Wang DD, Li S, et al. Evolutionary expression of HER2 conferred by chromosome aneuploidy on circulating gastric cancer cells contributes to developing targeted and chemotherapeutic resistance. Clin Cancer Res. 2018;24:5261–71. [DOI] [PubMed] [Google Scholar]
- 22. Pore M, Meijer C, de Bock GH, Boersma‐van Ek W, Terstappen LW, Groen HJ, et al. Cancer stem cells, epithelial to mesenchymal markers, and circulating tumor cells in small cell lung cancer. Clin Lung Cancer. 2016;17:535–42. [DOI] [PubMed] [Google Scholar]
- 23. Messaritakis I, Nikolaou M, Politaki E, Koinis F, Lagoudaki E, Koutsopoulos A, et al. Bcl‐2 expression in circulating tumor cells (CTCs) of patients with small cell lung cancer (SCLC) receiving front‐line treatment. Lung Cancer. 2018;124:270–8. [DOI] [PubMed] [Google Scholar]
- 24. Aceto N, Bardia A, Miyamoto DT, Donaldson MC, Wittner BS, Spencer JA, et al. Circulating tumor cell clusters are oligoclonal precursors of breast cancer metastasis. Cell. 2014;158:1110–22. [DOI] [PMC free article] [PubMed] [Google Scholar]
- 25. Gkountela S, Castro‐Giner F, Szczerba BM, Vetter M, Landin J, Scherrer R, et al. Circulating tumor cell clustering shapes DNA methylation to enable metastasis seeding. Cell. 2019;176:98–112.e14. [DOI] [PMC free article] [PubMed] [Google Scholar]
- 26. Coffelt SB, Wellenstein MD, de Visser KE. Neutrophils in cancer: neutral no more. Nat Rev Cancer. 2016;16:431–46. [DOI] [PubMed] [Google Scholar]
- 27. Luo Q, Wang C, Peng B, Pu X, Cai L, Liao H, et al. Circulating tumor‐cell‐associated white blood cell clusters in peripheral blood indicate poor prognosis in patients with hepatocellular carcinoma. Front Oncol. 2020;10:1758. [DOI] [PMC free article] [PubMed] [Google Scholar]