Abstract
Background/Aims
Integrated relaxation pressure (IRP) is an important metric for functional evaluation of the lower esophageal sphincter. However, the effectiveness of IRP for evaluation of upper esophageal sphincter (UES) function has not yet been clarified.
Methods
High-resolution manometry (HRM) was performed in 180 patients with dysphagia. For comparison, 26 asymptomatic subjects were also recruited. IRP of the UES was defined as means of 0.2, 0.25, or 0.3 seconds (sIRPs) of maximal deglutitive relaxation in a 0.4-second window (a new equation for IRP calculation was developed using MATLAB). Also, the relaxation time interval of the UES, and mesopharyngeal and hypopharyngeal contractility (as a contractile integral) were evaluated using HRM.
Results
In normal subjects, mean values of 0.2, 0.25, and 0.3 sIRPs differed significantly from each other (P < 0.05). They were not associated with the relaxation time interval of the UES. In contrast, in patients with dysphagia, mean values of 0.2, 0.25, and 0.3 sIRPs were strongly related to relaxation time intervals of the UES (P < 0.05), and mean values of 0.2, 0.25, and 0.3 sIRPs in patients with aspiration were significantly higher than those of patients without aspiration (P < 0.01). However, in multivariate regression analyses, the main risk factor for aspiration was only a shorter relaxation time interval.
Conclusions
IRP values were significantly higher in patients with dysphagia and aspiration. However, its usefulness as a predictive factor for aspiration was less than the relaxation time interval of the UES.
Keywords: Deglutition disorders, Hypopharynx, Manometry, Prognosis, Upper esophageal sphincter
Introduction
Aspiration pneumonia is a serious disease for the elderly, leading to hospitalization, significant economic cost, and sometimes death. It accounts for 6% of patients with community-acquired pneumonia requiring hospitalization and can reach 10% for patients over 80 years old.1 Nursing home residents and particularly vulnerable people are at the highest risk for pneumonia, have a 10-fold higher incidence, and higher mortality rates than normal elderly people.2
Several important risk factors for aspiration pneumonia in older people have been demonstrated: age, male, dementia, Parkinson’s disease, cerebrovascular diseases, diabetes mellitus, malnutrition, bad oral health, heart failure, angiotensin I-converting enzyme deletion/deletion genotype, specific medications (proton pump inhibitors and antipsychotics), smoking, and dysphagia.3 Among these factors, dysphagia from neurologic diseases (dementia, Parkinson’s disease, and others) is considered the most important risk factor for aspiration pneumonia in elder people.4
In our previous studies, 2 parameters of high-resolution manometry (HRM), including velopharyngeal (VP) maximal pressure and relaxation duration of the upper esophageal sphincter (UES), were identified as crucial parameters for determining feeding methods in patients with oropharyngeal dysphagia. Furthermore, these metrics were found to be significant predictors for the development of aspiration pneumonia.5
In addition, integrated relaxation pressure (IRP) has been suggested to be an important HRM parameter for the evaluation of oropharyngeal dysphagia.6 IRP is a metric that measures the deglutitive intra-sphincteric intrabolus pressure and indicates the completeness of UES relaxation and sphincter compliance.
In fact, IRP is a very important metric of HRM in the diagnosis of esophageal motility disease, and defined as a mean of the 4-second pressures (non-contiguous) of maximal deglutitive relaxation in a 10-second period, beginning at UES relaxation.7 To obtain the IRP for the UES based on this definition, it was necessary to establish the reference value of the key elements of the IRP value, including the window period (actual UES relaxation period) and the time interval used to obtain average values. In a previous study, only IRP values for 0.2-second periods were determined for UES functional evaluation.8 However, the basis for obtaining IRP values for a period of 0.2 seconds is unclear, and in patients with oropharyngeal dysphagia, the length of the UES is usually very short, so it is difficult to measure the IRP throughout the entire length of the UES in these patients. Therefore, the aim of this study is to determine the reference value of key elements of the IRP, and to determine the best predictor of aspiration among risk factors, including IRP.
Materials and Methods
Participants
From November 1, 2012 to September 30, 2017, 184 patients with dysphagia (133 men and 51 women) were adopted. Of the 184 patients, 170 patients who met our qualification criteria were recruited in this study. Past history and comorbidity of patients were checked. Patients with at least 1 of the following criteria were recruited: (1) symptoms associated with oropharyngeal dysphagia, such as coughing, choking, or drooling; (2) objective signs of dysphagia, including wet breath and gurgling sounds while eating or drinking, lack of tongue movement, gag reflex, and laryngeal elevation or vocal cord paralysis; and (3) patients considered for withdrawing feeding tube after an acute period of stroke. Exclusion criteria were as follows: (1) active cardiac, pulmonary, and other severe medical conditions; (2) hyperacute period of stroke; and (3) transient ischemic attack. The study protocol was approved by the Institutional Review Board (IRB No. (2013-01-178) and informed consent was get from each subject.
High-resolution Manometry
A solid-state manometric device with 36 circumferential sensors spaced at 1 cm apart (4.2 mm outer diameter) was used (Given Imaging, Los Angeles, CA, USA). Before recording, calibration of transducers were done at 0 and 300 mmHg using external pressure. After confirming that the subject had no symptoms of digestion and performing anthropometric measurements, a manometric device was inserted through the patient’s nose. The test was performed after at least 8 hours of fasting. Two percent lidocaine was used to anesthetize the nasal cavity, and the change in pressure from the pharynx to the UES was recorded using an inserted manometric catheter. The manometric protocol included a 5-minute period to evaluate the basal UES pressure resulting from 5 swallows of 5 mL water. The swallows were stopped if pharyngeal contraction was extremely delayed after starting the swallow.
Videofluoroscopic Swallowing Study
The test was performed in a sitting position. The lateral view of swallowing 5 mL of water with small amount of barium was recorded with a C-arm videofluoroscope (ZEN-2060, Genoray Co, Seongnam, Korea). A rehabilitation doctor who did not know the patient’s condition analyzed the videofluoroscopic swallowing study (VFSS) results. Abnormal findings in the VFSS results included vallecular residue, pyriform sinus residue, penetration, and aspiration. Vallecular and pyriform sinus residues were graded as follows: grade 0, no residue; grade 1, less than 10% of the height of the vallecula or pyriform sinus in VFSS imaging; grade 2, from 10% to 50%; and grade 3, above 50%. Grade 0 was defined as no residue. Penetration was defined by residue that reached but did not pass through the glottis. Aspiration was defined as follows: (1) visible residue below the glottis reversed by reflex coughing; (2) small amounts of residue through the main airway, but not detected on chest X-ray; or (3) large amounts of residue through the main airway also detected on chest X-ray.
Data Analysis of Manometric Evaluation
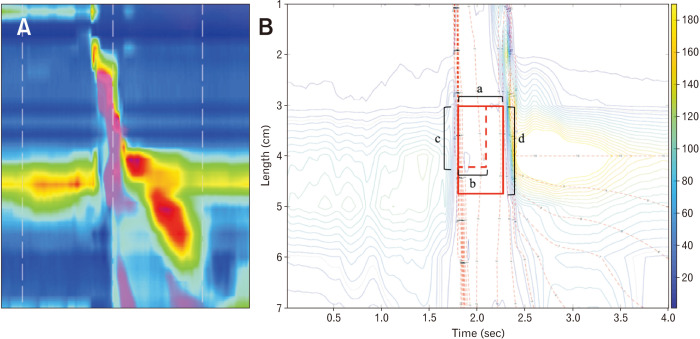
We tried to get the IRP value that best predicted aspiration and was most closely related to abnormal findings of VFSS in dysphagia patients. To obtain the IRP value that best reflects the UES relaxation disturbance, the time window beginning at UES relaxation (correlating to a 10-second window at LES), the time interval to determine the IRP value (correlating to a 4sIRP at LES), and thickness of the UES were determined (Fig. 1).
Figure 1.
Manoview and isobaric contour image generated from binary manometric data. (A) Manoview image of 5 mL water swallow. (B) Isobaric contour generated from MATLAB program. Integrated relaxation pressure of upper esophageal sphincter (UES) is defined as mean of the pressures during specific time interval of maximal deglutitive relaxation in specific time window beginning at UES relaxation, and the types of variables that must be set for calculation are the time window beginning at UES relaxation [a] correlating to a 10-second window at lower esophageal sphincter (LES), the time interval [b] (dotted horizontal, red line; correlating to a 4-second IRP at LES), and the thickness of UES; distance between 2 sensors [c] (dotted vertical, red line); and 3 sensors [d] (linear vertical, red line).
At first, the time window for IRP was set to the lowest value, 0.5 seconds. This can be related to the “0.5-second window beginning at LES relaxation” in the definition of IRP at UES. Secondly, 3 different IRP values (0.2, 0.25, and 0.3 seconds) were calculated and correlated with the aspiration evaluation conducted with VFSS to get the most appropriate time interval for IRP. Lastly, the thickness of the UES that could best predict aspiration in VFSS for IRP values was determined. Most of the patients with dysphagia are older, and their resting UES value is decreased. Therefore, when the IRP value is calculated by applying a general esophageal thickness of 3-4 cm, it can reflect the pressure change in the non-UES region. Thus, the IRP value was obtained by dividing the UES thickness by 2 cm and 3 cm (2 and 3 sensors) in an attempt to find the appropriate thickness for the IRP value.
In addition to IRP, 4 essential metrics of HRM were compared between patients with and without aspiration by the method used in a previous study.9 The method used (1) basal pressure of the UES, (2) mesopharyngeal contractile integral (mesopharyngeal CI, mmHg·sec·cm), (3) CI of the hypopharynx and UES (hypopharyngeal CI), and (4) relaxation time interval of the UES (seconds). Basal pressure of the UES was defined as the mean UES pressure calculated as the average of the inspiratory and expiratory values.10 Mesopharyngeal and hypopharyngeal CIs were calculated by amplitude × duration × length (mmHg·sec·cm) of muscular contractions ≥ 70 mmHg. The relaxation time interval was defined as the duration of time from onset at the point of departure from half the baseline to offset of the return to half-baseline pressure.11 Manometric data were analyzed using MATLAB (MathWorks; Natick, MA, USA).
Statistical Methods
All data are expressed as mean ± standard deviation. We evaluated the correlation between the mean value of HRM and the results of VFSS.
Comparison between IRP values, based on different time intervals and UES thicknesses, was performed via one-way analysis of variance and paired Student’s t tests. Correlations between HRM parameters were calculated using Pearson correlation analysis. Comparisons of HRM metrics between participants with normal and abnormal outcomes in VFSS were made by Student’s t tests. Predictive factors for aspiration were determined using univariate logistic regression analyses, and subsequent multivariate logistic regression analyses to adjust for confounding variables. The significance level was P < 0.05, and all analyses were performed using SPSS version 18 (IBM, Armonk, NY, USA).
Results
Demographic Characteristics of Participants
HRM and VFSS were performed in 180 patients with dysphagia from November 1, 2012, to September 30, 2017. The mean age was 69.9 ± 12.1 years, and 71.2 % were male. Underlying diseases and conditions included 109 patients with a neurological history (79 stroke, 2 multiple sclerosis, 11 Parkinson’s disease, 3 cervical cord injuries, 1 encephalitis, 2 Guillain–Barré syndrome, 7 dementia, 1 bilateral superior laryngeal neuropathy, 1 hypoglossal nerve injury, 2 vocal cord palsies, and 2 Kennedy disease patients). Six patients had an oropharyngeal tumor. Thirty-eight patients had pneumonia. Three patients had esophageal cancer, and 2 patients had esophageal motility disorders (distal esophageal spasm). Two patients had posterior cervical spine surgery. One patient had a foreign body in the throat. The cause of dysphagia was unknown in 19 patients. For comparison, 26 healthy subjects were also recruited. The mean age was 42.5 ± 18.7 years and 46.1% were male.
Comparison Between Integrated Relaxation Pressure Values Based on Different Time Intervals and Upper Esophageal Sphincter Thickness in Healthy Subjects
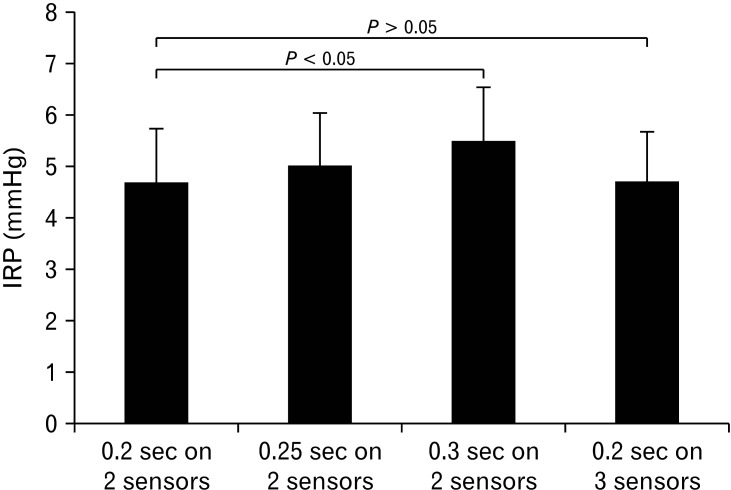
Mean values of 0.2, 0.25, and 0.3 sIRPs were significantly different from each other (P < 0.05; Fig. 2). However, the difference between the mean values of 0.2sIRP determined by 2 sensors and 3 sensors was not significant (P > 0.05; Fig. 2).
Figure 2.
Comparison between integrated relaxation pressure (IRP) values based on different time intervals and upper esophageal sphincter thickness in healthy subjects. Mean values of 0.2-, 0.25-, and 0.3-second IRP were significantly different from each other (P < 0.05).
Comparison Between Integrated Relaxation Pressure Values With and Without Aspiration in Patients With Dysphagia
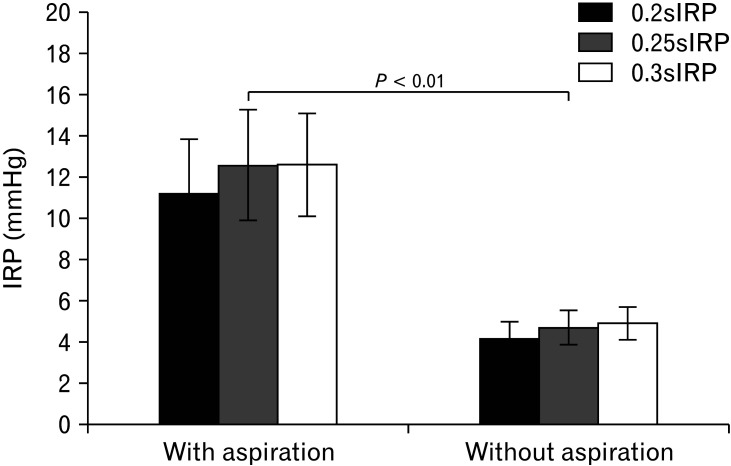
Increased values of 0.2, 0.25, and 0.3 sIRPs were notably related to residues in the vallecula and pyriform sinuses (P < 0.05; Table 1). Also, mean values of 0.2, 0.25, and 0.3 sIRPs in 41 patients with aspiration were significantly greater than those of patients without aspiration (P < 0.01; Fig. 3).
Table 1.
Relationship Between 0.2-, 0.25-, and 0.3-second Integrated Relaxation Pressure and Age, Gender, and Abnormal Findings of Videofluoroscopic Swallowing Study
| Variables | 0.2sIRP | 0.25sIRP | 0.3sIRP |
|---|---|---|---|
| Aspiration | |||
| r | 0.267 | 0.276 | 0.295 |
| P | 0.001 | 0.001 | 0.000 |
| Penetration | |||
| r | 0.168 | 0.154 | 0.143 |
| P | 0.047 | 0.069 | 0.091 |
| Vallecular residue | |||
| r | 0.203 | 0.216 | 0.194 |
| P | 0.014 | 0.009 | 0.019 |
| Pyriform sinus residue | |||
| r | 0.245 | 0.252 | 0.219 |
| P | 0.003 | 0.002 | 0.008 |
| Gender | |||
| r | –0.018 | –0.010 | –0.024 |
| P | 0.814 | 0.891 | 0.748 |
| Age | |||
| r | –0.001 | 0.009 | –0.017 |
| P | 0.990 | 0.905 | 0.822 |
r, Pearson correlation analysis.
0.2sIRP, 0.2 second integrated relaxation pressure.
Figure 3.
Comparison of integrated relaxation pressure (IRP) values with and without aspiration in patients with dysphagia. Mean values of 0.2-, 0.25-, and 0.3-second IRP (0.2sIRP, 0.25sIRP, and 0.3sIRP) of patients with aspiration were significantly greater than those of patients without aspiration (P < 0.01).
Relationship Between Integrated Relaxation Pressure Values and Relaxation Time Interval of the Upper Esophageal Sphincter
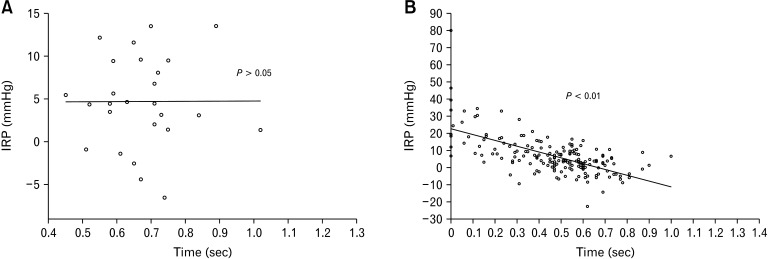
IRP values were not associated with relaxation time intervals of the UES in healthy subjects (P > 0.05; Fig. 4A). In contrast, in patients with dysphagia, mean values of 0.2, 0.25, and 0.3 sIRPs were significantly associated with relaxation time intervals of the UES (P < 0.05; Fig. 4B).
Figure 4.
Relationship between integrated relaxation pressure (IRP) values and relaxation time interval of upper esophageal sphincter (UES). In patients with dysphagia, mean values of 0.2-, 0.25-, and 0.3-second IRP were significantly associated with relaxation time interval of UES (P < 0.05; 4B) but not in healthy subjects (P > 0.05; 4A).
Determination of Predictive Factors for Aspiration
When multivariate analysis was performed except UES relaxation time, 0.3sIRP was the best predictor of aspiration among the 3 IRP values (0.2, 0.25, and 0.3 sIRPs). However, given all the variables for aspiration, only shorter relaxation time interval turned out to be the main risk factor (Table 2).
Table 2.
Determination of Risk Factors for Aspiration by Univariate and Multivariate Logistic Regression Analysis
| Variables | Univariate | Multivariate | |||
|---|---|---|---|---|---|
| OR (95% CI) | P-value | OR (95% CI) | P-value | ||
| 0.2sIRP | 1.053 (1.014-1.093) | 0.007 | |||
| 0.25sIRP | 1.050 (1.014-1.088) | 0.006 | |||
| 0.3sIRP | 1.063 (1.024-1.103) | 0.001 | 1.036 (0.986-1.089) | 0.157 | |
| Velopharyngeal maximal pressure | 0.998 (0.992-1.003) | 0.413 | |||
| Age (yr) | 1.023 (0.991-1.057) | 0.166 | 1.037 (1.000-1.076) | 0.051 | |
| Relaxation time interval of UES | 0.037 (0.006-0.233) | < 0.001 | 0.076 (0.006-0.987) | 0.049 | |
0.2sIRP, 0.2-second integrated relaxation pressure; UES, upper esophageal sphincter.
Discussion
This study was conducted to determine the IRP value that best reflects the risk of aspiration in patients complaining of oropharyngeal dysphagia. For this, 0.2, 0.25, and 0.3 sIRPs were compared with each other, and 0.3sIRP was most closely related to the presence of VFSS abnormalities, including aspiration.
Previous studies had used 0.2 seconds as the time interval for IRP values of the UES.8 This value was chosen because it was a significantly shorter interval than the lower limit during UES relaxation time and could exclude any interference of the resting pressure of the UES. The interval chosen, however, was not the result of research conducted to define the specific IRP window that optimally discriminated abnormal from normal UES relaxation. Thus, this study was the first to demonstrate the usefulness of 0.3sIRP as a risk factor for aspiration.
Considering the range of average UES relaxation times (0.59-0.73 seconds) and the lower limit of UES relaxation time intervals (0.46 seconds) predictive of aspiration, the IRP time window should be included in all UES relaxation time intervals of healthy subjects, and should be greater than the value that can indicate abnormal findings, 0.46 seconds. As a result, IRP time windows should be 0.5, 0.6, or 0.7 seconds. Moreover, the purpose of IRP values is to evaluate the patient’s dysphagia with shortened UES relaxation times. Therefore, the time window beginning at UES relaxation was set to the lowest value, 0.5 seconds.
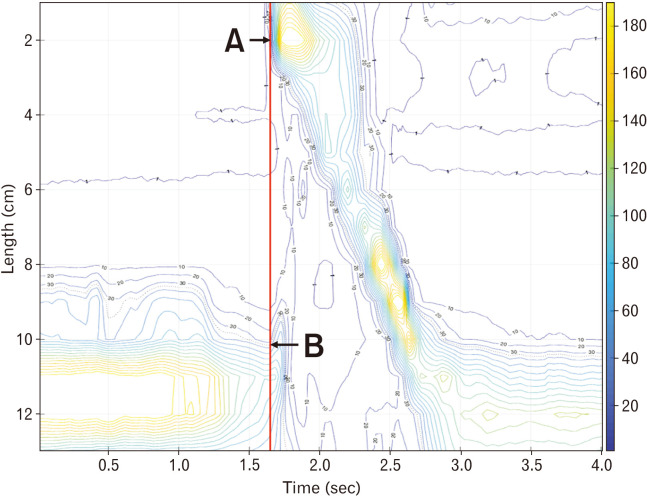
When the contractility of UES and hypopharynx during deglutition was too low (< 35 mmHg) in patients with dysphagia, it was difficult to determine the starting point of IRP at the UES. These patients were divided into 2 types: those where mesopharyngeal contraction was sustained to some extent, and those where mesopharyngeal and UES and hypopharyngeal contractility decreased together. In the first case, the starting point of the UES relaxation period was determined to be the initial contraction time of the mesopharynx, when 35 mmHg was used as a reference value. Mesopharyngeal contraction is a critical factor in the development of aspiration, and in our preliminary study of normal subjects, we confirmed that the starting point of the mesopharyngeal contraction, based on 35 mmHg, was consistent with the beginning of UES relaxation, ie, the beginning of UES elevation (Fig. 5). If the mesopharyngeal contractility was reduced simultaneously with UES and hypopharyngeal contractility, the starting point of the IRP value was calculated based on the half-pressure of the resting UES pressure.
Figure 5.
Estimation of the beginning of upper esophageal sphincter (UES) relaxation using the mesopharyngeal contraction. The starting point of the mesopharyngeal contraction based on the 35 mmHg was consistent with the beginning of UES elevation. (A) Starting point of the mesopharyngeal contraction based on 35 mmHg. (B) The beginning of UES relaxation.
In the analysis of the HRM values of the mesopharyngeal and UES areas, besides the time window, another important factor in UES relaxation time is the number of sensors included in the UES. Because the UES has an average length of 3 cm to 4 cm,12 3 sensors were needed to measure the pressure in this area. However, when the HRM results of dysphagia patients were analyzed, the length of the UES pressure zone was often shorter than 3 cm, and pressure values other than UES could be included when using 3 sensors for these patients. That is why we compared the IRP values of healthy subjects estimated using 2 and 3 sensors in the UES longitudinal direction. As a result, the IRP values of the 2 groups were not significantly different from those of normal subjects. This may be because the upper part of the UES showed a relatively higher pressure than the lower part, and based on this, IRP values of the UES can be obtained using 2 upper sensors on the longitudinal side.
In previous studies, VP pressure was one of the important predictive factors for oral feeding.5 However, in this study, UES relaxation time alone proved to be a significant risk factor for aspiration. There are 2 possible explanations for this difference. First, previous studies were based on patients’ actual intake of food. In contrast, the results of this study were obtained from physiologic tests using 5 mL of water. Second, 0.3sIRP value may act as variables in multivariate analysis and may have affected the outcome of VP pressure. Based on these results, we suggest that the UES relaxation time interval is more reflective of the lack of coordination between pharyngeal contraction and UES relaxation.
Interestingly, in patients with dysphagia, mean 0.2, 0.25, and 0.3sIRP were significantly associated with the relaxation time interval of UES, but not in healthy subjects. This is because dysphagia patients have remarkably high IRP values due to resistance when the UES relaxation time interval is significantly reduced. In addition, if the UES relaxation time interval is normal and the mesopharyngeal contractility is slightly reduced, the IRP value could be a negative because the patient performs forceful swallowing. As the IRP value changes according to the UES relaxation time interval in this way, it is thought that there is a significant correlation between the 2 factors.
In conclusion, IRP values were significantly higher in patients with dysphagia and aspiration. However, the usefulness of IRP values as a predictor for aspiration was smaller than the relaxation time interval of the UES.
Footnotes
Financial support: None.
Conflicts of interest: None.
Author contributions: Jung Ho Park conceived of the presented idea; Jung Ho Park and Jung Hwan Park developed the theory and performed the computations; and Chong-Il Sohn and Kyung Jae Yoon verified the analytical methods. All authors discussed the results and contributed to the final manuscript.
References
- 1.Fernández-Sabé N, Carratalà J, Rosón B, et al. Community-acquired pneumonia in very elderly patients: causative organisms, clinical characteristics, and outcomes. Medicine. 2003;82:159–169. doi: 10.1097/01.md.0000076005.64510.87. [DOI] [PubMed] [Google Scholar]
- 2.Quagliarello V, Ginter S, Han L, Van Ness P, Allore H, Tinetti M. Modifiable risk factors for nursing home-acquired pneumonia. Clin Infect Dis. 2005;40:1–6. doi: 10.1086/426023. [DOI] [PubMed] [Google Scholar]
- 3.van der Maarel-Wierink CD, Vanobbergen JN, Bronkhorst EM, Schols JM, de Baat C. Risk factors for aspiration pneumonia in frail older people: a systematic literature review. J Am Med Dir Assoc. 2011;12:344–354. doi: 10.1016/j.jamda.2010.12.099. [DOI] [PubMed] [Google Scholar]
- 4.DiBardino DM, Wunderink RG. Aspiration pneumonia: a review of modern trends. J Crit Care. 2015;30:40–48. doi: 10.1016/j.jcrc.2014.07.011. [DOI] [PubMed] [Google Scholar]
- 5.Park CH, Lee YT, Yi Y, Lee JS, Park JH, Yoon KJ. Ability of high-resolution manometry to determine feeding method and to predict aspiration pneumonia in patients with dysphagia. Am J Gastroenterol. 2017;112:1074–1083. doi: 10.1038/ajg.2017.81. [DOI] [PubMed] [Google Scholar]
- 6.Nativ-Zeltzer N, Logemann JA, Zecker SG, Kahrilas PJ. Pressure topography metrics for high-resolution pharyngeal-esophageal manofluorography-a normative study of younger and older adults. Neurogastroenterol Motil. 2016;28:721–731. doi: 10.1111/nmo.12769. [DOI] [PMC free article] [PubMed] [Google Scholar]
- 7.Kahrilas P, Bredenoord A, Fox M, et al. The Chicago classification of esophageal motility disorders, v3.0. Neurogastroenterol Motil. 2015;27:160–174. doi: 10.1111/nmo.12477. [DOI] [PMC free article] [PubMed] [Google Scholar]
- 8.Weijenborg PW, Kessing BF, Smout AJ, Bredenoord AJ. Normal values for solid-state esophageal high-resolution manometry in a European population; an overview of all current metrics. Neurogastroenterol Motil. 2014;26:654–659. doi: 10.1111/nmo.12314. [DOI] [PubMed] [Google Scholar]
- 9.Lee T, Park JH, Cohn C, et al. Failed deglutitive upper esophageal sphincter relaxation is a risk factor for aspiration in stroke patients with oropharyngeal dysphagia. J Neurogastroenterol Motil. 2017;23:34–40. doi: 10.5056/jnm16028. [DOI] [PMC free article] [PubMed] [Google Scholar]
- 10.Kwiatek MA, Mirza F, Kahrilas PJ, Pandolfino JE. Hyperdynamic upper esophageal sphincter pressure: a manometric observation in patients reporting globus sensation. Am J Gastroenterol. 2009;104:289–298. doi: 10.1038/ajg.2008.150. [DOI] [PMC free article] [PubMed] [Google Scholar]
- 11.Castell JA, Castell DO. Modern solid state computerized manometry of the pharyngoesophageal segment. Dysphagia. 1993;8:270–275. doi: 10.1007/BF01354550. [DOI] [PubMed] [Google Scholar]
- 12.Hernandez LV, Dua KS, Surapaneni SN, Rittman T, Shaker R. Anatomic-manometric correlation of the upper esophageal sphincter: a concurrent US and manometry study. Gastrointest Endosc. 2010;72:587–592. doi: 10.1016/j.gie.2010.04.029. [DOI] [PMC free article] [PubMed] [Google Scholar]


