

Abstract
Analytical method which combines electronic tongue technique and chemometrics analysis is developed to discriminate oil types and predict oil quality. All the studied Camellia oil samples from pressing, n-hexane extraction and supercritical CO2 extraction (SCCE), were successfully identified by principal component analysis (PCA) and hierarchical cluster analysis (HCA). Furthermore, multi factor linear regression model (MLRM) was established to predict oil quality, which are indicated by acid value (AV) and peroxide value (POV). The practical potential of e-tongue for the discrimination and assessment of Camellia oils has shown promising application in the characterization of Camellia oils in the oil quality evaluation.
Supplementary Information
The online version contains supplementary material available at 10.1007/s10068-021-00973-1.
Keywords: Electronic tongue, Camellia oil, Supercritical CO2 extraction, Physicochemical property, Chemometrics
Introduction
The evergreen shrub Camellia oleifera Abel., belonging to Camellia genus of Theaceae family, is a unique woody edible oil species widely distributed in southern China (Gao et al. 2020). Camellia seed oil, known as the “oriental olive oil” (Cheng et al. 2018), contains abundant unsaturated fatty acids, among which the total amount of oleic acid and linoleic acid is over 85% (Yang et al. 2016). The edible value of Camellia seed oil is high, for it also contains various nutritional ingredients such as polyphenols, sterols and tocopherols (Zhou et al. 2019). Meanwhile, its bioactive properties, e.g., anti-inflammatory, anti-oxidant activity and anti-obesity (Fattahi-far et al. 2006; Guan et al. 2011), render Camellia seed oil a great application potential in cosmetic and medicinal field (Chaikul et al. 2017). Recommended by FAO as high-quality edible oil (Zhou et al. 2019), Camellia seed oil is now in great demand for people who have higher requirements for health, and thus the corresponding industry has a promising prospect in the future.
Cold pressing and solvent extraction are the most commonly used industrial methods in oil extraction process (Yang et al. 2019). Over refinement could be avoided by cold pressing via cutting down the high temperature pretreatment of Camellia seed, the decolorization and deodorization of crude oil (Moslavac et al. 2014). Thus the quality of cold pressing oil is guaranteed by reducing the loss of bioactive compound which is sensitive to heat and also by reducing the formation of benzopyrene and glycidyl ester at high temperature (Qi et al. 2015; Wei et al. 2015; Wu et al. 2012). Organic solvent extraction method has obvious defects such as solvent residue, and environmental pollution. This method is still in use especially in the treatment of pressed seed cake for the economic reason (Shao et al. 2015). In comparison, cold pressed oil showed stronger antioxidant and antimicrobial activities than oil extracted by organic solvent (Zhou et al. 2014). Supercritical CO2 extraction (SCCE) has been widely applied as a green technology. It is superior to traditional technology as it is non‐toxic, fast and high efficient. Besides that, its critical temperature and critical pressure (Tc = 304.2 K, Pc = 7.38 MPa) are moderate to reach (Duan et al. 2013). The oil quality extracted by scCO2 is superior both in higher bioactive constituents content such as squalene and sterols, and also better physicochemical characteristics like lighter color, stronger aroma, lower acid value (AV) and peroxide value (POV) compared to the cold pressing oil (Shao et al. 2015). The oil quality differs obviously when extracted by different processes, which means developing a proper methodology to distinguish oil from different processes is meaningful.
In the PRC National Standard (GBT11765-2018), Camellia seed oil quality are classified by physicochemical parameters with defined corresponding analytical procedures, for example, the first grade oil, acid value (calculate in KOH) ≤ 0.50 mg/g, peroxide value ≤ 0.25 g/100 g, moisture and volatile content ≤ 0.10%. Conventional analytical techniques such as HPLC and GC–MS have certain drawbacks, e.g., expensive instruments, complex sample pretreatment and consuming more time (Aparicio et al. 2013; Semenov et al. 2019). In recent years, electronic tongue (e-tongue) technique, as an analytical technique mimicking the human senses of taste, owing to its simple, rapid, efficient and precise characters, has been widely explored in food, cosmetic and pharmaceutical industries (Sliwinska et al. 2014). Many qualitative and/or quantitative applications of e-tongue for olive oils have been reported successfully. Quality parameters such as peroxide, anisidine values and total tocopherols (Semenov et al. 2019), carotenoid (Semenov et al. 2019), oxidative stability and polyphenols (Rodrigues et al. 2019) were correlated and assessed by e-tongue system combined with chemometrics. Studies of classification of the olive oil based on quality (Tahri et al. 2018; Veloso et al. 2018), discrimination of adulterate olive oil (Harzalli et al. 2018; Oliveri et al. 2009), olive oil shelf-life estimation (Buratti et al. 2018; Rodrigues et al. 2017) and olive oil sensory assessment (Rodrigues et al. 2019, 2018) were also well achieved indicating broad application of e-tongue in oil characterization. For Camellia oil, chemometrics combined with electronic nose was found effective to discriminate the geographical origins (Peng et al. 2020). Methods of FTIR (Han et al. 2020) or NIR (Chu et al. 2017) spectroscopy combined with chemometrics were developed to identify Camellia oil adulteration with rapeseed oil or vegetable oil. To the best of our knowledge, discrimination of Camellia seed oils produced by different processes has not been reported.
The aim of the present work was to evaluate the e-tongue application in characterization of Camellia seed oils (pressed, extracted with organic solvent and scCO2) and simulate the peroxide value (POV) and acid value (AV) with sensory assessment. Besides, Chemometric quantitative approach (multiple linear regression models) is applied to establish predictive multivariate models.
Materials and methods
Chemicals and reagents
Commercial CO2 (purity, 99.99%) was supplied by Air liquide Foshan Co., Ltd. (Foshan, China). Tartaric acid and silver chloride were supplied by Aladdin-Reagent Co, Ltd. (Shanghai, China). Isopropyl alcohol, ether, n-hexane, phenolphthalein, sodium hydroxide, acetic acid, chloroform, potassium iodide, sodium thiosulfate, anhydrous sodium sulfate, soluble starch, potassium chloride, potassium hydroxide, hydrochloric acid and ethanol were purchased from Guangzhou Chemical Reagent Co., Ltd. (Guangzhou, China). Ultrapure water was produced by Milli-Q Reference (MERCK Millipore, Germany).
Camellia seed oil sample and physicochemical characteristic analysis
Five commercial pressed Camellia seed oil samples were obtained and denoted from S1 to S5 (Table 1). Camellia seeds were provided by Guangdong Fanlong Agricultural Technology Development Co., Ltd (Jieyang, China) and were grinded to a proper size by an experimental mill. Oil sample (No. S6) extracted by n-hexane was carried out by soxhlet extraction method (GBT14488.1-2008). Supercritical CO2 extractions of Camellia seed were conducted in a HB120-50-05 device (Jiangsu Hongbo Machinery Manufacturing Co., Ltd). 1 kg of Camellia seeds were loaded in the extraction cell, and then CO2 were pumped in to remove air. After reaching the set temperature, pressure was gradually increased by a CO2 high-pressure pump. Extraction started in a cyclic manner for a period of time after reaching set pressure. Oil samples were collected in the pressure reduction container I at every 0.5 h, and then merged and classified in the time period of 0–2 h, 3 h and 4–6 h for the subsequent testing. Oil yield was classified as:
Table 1.
Acid value (AV) and peroxide value (POV) of camellia seed oil samples and corresponding prepared method
| Sample | Origin | Acid value (mg/g) | Peroxide value (g/100 g) | Method |
|---|---|---|---|---|
| S1 | Yongzhou, Hunan | 0.27 ± 0.008 | 0.109 ± 0.004 | Pressed |
| S2 | Ji’an, Jiangxi | 0.68 ± 0.009 | 0.125 ± 0.004 | Pressed |
| S3 | Wuzhou, Guangxi | 0.26 ± 0.011 | 0.128 ± 0.004 | Pressed |
| S4 | Yichun, Jiangxi | 0.29 ± 0.004 | 0.453 ± 0.007 | Pressed |
| S5 | Hengyang, Hunan | 0.82 ± 0.002 | 0.172 ± 0.005 | Pressed |
| S6 | Jieyang, Guagnzhou | 3.00 ± 0.019 | 0.493 ± 0.010 | Solvent extraction |
| S7 | 2.16 ± 0.014 | 0.022 ± 0.003 | scCO2 extraction | |
| S8 | 1.82 ± 0.009 | 0.022 ± 0.003 | 25 MPa, 313.15 K, 3 h | |
| S9 | 1.54 ± 0.004 | 0.029 ± 0.003 | 25 MPa, 313.15 K, 4–6 h | |
| S10 | 2.52 ± 0.001 | 0.015 ± 0.004 | 25 MPa, 323.15 K, 0–2 h | |
| S11 | 1.62 ± 0.003 | 0.013 ± 0.002 | 25 MPa, 323.15 K, 3 h | |
| S12 | 1.18 ± 0.009 | 0.019 ± 0.002 | 25 MPa, 323.15 K, 4–6 h | |
| S13 | 3.48 ± 0.014 | 0.022 ± 0.001 | 25 MPa, 333.15 K, 0–2 h | |
| S14 | 2.31 ± 0.010 | 0.016 ± 0.001 | 25 MPa, 333.15 K, 3 h | |
| S15 | 0.64 ± 0.007 | 0.022 ± 0.002 | 25 MPa, 333.15 K, 4–6 h | |
| S16 | 3.05 ± 0.011 | 0.015 ± 0.001 | 20 MPa, 313.15 K, 0–2 h | |
| S17 | 2.11 ± 0.002 | 0.012 ± 0.002 | 20 MPa, 313.15 K, 3 h | |
| S18 | 1.68 ± 0.005 | 0.015 ± 0.001 | 20 MPa, 313.15 K, 4–6 h | |
| S19 | 2.98 ± 0.009 | 0.014 ± 0.001 | 30 MPa, 313.15 K, 0–2 h | |
| S20 | 2.33 ± 0.006 | 0.018 ± 0.002 | 30 MPa, 313.15 K, 3 h | |
| S21 | 2.11 ± 0.005 | 0.021 ± 0.003 | 30 MPa, 313.15 K, 4–6 h |
Single factor analysis with temperature ranging from 313.15 to 333.15 K and pressure ranging from 20 to 30 MPa were investigated in this study. Samples achieved by SCCE were listed as S7 to S21 according to the condition and sampling time (Table 1). All the oils were sealed and refrigerated before further tests.
Physicochemical characteristic of the oil samples was analyzed according to the PRC National Standard. The moisture and volatile matter (GB 5009.236-2016), peroxide value (GB 5009.227-2016) and acid value (GB 5009.229-2016) were analyzed following the standard methods. Peroxide value and acid value were shown as mean ± standard deviation (SD) in Table 1.
E-tongue analysis
Sample pretreatment
Twelve gram of oil sample was added to 85 g ultrapure water (333.15 K), stirred by emulsifying mixer for 3 min. After cooling to room temperature, 50 g standard solution (2.24 g KCl and 0.045 g tartaric acid in 1000 mL ultrapure water) was added and then centrifuged for 10 min at 3000 rpm. Aqueous phase was taken for further determination.
Sensors
A commercial taste-sensing system SA 402B (Insent Company, Japan) was applied to test the simulated taste of Camellia oil samples. There are two reference sensors and five detecting sensors representing sourness (CA0), bitterness and its aftertaste (C00), astringency and its aftertaste (AE1), saltiness (CT0), umami and richness (AAE). All the sensors were activated for 24 h before measurement.
Sample analysis
Sensors are equipped with artificial lipid membranes which are sensitive to different chemical substances, the potential difference between taste sensor and reference sensor is measured and recorded. Each experiment was repeated four times and the last three data profile were selected and averaged for subsequent analysis.
Statistical analysis
To compare the taste characteristics of Camellia seed oil, correlation analysis (Pearson correlation), principal component analysis (PCA) and hierarchical cluster analysis (HCA) were performed using SPSS 19.0 software (SPSS Inc., Chicago, IL) at test significant differences (p < 0.05) (Lin et al. 2020). Estimation of the quality parameters, acid value and peroxide value were also carried out by SPSS 19.0 software using multivariate linear regression technique.
Results and discussion
Single-factor experiments of SCCE
The loading amount of crushed Camellia seeds and the flow rate of CO2 were set fixed in the experiments. Varied extraction temperature and pressure were investigated and discussed in detail.
Effect of extraction temperature
Raising the temperature could enhance both saturated vapor pressure and diffusivity coefficient of the solute, resulting in better solubility behavior in scCO2, while at the same time, higher temperature also reduced the density of scCO2 decreasing the dissolving capacity of scCO2 (Bogdanovic et al. 2015; Pilavtepe et al. 2012). These two factors have opposite effects on the oil extraction yield, as a result, an optimum temperature could be predicted in theory. Temperature effects are shown in Fig. 1(A). As the temperature increased, the oil extraction yield decreased rapidly. This indicates that the optimal temperature might be lower than 313.15 K and dissolving power of scCO2 plays a more important role in the extraction process. Meanwhile higher extraction yield was obtained with longer extraction time.
Fig. 1.

Yield comparison of different conditions of scCO2 extraction: (A) varied temperatures at 25 MPa: □ 313.15 K, ○ 323.15 K, △ 333.15 K, (B) varied pressures at 313.15 K: ▽ 20 MPa, □ 25 MPa, ☆ 30 MPa
Effect of extraction pressure
As the pressure increased, the density and polarity of scCO2 also increased which led to stronger dissolving capacity and higher extraction yield. Pressure effects are displayed in Fig. 1(B). The oil extraction yield increased gradually as the pressure increased, and the yield increased slower at higher pressure. In dynamic extraction process with longer time, more oil was extracted. The highest extraction yield 22.60% was achieved at 30 MPa, 8 h. At the first 4 h, the oil yield increased fast, 4 h later, it increased slowly in a upward trend.
Oil physicochemical characteristics
Lower AV and POV represents better quality of oil. These two indicators of all the oil samples were determined and compared in Table 1. AVs of all commercial pressed oils are less than 1, while for samples extracted by n-hexane and scCO2, the values are much higher, distributing between 3 and 1. The AV value contributes to distinguishing sourness tastes. AVs of SCCE samples declined significantly as extraction time increased, e.g., from 3.48 mg/g (0–2 h) to 0.64 mg/g (4–6 h) at the condition of 25 MPa and 333.15 K. While for POV, sample extracted by n-hexane was the highest up to 0.493 g/100 g, indicating that solvent reflux process is unfavorable for the oil quality. For SCCE samples, POV were ranging from 0.012 to 0.029 g/100 g, significantly lower than other prepared oil samples, indicating SCCE is a better preparation method keeping oil quality. After further optimizing the supercritical extraction process, it shows promising application to prepare Camellia oil of which AV and POV meet the first-grade standard (GBT11765-2018, AV ≤ 0.50 mg/g, POV ≤ 0.25 g/100 g).
Taste characteristics
E-tongue profiles of Camellia oils
Figure 2 shows the radar chart of taste variations determined by electronic tongue. Pressed and n-hexane extracted oils samples are displayed in Fig. 2(A), and SCCE samples are shown in Fig. 2(B) (varied temperature) and Fig. 2(C) (varied pressure). There were no obvious differences in bitterness, astringency, aftertaste-bitterness (aftertaste-B), aftertaste-astringency (aftertaste-A) and saltiness among these samples. However, there were significant differences in sourness, umami and richness among these oil samples, especially in the SCCE samples. Negative correlations were found between umami and sourness (R2 = −0.997, p < 0.001), richness and sourness (R2 = −0.912, p < 0.001). E-tongue value of reference tartaric acid solution was set as zero, other oil sourness value was all negative. The larger the absolute value, the weaker sourness taste is. Oil samples are listed in descending order of sourness value, which is SCCE oils, n-hexane extracted oil and pressed oils. The highest sourness value was found in S13 ( −0.99), and the lowest one was in S2 ( −10.32). For the SCCE samples at 25 MPa and different temperatures, shown in Fig. 2(B), sourness value gradually increased in ascending order: Samples (313.15 K) < Samples (323.15 K) < Samples (333.15 K). While for the SCCE samples at 313.15 K and different pressures (Fig. 2(C)), sourness value was highest in oils at 30 MPa. This may be due to that sourness substances are easier to be extracted under higher temperature and pressure.
Fig. 2.
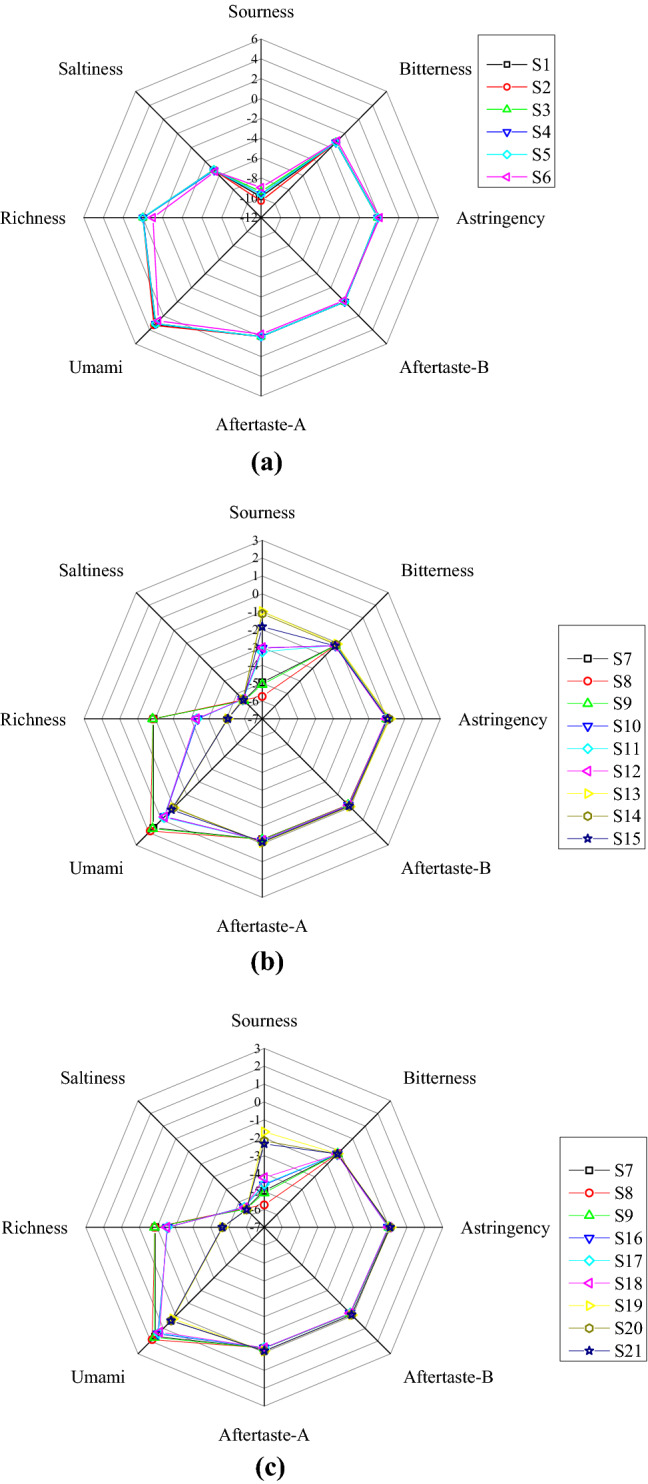
Radar charts of e-tongue response of Camellia oils. (A) Pressed and n-hexane extracted oils samples; (B) SCCE samples at 25 MPa and varied temperatures (313.15 K, 323.15 K, and 333.15 K); (C) SCCE samples at 313.15 K and varied pressures (20 MPa, 25 MPa and 30 MPa)
Differences of bitterness and astringency taste responses are relatively small. For bitterness, the maximum value was in solvent extracted sample S6 ( −1.05). Pressed oils have the smallest bitterness and astringency among all the samples. Similarly, high temperature (S13–S15) and high pressure (S19–S21) contribute to the high astringency taste value.
Discrimination of Camellia oil
Principal component analysis (PCA) is mainly used to visualize multidimensional taste profiles in a reduced-dimension plot (Zhu et al. 2020). The relevant importance of these various components is expressed as percentages. In the results from PCA with eigenvalue greater than 1 (Fig. S1 in supplementary material), the first two principal components (PC1 and PC2) accounted for 65.4 and 22.8% of total variance and their total cumulative variance is contributed for 88.2%. Although the pressed oils were successfully separated from extracted oils, the difference between SCCE samples and n-hexane extracted samples was not obvious. Figure 3 illustrates three-dimensional score plot (A) and loading plot (B) in PCA for the different samples by the first three principal components (PC1, PC2 and PC3), whose total cumulative variance accounts for 97.4%. The samples are well clustered and no overlap, implying that the tastes of three groups were different. Pressed oils showed relative narrow spatial distribution, while SCCE samples, exhibited a wide range of positive to negative scores, almost splitting into 3 subgroups along both PC1 and PC2 directions: G1 (S13–S15 and S19–S21), G2 (S10–S12), and G3 (S7–S9 and S16–S18). (Fig. S2 in supplementary material). In scCO2, higher pressure means stronger solvation power and better extraction capability of the fluid. Meanwhile, higher temperature improves dissolving of taste substances from the seed and also enhances their saturation vapor pressure resulting in better solubility, although higher temperature could lead to scCO2 density decrease. These three groups well illustrated the SCCE condition differences among the samples, as G1 represents better solubility of solute in scCO2 due to high temperature (S13–S15, 25 MPa, 333.15 K), or stronger solvent power due to high pressure (S19–S21, 30 MPa, 313.15 K); G2 represents medium temperature and pressure (S10–S11, 25 MPa, 323.15 K); G3 represents relative low temperature and pressure (S7 –S9, 25 MPa, 313.15 K and S16 –S18, 20 MPa, 313.15 K). For the three samples in the same group, composition of the extracted oil varies with time, this might be the reason that the taste of these samples are different.
Fig. 3.

The Principal component analysis three-dimensional diagrams of different Camellia oils based on e-tongue measurements (A: score plot, B: loading plot)
Eight kinds of taste loading vectors were shown in Fig. 3(B). Similar loading vectors suggest redundancy in the potential responses and high loading parameters contribute to discriminating among the samples (Saidi et al. 2018). The umami, richness, saltiness, sourness, and astringency were mainly responsible for the oil discrimination in the direction of PC1, whereas aftertaste-A and Aftertaste-B contributed a lot to the separation along with the direction of PC2, and for PC3, bitterness, astringency and sourness play an important role in the classification (Fig. S3 in supplementary material). The pressed, n-hexane extracted and SCCE samples were mainly differentiated by umami, richness, saltiness, aftertaste-A and Aftertaste-B with positive score values along PC1 and PC2. Considered the varied extraction processes, PC2 in general may be responsible for special flavor substances, as pressed and strong SCCE method offered more abundant flavor chemicals in the oils. These clusters are clearly distinguished from each other (Fig. S2 (a) in supplementary material). To be noteworthy, most PC3 may represent free fatty acid. The acid values of S6 and S13 were relative large in accordance with their high positive score along PC3. Also, peroxide value of the oil samples may represent in PC1, as their increasing trend is consistent. Not all the data fit these regulations, and the reason is hard to suggest because of the complicated multivariate nature of the score plots.
Thus, for the particular dataset, reliable discrimination of oil samples from different extraction method can be illustrated by the e-tongue technique.
Cluster analysis
Hierarchical cluster analysis (HCA) discovered and identified relationships between oil varieties by the distance of taste response of the samples (Zhu et al. 2020). HCA provides insight into the taste profiles by dividing similar samples into groups (clusters) (Liu et al. 2020). In this study, HCA was conducted by Ward’s method for aggregation and the squared Euclidean distance as diversity test. Dendrogram of clustered oil samples based on similarities is shown in Fig. 4. The clustering result is almost the same with PCA analysis. All the samples were first divided into two main clusters. Cluster I is SCCE samples and Cluster II is pressed oils and n-hexane extracted oils. ScCO2 conditions related with solvent extraction power contributes a lot to Cluster I. Cluster II was further divided into two sub-clusters, one was consisted of pressed oils and the other was n-hexane extracted oil S6. When the number of overall cluster is set to 5 or more, the difference between the pressed and n-hexane extracted samples is less than the SCCE samples of varied conditions. Thus, the HCA method was able to distinguish oil samples from different extraction processes based on the e-tongue profiles.
Fig. 4.

Hierarchical cluster analysis based on taste profiles of various oil samples
Correlation between E-tongue analysis and chemical properties
Acid value (AV) and peroxide value (POV) are key parameters to assess Camellia oil quality and gradation. The possibility of estimating AV and POV level based on e-tongue profiles was evaluated by multi factor linear regression model (MLRM), of which the above AV and POV data are by titration according to National Standard. The model results were clearly shown in Table 2. Based on eight potential signals recorded by five sensors, which was further selected using stepwise regression method, MLRM models were established with certain ability to predict AV and PV of Camellia oils. Establish the model based on n-hexane extracted and SCCE samples, POV value could be well correlated by the model with R2 = 0.908 (POV value = −0.109 * Sourness-0.094 * Richness-0.625) and p < 0.001 but the linearity of AV value was not obvious. While expand the model to all samples, the AV and POV value predicted shows unperfect predictive power (AV: R2 = 0.702, p < 0.001; POV: R2 = 0.720, p < 0.001, models were shown in Table 2). Lack of the linearity of the models may be due to the inhomogeneity in 1 kg scale SCCE process which resulted in AV and POV fluctuating. AV value was more difficult to predict probably due to that the microemulsion system of free fatty acid in water/scCO2 was not uniform and stable in the extraction process. Assessing these physiochemical characterizations using e-tongue technique coupled with chemometrics, satisfactory results were also reported (Rodrigues et al. 2019; Semenov et al. 2019). Although the precision of the models could be further improved, the method still seems attractive to obtain two key quality values in one measurement. This indicates that e-tongue system would be a promising technique for quantification of Camellia oil quality parameters.
Table 2.
Summary of models developed to predict AV and POV
| Regression coefficients | Standard Error | t-value | Significance F | F | R2 | |
|---|---|---|---|---|---|---|
| Models fitted with all oil samples | ||||||
| AV | 21.167 | 0.702 | ||||
| Constant | 15.075 | 2.749 | 5.483 | 0.000 | ||
| Bitterness | 10.718 | 2.370 | 4.522 | 0.000 | ||
| Sourness | 0.095 | 0.044 | 2.171 | 0.044 | ||
| POV | 14.589 | 0.720 | ||||
| Constant | −0.308 | 0.072 | −4.278 | 0.001 | ||
| Sourness | −0.210 | 0.066 | −3.161 | 0.006 | ||
| Astringency | 0.903 | 0.360 | 2.508 | 0.023 | ||
| Unami | −0.437 | 0.189 | −2.316 | 0.033 | ||
| Models fitted with extracted oil samples | ||||||
| Constant | −0.625 | 0.071 | −8.755 | 0.000 | 63.804 | 0.908 |
| Sourness | −0.109 | 0.010 | −10.710 | 0.000 | ||
| Richness | −0.094 | 0.012 | −7.721 | 0.000 | ||
Supplementary Information
Below is the link to the electronic supplementary material.
Acknowledgements
The financial supports from the Young Innovative Talents Program of Educational Commission of Guangdong Province (No. 2019GKQNCX057), The Innovation Project of Guangdong Colleges and Universities (No. 2018GKTSCX034 and No. 2019GKTSCX011), Jieyang Science and Technology Project (No. 2017xm017), Science and Technology Program of Guangzhou (No. 202102080255), Guangdong Province Science and Technology Innovation Strategy Special Fund Project (No.pdjh2021b0721), Project of Zhujiang Distinguished Professor of Guangdong Province (No. KYRC2017-001), Talent Program of Guangdong Industry Technical College (No. KYRC2019-008), Innovation and entrepreneurship exquisite education project of Guangdong Industry Technical College (No.2020JZYR010), College Student Scientific Research Project of Guangdong Industry Technical College (No.XSKYL202015) are gratefully acknowledged.
Declaration
Conflict of interest
The authors declare that we do not have any commercial or associative interest that represents a conflict of interest in connection with the work submitted.
Footnotes
Publisher's Note
Springer Nature remains neutral with regard to jurisdictional claims in published maps and institutional affiliations.
Di Duan and Yong Huang are contributed equally to this work.
Contributor Information
Di Duan, Email: xiaod@zju.edu.cn.
Yong Huang, Email: 1320088526@qq.com.
Ying Zou, Email: xiaozou2020@163.com.
Bingju He, Email: hebingju0727@163.com.
Ruihui Tang, Email: tangruihui0803@163.com.
Liuxia Yang, Email: 1752806621@qq.com.
Zecao Zhang, Email: zzc531464@163.com.
Shucai Su, Email: 2309269656@qq.com.
Guoping Wang, Email: oliver@gdfanlong.com.
Deyi Zhang, Email: cheung@gdfanlong.com.
Chunhui Zhou, Email: 2018090143@gdip.edu.cn.
Jing Li, Email: 2005102043@gdip.edu.cn.
Maocheng Deng, Email: 2003102018@gdip.edu.cn.
References
- Aparicio R, Morales MT, Aparicio-Ruiz R, Tena N, García-González DL. Authenticity of olive oil: Mapping and comparing official methods and promising alternatives. Food Research International. 2013;54:2025–2038. doi: 10.1016/j.foodres.2013.07.039. [DOI] [Google Scholar]
- Bogdanovic A, Tadic V, Stamenic M, Petrovic S, Skala D. Supercritical carbon dioxide extraction of Trigonella foenum-graecum L seeds: Process optimization using response surface methodology. The Journal of Supercritical Fluids. 2015;107:44–50. doi: 10.1016/j.supflu.2015.08.003. [DOI] [Google Scholar]
- Buratti S, Malegori C, Benedetti S, Oliveri P, Giovanelli G. E-nose, e-tongue and e-eye for edible olive oil characterization and shelf life assessment: A powerful data fusion approach. Talanta. 2018;182:131–141. doi: 10.1016/j.talanta.2018.01.096. [DOI] [PubMed] [Google Scholar]
- Chaikul P, Sripisut T, Chanpirom S, Sathirachawan K, Ditthawuthikul N. Melanogenesis inhibitory and antioxidant effects of camellia oleifera seed oil. Advanced Pharmaceutical Bulletin. 2017;7:473–477. doi: 10.15171/apb.2017.057. [DOI] [PMC free article] [PubMed] [Google Scholar]
- Cheng X, Yang T, Wang Y, Zhou B, Yan L, Teng L, Wang F, Chen L, He Y, Guo K, Zhang D. New method for effective identification of adulterated Camellia oil basing on Camellia oleifera-specific DNA. Arabian Journal of Chemistry. 2018;11:815–826. doi: 10.1016/j.arabjc.2017.12.025. [DOI] [Google Scholar]
- Chu X, Wang W, Li C, Zhao X, Jiang H. Identifying camellia oil adulteration with selected vegetable oils by characteristic near-infrared spectral regions. Journal of Innovative Optical Health Sciences. 2017;11:1850006. doi: 10.1142/S1793545818500062. [DOI] [Google Scholar]
- Duan D, Su B, Zhang Z, Bao Z, Yang Y, Ren Q. Synthesis, characterization and structure effects of polyethylene glycol bis(2-isopropoxyethyl) dimethyl diphosphates on lanthanides extraction with supercritical carbon dioxide. The Journal of Supercritical Fluids. 2013;81:103–111. doi: 10.1016/j.supflu.2013.05.004. [DOI] [Google Scholar]
- Fattahi-far E, Sahari MA, Barzegar M. Interesterification of tea seed oil and its application in margarine production. Journal of the American Oil Chemists' Society. 2006;83:841–845. doi: 10.1007/s11746-006-5035-9. [DOI] [Google Scholar]
- Gao C, Cai C, Liu J, Wang Y, Chen Y, Wang L, Tan Z. Extraction and preliminary purification of polysaccharides from Camellia oleifera Abelseed cake using a thermoseparating aqueous two-phase system based on EOPO copolymer and deep eutectic solvents. Food Chemistry. 313: 126164 (2020) [DOI] [PubMed]
- Guan LEI, Chung HY, Chen ZY. Comparison of hypocholesterolemic activity of tea seed oil with commonly used vegetable oils in hamsters. Journal of Food Biochemistry. 2011;35:859–876. doi: 10.1111/j.1745-4514.2010.00425.x. [DOI] [Google Scholar]
- Han J, Sun R, Zeng X, Zhang J, Xing R, Sun C, Chen Y. Rapid classification and quantification of camellia (Camellia oleifera Abel) oil blended with rapeseed oil using FTIR-ATR spectroscopy. Molecules. 2020;25:2036. doi: 10.3390/molecules25092036. [DOI] [PMC free article] [PubMed] [Google Scholar]
- Harzalli U, Rodrigues N, Veloso ACA, Dias LG, Pereira JA, Oueslati S, Peres AM. A taste sensor device for unmasking admixing of rancid or winey-vinegary olive oil to extra virgin olive oil. Computers and Electronics in Agriculture. 2018;144:222–231. doi: 10.1016/j.compag.2017.12.016. [DOI] [Google Scholar]
- Lin Y, Huang G, Zhang Q, Wang Y, Dia VP, Meng X. Ripening affects the physicochemical properties, phytochemicals and antioxidant capacities of two blueberry cultivars. Postharvest Biology and Technology. 162: 111097 (2020)
- Liu B, Zhao D, Zhang P, Liu F, Jia M, Liang J. Seedling evaluation of six walnut rootstock species originated in China based on principal component analysis and cluster analysis. Scientia Horticulturae. 265: 109212 (2020)
- Moslavac T, Jokić S, Šubarić D, Aladić K, Vukoja J, Prce N. Pressing and supercritical CO2 extraction of Camelina sativa oil. Industrial Crops and Products. 2014;54:122–129. doi: 10.1016/j.indcrop.2014.01.019. [DOI] [Google Scholar]
- Oliveri P, Baldo MA, Daniele S, Forina M. Development of a voltammetric electronic tongue for discrimination of edible oils. Analytical and Bioanalytical Chemistry. 2009;395:1135–1143. doi: 10.1007/s00216-009-3070-8. [DOI] [PubMed] [Google Scholar]
- Peng Q, Xu Q, Dula BG, Wang J, Fu J, Wang L, Qian B, Zhou J, Wu J, Wang J, Ding Y. Discrimination of geographical origin of camellia seed oils using electronic nose characteristics and chemometrics. Journal of Consumer Protection and Food Safety. 2020;15:263–270. doi: 10.1007/s00003-020-01278-x. [DOI] [Google Scholar]
- Pilavtepe M, Yucel M, Helvaci S, Demircioglu M, Yesil-Celiktas O. Optimization and mathematical modeling of mass transfer between Zostera marina resides and supercritical CO2 modified with ethanol. The Journal of Supercritical Fluids. 2012;68:87–93. doi: 10.1016/j.supflu.2012.04.013. [DOI] [Google Scholar]
- Qi S, Chen H, Liu Y, Wang W, Shen L, Wang Y. Evaluation of glycidyl fatty acid ester levels in Camellia oil with different refining degrees. International Journal of Food Properties. 2015;18:978–985. doi: 10.1080/10942912.2013.858351. [DOI] [Google Scholar]
- Rodrigues N, Dias LG, Veloso ACA, Pereira JA, Peres AM. Evaluation of extra-virgin olive oils shelf life using an electronic tongue-chemometric approach. European Food Research and Technology. 2017;243:597–607. doi: 10.1007/s00217-016-2773-2. [DOI] [Google Scholar]
- Rodrigues N, Oliveira L, Mendanha L, Sebti M, Dias LG, Oueslati S, Veloso ACA, Pereira JA, Peres AM. Olive oil quality and sensory changes during house-use simulation and temporal assessment using an electronic tongue. Journal of the American Oil Chemists' Society. 2018;95:1121–1137. doi: 10.1002/aocs.12093. [DOI] [Google Scholar]
- Rodrigues N, Marx ÍMG, Casal S, Dias LG, Veloso ACA, Pereira JA, Peres AM. Application of an electronic tongue as a single-run tool for olive oils’ physicochemical and sensory simultaneous assessment. Talanta. 2019;197:363–373. doi: 10.1016/j.talanta.2019.01.055. [DOI] [PubMed] [Google Scholar]
- Saidi T, Moufid M, Zaim O, El Bari N, Bouchikhi B. Voltammetric electronic tongue combined with chemometric techniques for direct identification of creatinine level in human urine. Measurement. 2018;115:178–184. doi: 10.1016/j.measurement.2017.10.044. [DOI] [Google Scholar]
- Semenov V, Volkov S, Khaydukova M, Fedorov A, Lisitsyna I, Kirsanov D, Legin A. Determination of three quality parameters in vegetable oils using potentiometric e-tongue. Journal of Food Composition and Analysis. 2019;75:75–80. doi: 10.1016/j.jfca.2018.09.015. [DOI] [Google Scholar]
- Shao P, Liu Q, Fang Z, Sun P. Chemical composition, thermal stability and antioxidant properties of tea seed oils obtained by different extraction methods: Supercritical fluid extraction yields the best oil quality. European Journal of Lipid Science and Technology. 2015;117:355–365. doi: 10.1002/ejlt.201400259. [DOI] [Google Scholar]
- Sliwinska M, Wisniewska P, Dymerski T, Namiesnik J, Wardencki W. Food analysis using artificial senses. Journal of Agricultural and Food Chemistry. 2014;62:1423–1448. doi: 10.1021/jf403215y. [DOI] [PubMed] [Google Scholar]
- Tahri K, Duarte AA, Carvalho G, Ribeiro PA, da Silva MG, Mendes D, El Bari N, Raposo M, Bouchikhi B. Distinguishment, identification and aroma compound quantification of Portuguese olive oils based on physicochemical attributes, HS-GC/MS analysis and voltammetric electronic tongue. Journal of the Science of Food and Agriculture. 2018;98:681–690. doi: 10.1002/jsfa.8515. [DOI] [PubMed] [Google Scholar]
- Veloso ACA, Silva LM, Rodrigues N, Rebello LPG, Dias LG, Pereira JA, Peres AM. Perception of olive oils sensory defects using a potentiometric taste device. Talanta. 2018;176:610–618. doi: 10.1016/j.talanta.2017.08.066. [DOI] [PubMed] [Google Scholar]
- Wei J, Chen L, Qiu X, Hu W, Sun H, Chen X, Bai Y, Gu X, Wang C, Chen H, Hu R, Zhang H, Shen G. Optimizing refining temperatures to reduce the loss of essential fatty acids and bioactive compounds in tea seed oil. Food and Bioproducts Processing. 2015;94:136–146. doi: 10.1016/j.fbp.2015.02.003. [DOI] [Google Scholar]
- Wu SX, Zhang ZM, Liu RX, Huang SS. Effect of production process on benzo (a) pyrene content in Camellia oil. Advanced Materials Research. 2012;554–556:1099–1102. doi: 10.4028/www.scientific.net/AMR.554-556.1099. [DOI] [Google Scholar]
- Yang C, Liu X, Chen Z, Lin Y, Wang S. Comparison of oil content and fatty acid profile of ten new Camellia oleifera Cultivars. Journal of Lipids. 2016;2016:3982486–3982486. doi: 10.1155/2016/3982486. [DOI] [PMC free article] [PubMed] [Google Scholar]
- Yang J-Y, Li J, Wang M, Zou X-G, Peng B, Yin Y-L, Deng Z-Y. A novel aqueous extraction for Camellia oil by emulsified oil: A frozen/thawed method. European Journal of Lipid Science and Technology. 121: 1800431 (2019)
- Zhou Q-f, Jia X-j, Li Q-q, Yang R-w, Zhang L, Zhou Y-h, Ding C-b. Antioxidant and antimicrobial activities of Camellia Oleifera seed oils. Journal of Applied Biological Chemistry. 57: 123-129 (2014)
- Zhou D, Shi Q, Pan J, Liu M, Long Y, Ge F. Effectively improve the quality of camellia oil by the combination of supercritical fluid extraction and molecular distillation (SFE-MD) LWT-Food Science and Technology. 2019;110:175–181. doi: 10.1016/j.lwt.2019.04.075. [DOI] [Google Scholar]
- Zhu D, Ren X, Wei L, Cao X, Ge Y, Liu H, Li J. Collaborative analysis on difference of apple fruits flavour using electronic nose and electronic tongue. Scientia Horticulturae. 260: 108879 (2020)
Associated Data
This section collects any data citations, data availability statements, or supplementary materials included in this article.