Abstract
We reviewed the sustainability of a multifaceted intervention on catheter-associated urinary tract infection (CAUTI) in 3 intensive care units. During the 4-year postintervention period, we observed reductions in urine culture rates (from 80.9 to 47.5 per 1,000 patient days; P < .01), catheter utilization (from 0.68 to 0.58; P < .01), and CAUTI incidence rates (from 1.7 to 0.8 per 1,000 patient days; P = .16).
Catheter-acquired urinary tract infections (UTIs) are one of the most common healthcare-acquired infections; they have gained national attention due to public reporting and reimbursement implications.1 Recent interventions to reduce CAUTIs have focused on “stewardship of culturing” or reducing inappropriate urine cultures in catheterized patients.2 Although many of these interventions focused on CAUTIs have been successful, sustainability of these prevention efforts has not been discussed widely. Our goal was to review the impact and sustainability of a multifaceted intervention aimed at CAUTI reduction within 3 large, adult, intensive care units (ICUs) at our medical center.
Methods
This intervention was conducted in a 957-bed quaternary- and tertiary-care academic teaching hospital in the southeastern United States. This quality improvement project included 3 ICUs (medical, surgical, and neuroscience), each with 24 beds. This study was deemed exempt from the Duke University’s Institutional Review Board (protocol no. 00104652).
In response to an increase in CAUTI rates between June and August 2016 (from 0.76 to 2.62 CAUTIs per 1,000 patient days for the previous quarter) a multidisciplinary ICU team assembled to design and implement a quality improvement project. The project included champions implementing multifaceted, evidence-based strategies of cognitive aids, printed education materials, educational outreach visits, and real-time feedback (see Supplementary Table 1 online for descriptions of each strategy). The intervention began on October 10, 2016.
Our primary outcome was CAUTI incidence rate per 1,000 patient days. Secondary outcomes included the urinary catheter utilization ratio and the rate of urine cultures per 1,000 patient days. We used rates per patient days rather than standardized infection ratio or catheter days due to the limitations of using catheter days as the denominator.4,5 Surveillance for CAUTI was conducted routinely by infection prevention according to the standard National Healthcare Safety Network (NHSN) criteria.6 Rates of CAUTI, catheter utilization, and urine cultures were compared between the preintervention period (October 2014–September 2016) and the postintervention period (October 2016–September 2020).
Statistical analysis
We performed segmented regression (interrupted time series) analysis to estimate changes in monthly incidence rate of each outcome in the preintervention and postintervention periods. We created 3 separate models for CAUTI rates, catheter utilization ratios, and urine culture rates. To account for temporal autocorrelation as well as unit-specific random effects, we used generalized linear mixed-effects models. Each model included random intercepts for unit and random slopes for time with an unstructured covariance matrix. Patient days was used as an offset term for each model. All models were constructed using the glmmTMB package in R version 3.6.3 software (R Project for Statistical Computing, Vienna, Austria). All graphs were created using ggplot2. Throughout the study, a statistical significance threshold of 2-sided P = .05 was used. P values for effect estimates in each model were calculated using the Wald χ2 test. For descriptive statistics, the dependent Wilcoxon rank-sum test was used.
Results
During the 4-year postintervention period, we observed reductions in urine culture rates (from 80.9 to 47.5 per 1,000 patient days; P < .01), catheter utilization ratios (from 0.68 to 0.58, P < .01), and CAUTI incidence rates (from 1.7 to 0.8 CAUTIs per 1,000 patient days; P = .16). Individual units varied slightly in baseline practices as well as the magnitude and significance of intervention effects (Table 1). The neuroscience ICU, for example, had the highest overall CAUTI rate but also the largest reduction in CAUTI rates following intervention.
Table 1.
Preintervention and Postintervention Comparison of Outcomes
| Unit | Measure | Preintervention Period (October 2014-September 2016) | Postintervention Period (October 2016-September 2020) | P Valuea |
|---|---|---|---|---|
| MICU | Patient days, no. | 16,040 | 31,895 | … |
| CAUTI events, no. (rate per 1,000 patient days) | 14 (0.9) | 14 (0.6) | .65 | |
| Urine cultures, no. (rate per 1,000 patient days) | 1,274 (79.4) | 2,091 (65.6) | <.01 | |
| Catheter days, no. (catheter utilization ratio) | 10,608 (0.66) | 18,727 (0.59) | <.01 | |
| SICU | Patient-days, no. | 11,412 | 29,791 | … |
| CAUTI events, no. (rate per 1,000 patient days) | 15 (1.3) | 27 (0.9) | .91 | |
| Urine cultures, no. (rate per 1,000 patient days) | 1,150 (100.8) | 1,546 (51.9) | <.01 | |
| Catheter days, no. (catheter utilization ratio) | 8,037 (0.70) | 18,788 (0.63) | <.01 | |
| NICU | Patient-days, no. | 13,396 | 31,206 | … |
| CAUTI events, no. (rate per 1,000 patient days) | 41 (3.1) | 31 (1.0) | .01 | |
| Urine cultures, no. (rate per 1,000 patient days) | 882 (65.8) | 771 (24.7) | <.01 | |
| Catheter days, no. (catheter utilization ratio) | 9,195 (0.69) | 16,499 (0.53) | <.01 | |
| Overall | Patient days: no. | 40,848 | 92,892 | … |
| CAUTI events, no. (rate per 1,000 patient days) | 70 (1.7) | 78 (0.8) | .16 | |
| Urine cultures, no. (rate per 1,000 patient days) | 3,306 (80.9) | 4,408 (47.5) | <.01 | |
| Catheter days no. (catheter utilization ratio) | 27,840 (0.68) | 54,014 (0.58) | <.01 |
Note. ICU, intensive care unit; MICU, medical ICU; SICU, surgical ICU; NICU, neuroscience ICU.
P values calculated by dependent Wilcoxon rank-sum test given lack of independence.
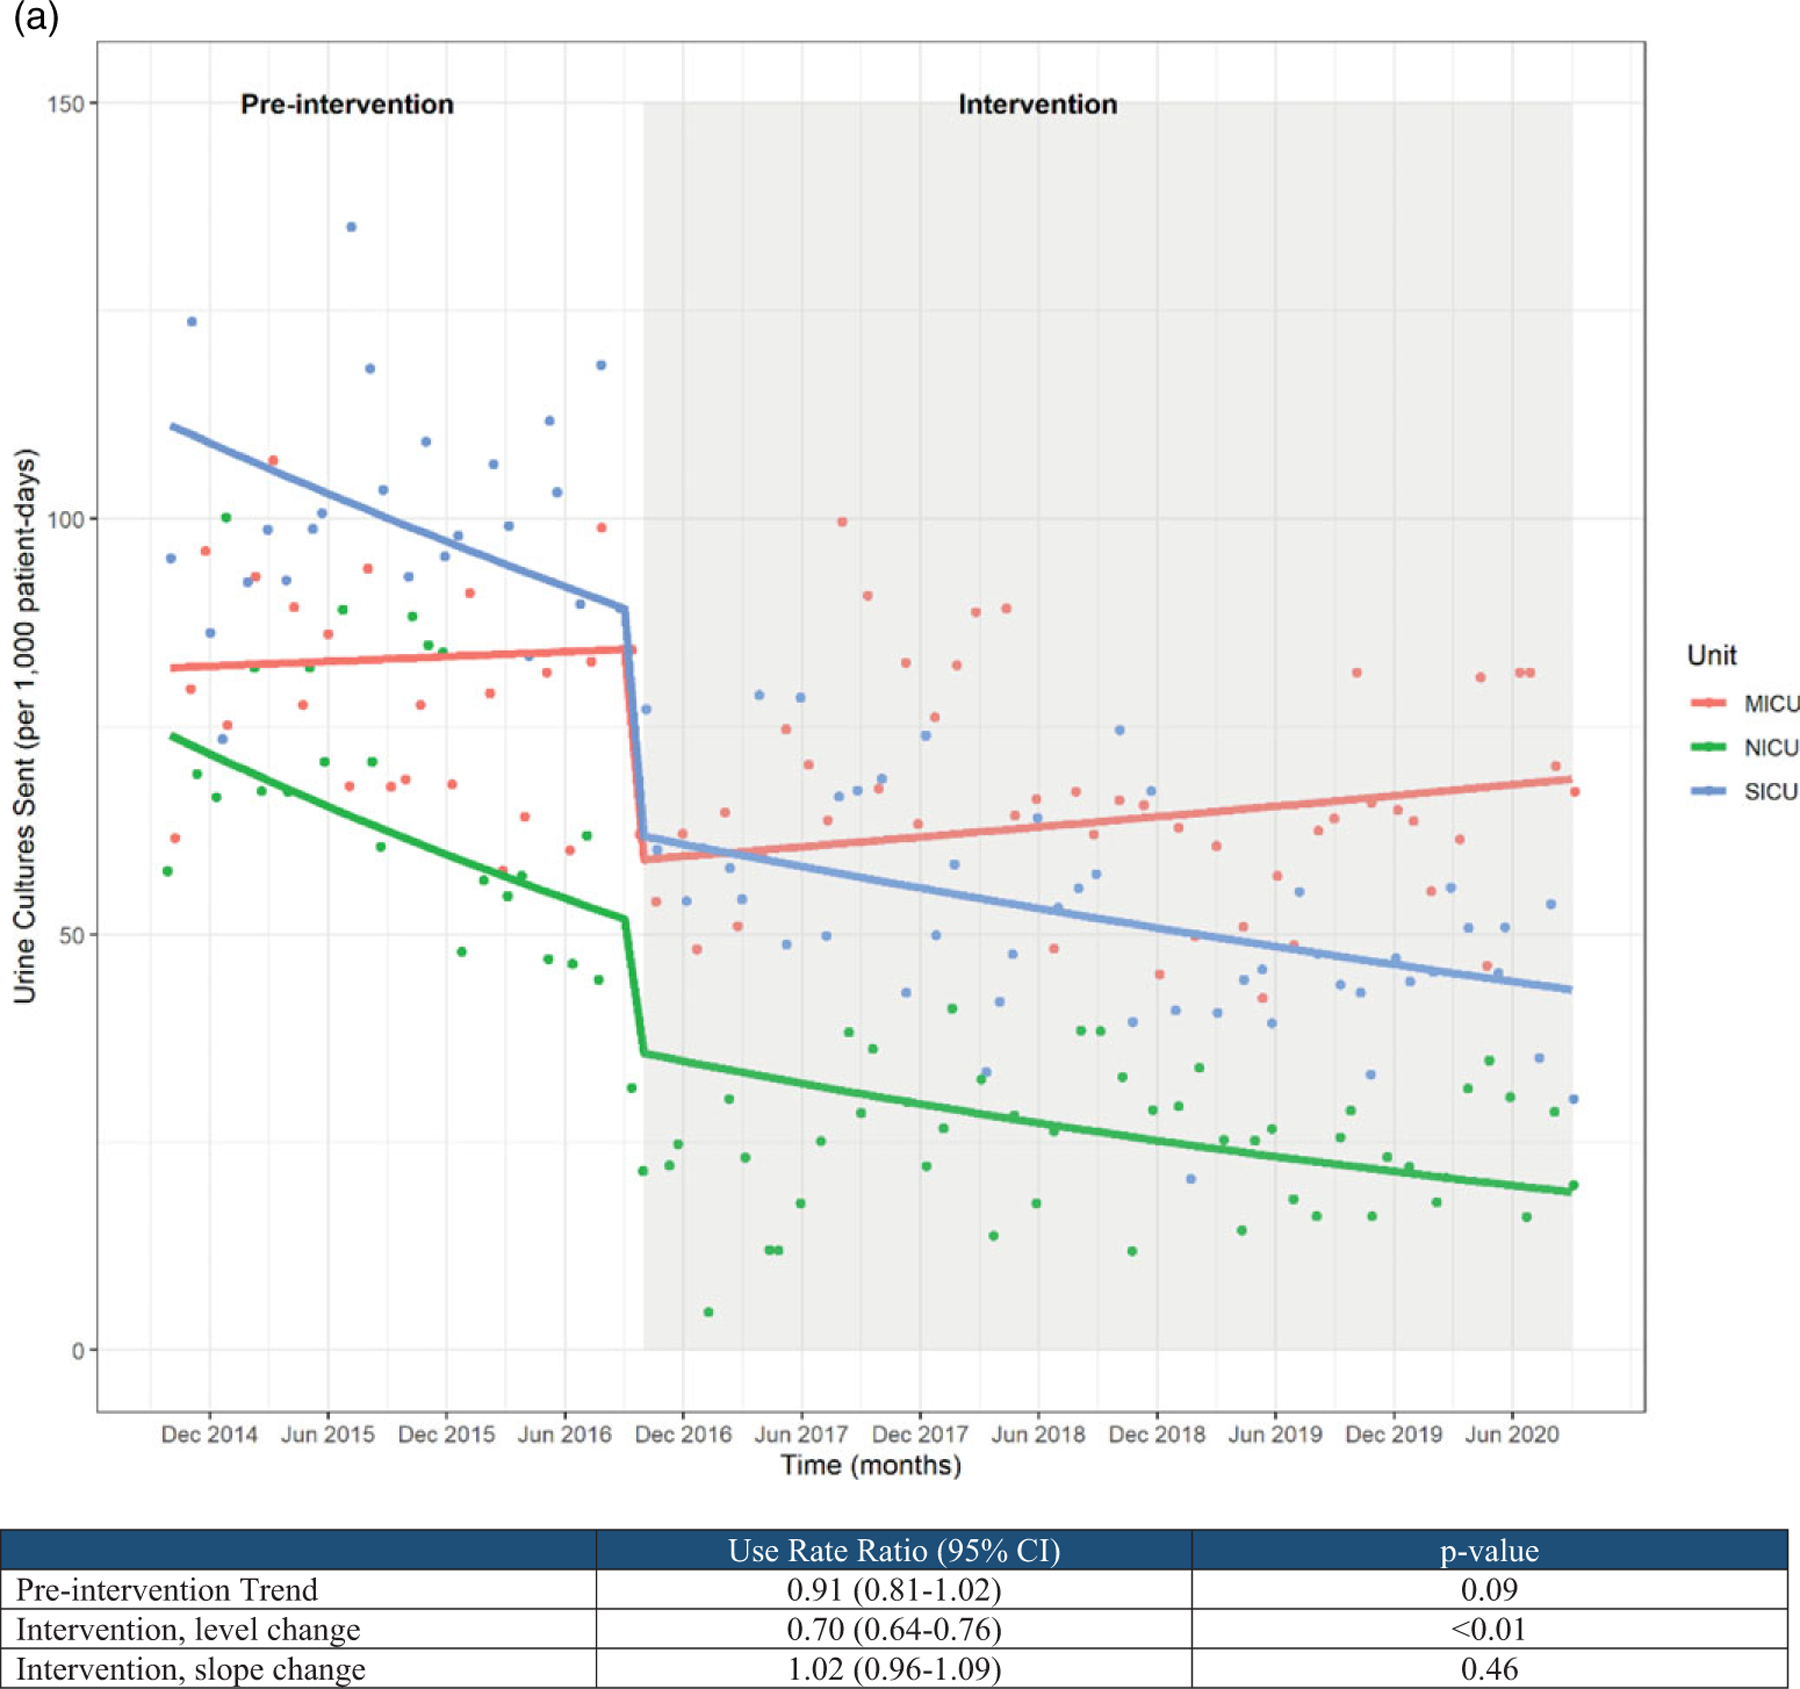
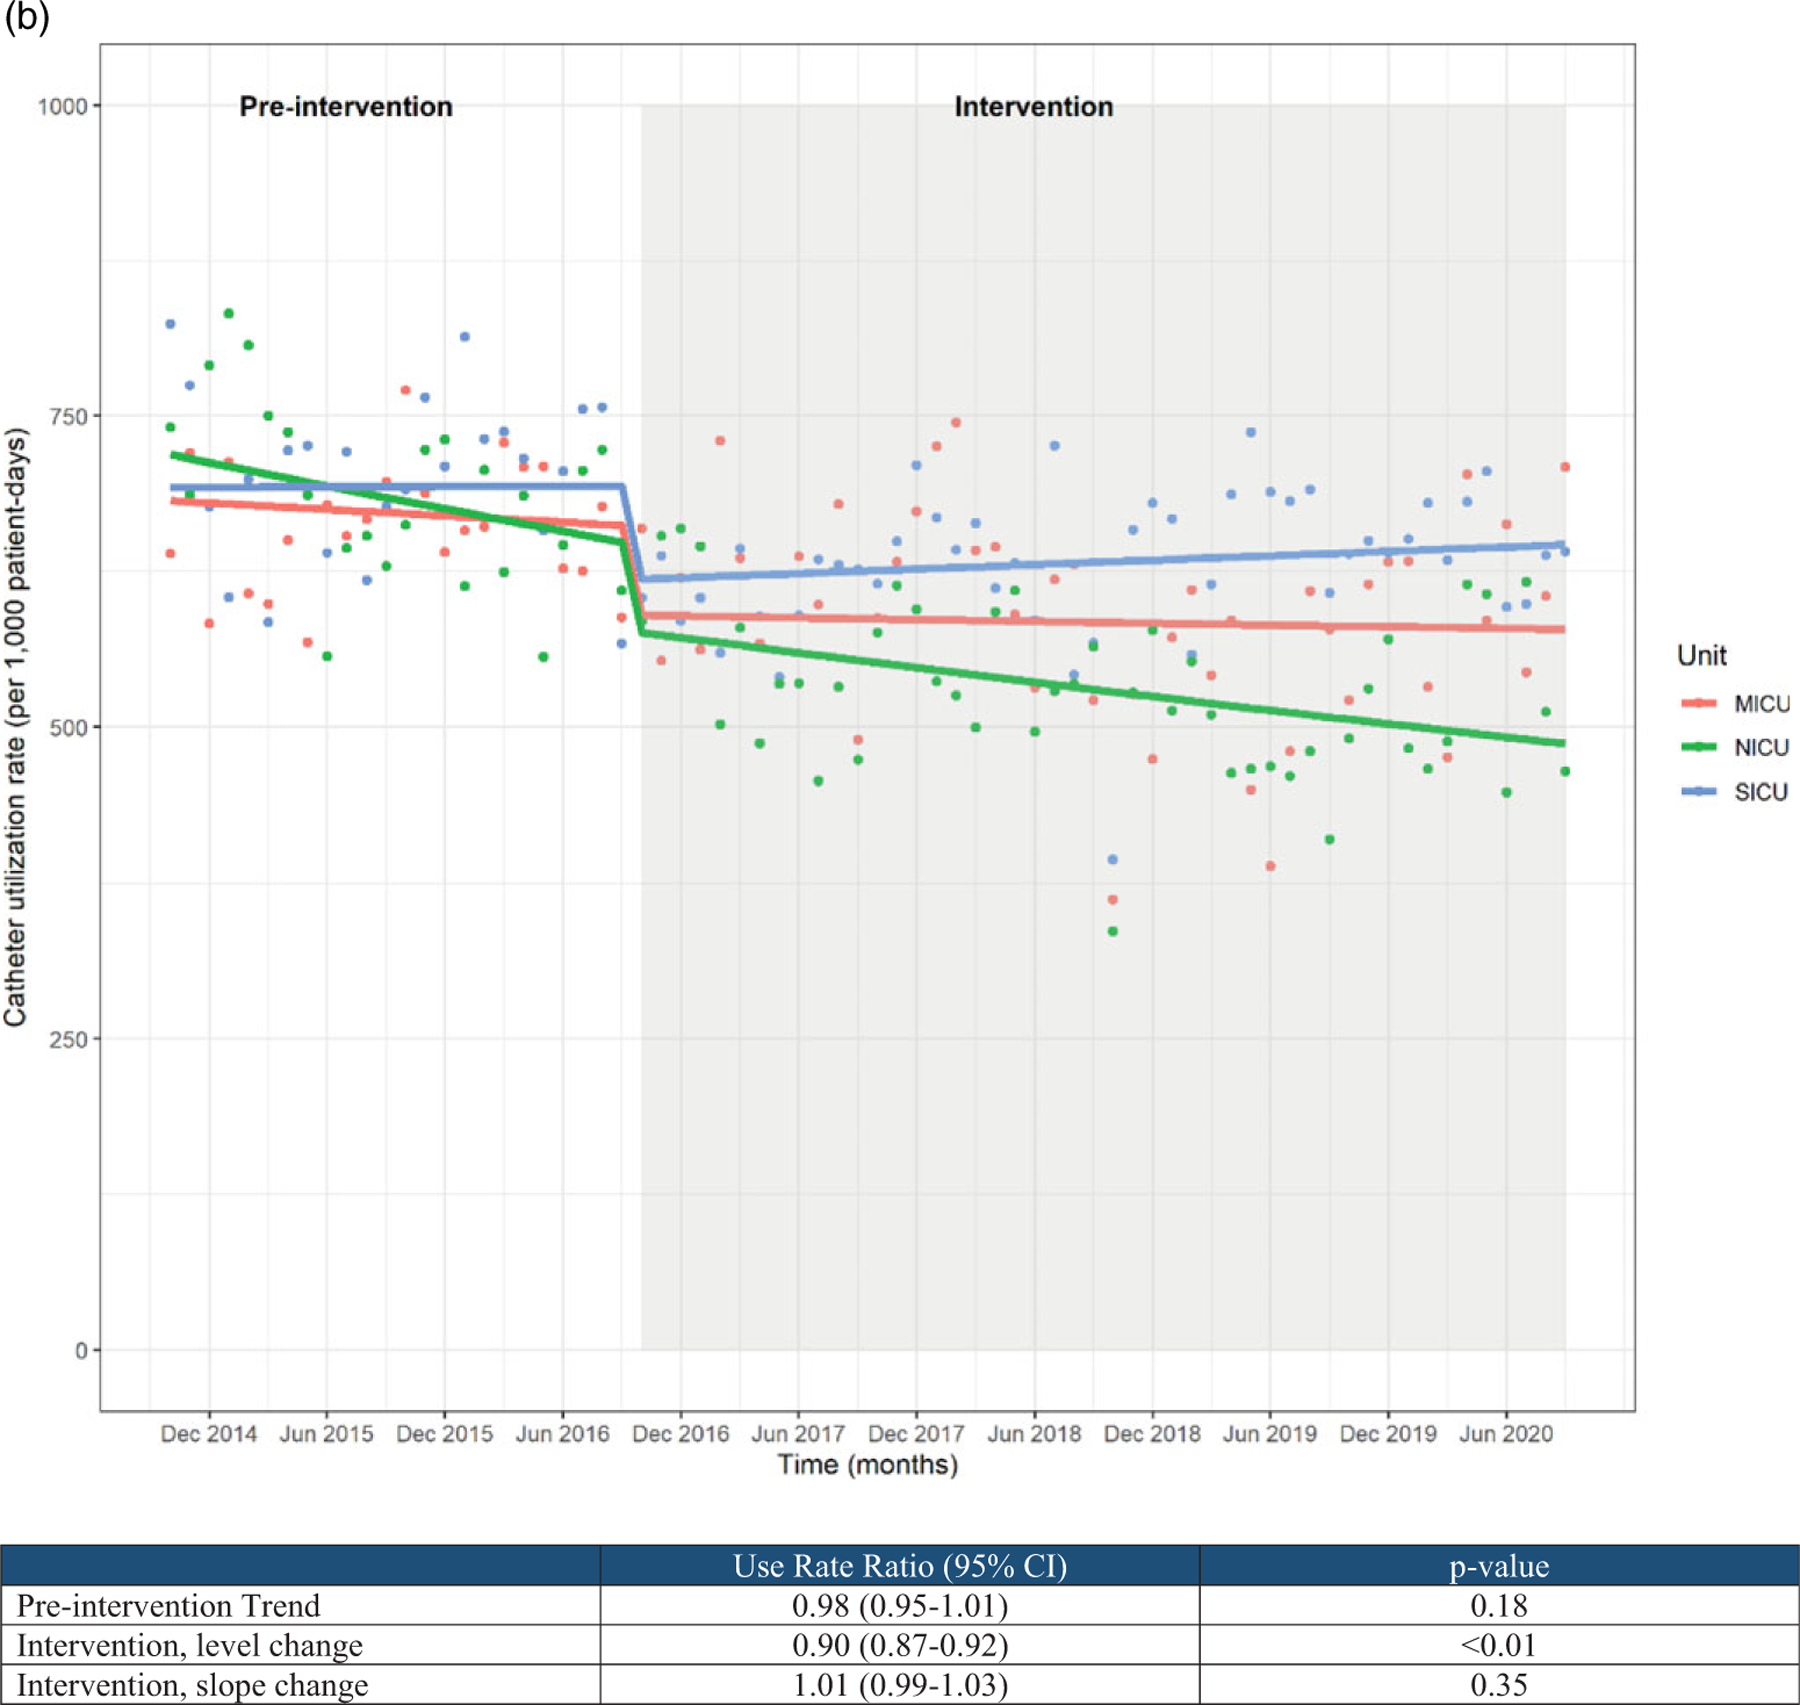
Urine culture rates were largely stable in the baseline period but showed a significant level change temporally correlated with the intervention period (use rate ratio, 0.70; 95% CI, 0.64–0.76). No significant slope change was noted following the intervention period (Fig. 1A). The medical ICU saw a slight increase in urine culture rates after the intervention; this could be due changes in nursing and/or infection prevention leadership and/or patient population because this was the primary COVID-19 ICU throughout 2020. Our mixed-effects modeling allows for these differences between units; however, identifying reasons for these differences may be a topic for future study to better inform targeted interventions. Similarly, catheter utilization ratios were largely stable in the baseline period but were temporally associated with a significant level change following intervention (use rate ratio, 0.90; 95% CI, 0.87–0.92). No significant slope change was noted following the intervention period (Fig. 1B).
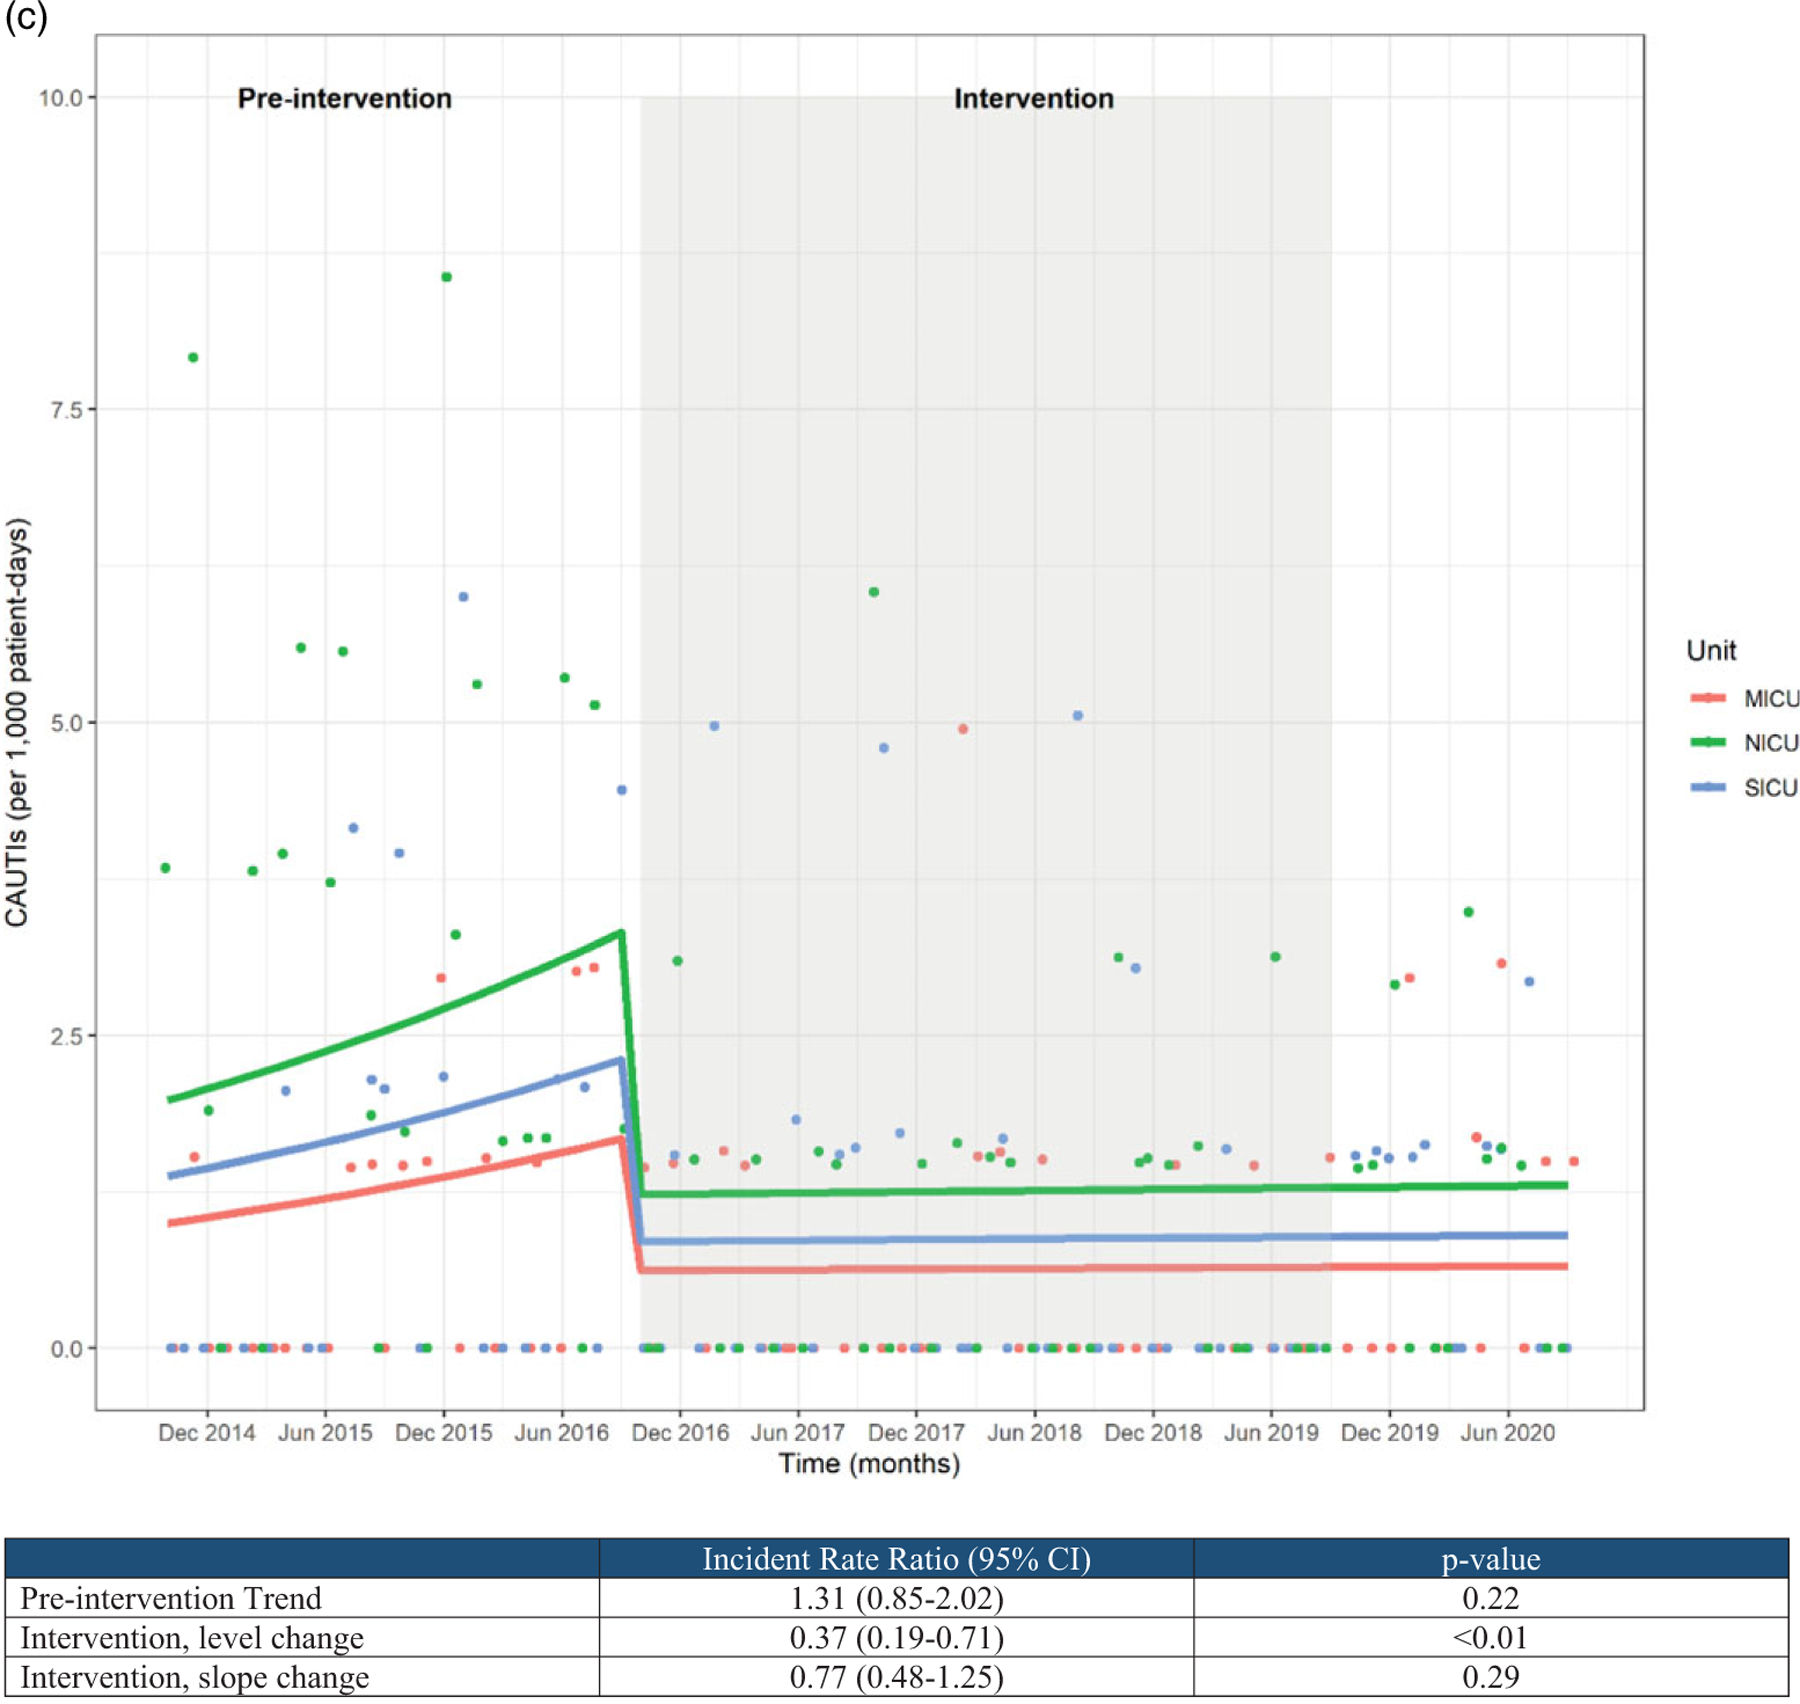
Fig. 1.


(A) Urine culture rates and (B) urinary catheter utilization rates.
CAUTI rates appeared to be increasing during the preintervention period, though this trend did not reach statistical significance (incident rate ratio, 1.31; 95% CI, 0.85–2.02). CAUTI rates showed a significant level reduction temporally associated with the intervention period (incident rate ratio, 0.37; 95% CI, 0.19–0.71) as well as a modest slope reduction over time, though the latter failed to reach statistical significance (Fig. 1C).
Discussion
We report a 4-year sustained reduction in CAUTI rates, number of urine cultures, and catheter utilization achieved with an evidence-based, multifaceted quality improvement intervention. Sampathkumar et al7 found similar reductions in CAUTI rates after implementing a quality improvement project focused on bundle elements and unnecessary urine culture collection.7 Likewise, Davies et al8 implemented standardized urine culturing practices to reduce the risk of false-positive cultures, which resulted in a reduction of CAUTIs over 5 months.8 Also, Mullin et al2 found a reduction in CAUTI rates, urine culture orders, and catheter utilization 1 year after implementing a “stewardship of culturing” intervention. Unlike these previous studies, we report the long-term sustainability of an evidence-based intervention for CAUTI prevention 4 years after implementation.
Our study has some limitations. First, this intervention was performed in 3 ICUs at 1 facility, which may limit the generalizability of these results to other populations such as intermediate or step-down units. Despite all the strengths of interrupted time series analysis, it is never possible to fully exclude potential confounding from concomitant interventions However, to the best of our knowledge, no other systematic interventions were undertaken during this study period. Additionally, being conducted within an academic medical center, we could not control for potential crossover if trainees rotated into or out of intervention units during the study period.
Our multifaceted approach resulted in significant and sustained decreases in urine cultures, catheter utilization and, subsequently, CAUTI rates among 3 ICUs for 4 years. Because this was not a complex change, this practice update has been embedded into the routine practices for these ICUs. Additionally, we chose to use an interrupted time series analysis, which is one of the strongest quasi-experimental designs available when randomized controlled interventions are not possible.9 In doing so, we were able to account for preintervention trends, temporal autocorrelation, and the potential for intervention effects to vary across units. In fact, the very inclusion of 3 separate intervention units helps to assure that our findings might be replicated across diverse intensive care environments.
This intervention relied on champions implementing multiple evidence-based strategies including cognitive aids, education, and real-time feedback to yield sustained improvements in the quality of care provided to patients. This practice can easily be adapted and reproduced by other units and hospitals. Ideally, this practice is implemented along with evidence-based CAUTI insertion and maintenance bundle prevention measures by the nursing staff. Moving forward, healthcare systems should consider investing time and support for champions to lead these types of quality improvement projects. In conclusion, sustainable interventions that yield long-term results rely on multifaceted approaches to significantly improve the quality of patient care.
Supplementary Material
Acknowledgments.
The authors thank Dr Daniel J. Sexton, MD, and Erica Lobaugh-Jin, BSN, RN, CIC, for their support of this project.
Financial support.
No financial support was provided relevant to this article.
Conflicts of interest.
All authors report no conflicts of interest relevant to this article. Dr. Advani is supported by a grant from the National Institutes of Health (grant no. NIH-NIDDK K12-DK100024) and reports grants from the CDC, SHEA, and consulting fees from IPEC Experts, LLC.
Footnotes
PREVIOUS PRESENTATION: This work was presented as an abstract at the Duke Quality & Patient Safety Conference on March 23, 2017, March 22, 2018, and March 21, 2019, in Durham, North Carolina.
Supplementary material. To view supplementary material for this article, please visit https://doi.org/10.1017/ice.2021.135
References
- 1.Catheter-associated urinary tract infections (CAUTIs). Centers for Disease Control and Prevention website. https://www.cdc.gov/hai/ca_uti/uti.html. Published October 1, 2019. Accessed August 31, 2020.
- 2.Mullin KM, Kovacs CS, Fatica C, et al. A multifaceted approach to reduction of catheter-associated urinary tract infections in the intensive care unit with an emphasis on “stewardship of culturing.” Infect Control Hosp Epidemiol 2017;38:186–188. [DOI] [PubMed] [Google Scholar]
- 3.Stagg A, Lutz H, Kirpalaney S, et al. Impact of two-step urine culture ordering in the emergency department: a time series analysis. BMJ Qual Saf 2018; 27:140–147. [DOI] [PMC free article] [PubMed] [Google Scholar]
- 4.Wright M-O, Kharasch M, Beaumont JL, Peterson LR, Robicsek A. Reporting catheter-associated urinary tract infections: denominator matters. Infect Control Hosp Epidemiol 2011;32:635–640. [DOI] [PubMed] [Google Scholar]
- 5.Advani SD, Fakih MG. The evolution of catheter-associated urinary tract infection (CAUTI): is it time for more inclusive metrics? Infect Control Hosp Epidemiol 2019;40:681–685. [DOI] [PubMed] [Google Scholar]
- 6.ACH Surveillance for UTI (CAUTI). Centers for Disease Control and Prevention website. https://www.cdc.gov/nhsn/acute-care-hospital/cauti/index.html. Published October 22, 2020. Accessed October 31, 2020.
- 7.Sampathkumar P, Barth JW, Johnson M, et al. Mayo Clinic reduces catheter-associated urinary tract infections through a Bundled 6-C approach. Joint Comm J Qual Patient Saf 2016;42(6):254–AP4. [DOI] [PubMed] [Google Scholar]
- 8.Davies PE, Daley MJ, Hecht J, et al. Effectiveness of a bundled approach to reduce urinary catheters and infection rates in trauma patients. Am J Infect Control 2018;46:758–763. [DOI] [PubMed] [Google Scholar]
- 9.Wagner AK, Soumerai SB, Zhang F, Ross-Degnan D. Segmented regression analysis of interrupted time series studies in medication use research. J Clin Pharm Ther 2002;27:299–309. [DOI] [PubMed] [Google Scholar]
Associated Data
This section collects any data citations, data availability statements, or supplementary materials included in this article.


