

Abstract
Deoxyguanosine kinase (DGUOK) deficiency causes mtDNA depletion and mitochondrial dysfunction. We reported long survival of DGUOK knockout (Dguok−/−) mice despite low (<5%) mtDNA content in liver tissue. However, the molecular mechanisms enabling the extended survival remain unknown. Using transcriptomics, proteomics and metabolomics followed by in vitro assays, we aimed to identify the molecular pathways involved in the extended survival of the Dguok−/− mice. At the early stage, the serine synthesis and folate cycle were activated but declined later. Increased activity of the mitochondrial citric acid cycle (TCA cycle) and the urea cycle and degradation of branched chain amino acids were hallmarks of the extended lifespan in DGUOK deficiency. Furthermore, the increased synthesis of TCA cycle intermediates was supported by coordination of two pyruvate kinase genes, PKLR and PKM, indicating a central coordinating role of pyruvate kinases to support the long-term survival in mitochondrial dysfunction.
Introduction
DGUOK is a nuclear-encoded mitochondrial enzyme that provides dAMP and dGMP as precursors for mitochondrial DNA (mtDNA) replication (1). The other, also nuclear-encoded, mitochondrial nucleoside kinase is thymidine kinase 2 (TK2) and it provides dTMP and dCMP, and thus, DGUOK and TK2 together provide all four necessary precursors for mtDNA synthesis (2,3). Mutations in DGUOK primarily cause a hepatocerebral form of mitochondrial depletion syndrome (OMIM reference numbers: 251880) (4). Liver damage, as a result of low mtDNA levels predominantly in liver tissue, is characteristic for patients with DGUOK deficiency. Other organs can also be affected, and neurological dysfunction is the most common additional symptom. Defects in TK2 lead to a myopathic form of mtDNA depletion syndrome (OMIM reference numbers: 609560) and has been described both with early onset in childhood and milder cases with onset at adult age (5,6). Currently, there are limited treatment options for both DGUOK and TK2 deficiency and severely affected individuals often die at an early age. These genetic defects cause mtDNA deficiency by a similar mechanism that results in loss of mtDNA precursors although with differences in the clinical pictures. It is not known why several genetic disorders, with common downstream effects that cause mitochondrial dysfunction, are very different in their clinical presentations (7). Well-defined animal models are valuable tools to investigate the complexity and the apparent tissue-specificity of such mitochondrial diseases.
We have previously generated and characterized both a Tk2−/− and a Dguok−/−mouse model (2,8). Both models developed very low levels of mtDNA in organs similar to observations in affected humans. The Tk2−/− mice had the lowest mtDNA levels in skeletal muscle while the Dguok−/− mice were mainly affected with low mtDNA levels in liver tissue. The Tk2−/− mice had a concise life span of 2–3 weeks whereas the Dguok−/− mice were investigated up to 5 months of age. At this time point, the mice were still eating and behaved normal. Therefore, we decided to extend the observation period to investigate the pathogenic progression and metabolic adaptations during prolonged periods of dysfunctional mitochondria with the overall goal to get insights that could enable development of new treatment options for mtDNA depletion syndromes. A precise phenotypic observation in both Tk2−/− and Dguok−/− mice was the low body weight caused by a complete loss of fat tissue (2,9). However, the metabolic pathways and their regulations underlying the phenotypical changes remain unclear. In the present study we used transcriptomics, proteomics and metabolomics to study our Dguok−/− model with its well-defined mitochondrial alterations.
Our results indicated no or minimal changes in the disease manifestations from the disease progression stage (5 months) to the late stage (12 months). During this time period mtDNA were stable at very low levels in liver tissue of Dguok−/− mice. A major phenotype of the affected mice was a complete loss of visible fat tissue suggesting metabolic alterations. The multi-omics analysis showed that at the early stage, the serine de novo synthesis and folate-mediated one-carbon metabolism were activated. At a later stage of the mitochondrial dysfunction, the major metabolic alterations were increased synthesis of TCA intermediates, increased degradation of branched amino acids and an activated urea cycle. Unexpectedly, our analysis showed that the levels of mtDNA and mtDNA-encoded mRNAs were not parallel to each other. In addition, we discovered that the translation of mtDNA was decreased in Dguok−/− mice, consistent with a systematic down-regulation of mitochondrial ribosome proteins and low levels of mitochondrial tRNAs. Our study thus demonstrates a dynamic metabolic adaptation that supports the long-term survival of the Dguok−/− mice. Furthermore, our study identified pyruvate kinases to play a crucial role in regulating this metabolic shift.
Results
Low but stable mtDNA and mtDNA-encoded COX1 in the liver of Dguok−/− mice
The previously observed change in fur colour was apparent and complete in 12monthold Dguok−/− mice (Fig. 1A). The average bodyweight of the Dguok−/− mice was approximately 40% compared to the wild-type control mice (Fig. 1B). The mtDNA levels in 12-month-old Dguok−/− mice were determined in liver, skeletal muscle, brain and heart muscle (Table 1). These tissues showed low mtDNA levels compared to wild-type mice although the levels were at similar levels as mice that previously were investigated at the age of 5 months (2). The level of mtDNA in liver tissue was less than 5% compared to wild-type mice. Consistent with the decreased mtDNA copy number, the protein levels of the mitochondrial encoded cytochrome c oxidase subunit 1 (COX1) was decreased in liver. Although not as evident, the protein levels of COX1 were also decreased in brain tissue and skeletal muscle. The protein levels of the nuclear-encoded succinate dehydrogenase subunit A (SDHA) were not affected in the tissues investigated (Fig. 1C).
Figure 1 .
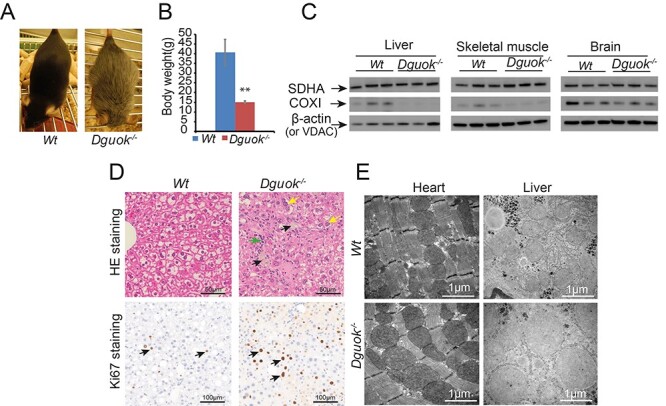
Characterization of 12-month-old Dguok−/− mice. (A) Fur colour change in Dguok−/− mice. (B) Body weight of Dguok−/− mice. (C) Protein expression levels determined with western blot. Loading controls: β-actin (liver and brain) and VDAC (skeletal muscle). (D) Histopathology and Ki67 staining of liver tissues in Dguok−/− mice. For hematoxylin and eosin staining, black arrows indicate pigmented macrophages; green arrow indicates infiltrating inflammatory cells and yellow arrows indicate karyomegaly. For Ki67 staining, black arrows indicate positively stained cells. (E) Ultra-structures of mitochondria in heart and liver. Data are presented as mean value± standard deviation, n = 3, Student t-test **: P < 0.01.
Table 1.
mtDNA copy number (mtDNA copies/diploid nucleus) in different organs in 12-month-old Dguok−/− mice
| Organ | wt | Dguok−/− | P-value |
|---|---|---|---|
| Liver | 2528 ± 600 | 80 ± 28 | 0.002 |
| Skeletal muscle | 7189 ± 4112 | 692 ± 271 | 0.052 |
| Brain | 10 969 ± 2914 | 6455 ± 2631 | 0.117 |
| Heart | 216 7 ± 2061 | 478 ± 82 | 0.229 |
Abnormal histopathology in the liver and kidney tissue in Dguok−/− mice
Histopathology of liver tissue in 12-month-old Dguok−/−mice showed disrupted architecture with mega-hepatocytes, infiltration of inflammatory cells and pigmented macrophages. Besides, Ki67 staining indicated increased hepatocyte regeneration in Dguok−/− mice (Fig. 1D). Transmission electron microscopy data showed abnormal and swollen mitochondria with disrupted cristae in liver cells. However, similar ultrastructure changes were not observed in heart tissue despite ~ 78% lower mtDNA copy number in DGUOK deficient mice (Fig. 1E). Except for liver tissue, histopathology also showed macroscopic changes in kidneys in 12-month-old Dguok−/− mice that were less clear in 5-month-old Dguok−/− mice. The kidneys of the 12-month-old Dguok−/− mice were smaller in size, had a coarse surface and pale colour compared to wild type mice. The disrupted architecture was seen in kidney tissue of both 5- and 12-month-old Dguok−/− mice. The kidneys showed thickening and hyalinization of the glomerular membranes, multifocal glomerular atrophy and sclerosis and cystic tubular dilatations (Fig. 2A). The abnormal changes were more severe in 12-month-old Dguok−/− mice than that in 5-month-old mice. Although histopathological changes have been observed in the kidneys from 5-month-old mice, the mtDNA copy number was not significantly changed (Fig. 2B). In the kidneys of 12-month-old Dguok−/− mice, both the mtDNA copy number and the mtDNA encoded COXI protein was clearly down-regulated (Fig. 2C and D). Moreover, the COXI protein level in 5-month-old Dguok−/− mice was only slightly decreased (Fig. 2D). Interestingly, the levels of nuclear-encoded NDUFB8, a subunit in electron transport chain (ETC) complex I, were lower in the kidneys in 12-month-old Dguok−/− mice compared to wild type mice. However, the nuclear-encoded SDHA, a subunit in ETC complex II, was not changed (Fig. 2D).
Figure 2 .
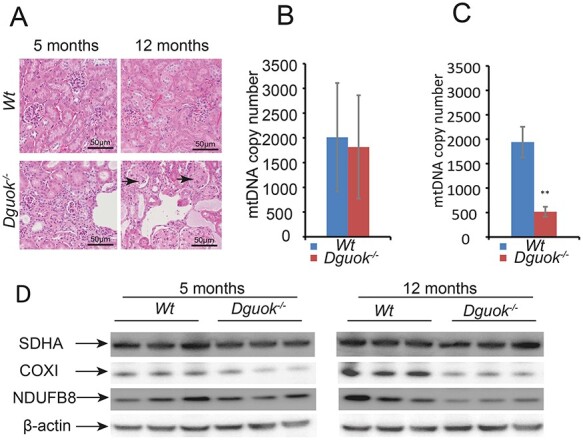
mtDNA depletion in kidney in Dguok−/− mice. (A) Histopathological changes in kidney in 5- and 12-month-old Dguok−/− mice. Arrows: glomerulosclerosis. (B-C) mtDNA copy numbers in (B) 5-month-old and (C)12-month-old Dgouk−/− mice. (D) Protein expression levels determination with western blot. Data are presented as mean value± standard deviation, n = 3, Student’s t-test **: P < 0.01.
Dysfunction of oxidative phosphorylation in Dguok−/− mice
To screen molecular pathways involved in disease progression in the Dguok−/− mice, transcriptomics and proteomics were conducted. The transcriptomics was performed at 2-month-old (disease onset) and 5-month-old Dguok−/− mice (progression stage). The proteomics was performed at 2- and 12-month-old (late stage) Dguok−/− mice. In the transcriptomic analysis a total of 31 873 unique transcripts were detected in both 2- and 5-month-old mice (Fig. 3A). With adjusted P < 0.05 and fold changes equal or more than 2 (≥2) as selection criteria, 409 and 272 transcripts were screened in 2- and 5-month-old Dguok−/− mice, respectively (Fig. 3A). Among these transcripts, 27 in 2-month-old and 8 in 5-month-old mice were mitochondrial protein-encoding genes (Fig. 3A), respectively. Hierarchical clustering and heatmap analysis in 2-month-old mice showed differential expression changes between Dguok−/− and wild type mice (Fig. 3B). The principal component analysis (PCA) further confirmed the accordance between wild type and Dguok−/− mice (Fig. 3C). The differential expression profile was also confirmed in 5-month-old mice (Fig. 3D and E). In proteomics, with adjusted P < 0.05 as selection criteria, 184 and 311 proteins with altered expression were detected in 2- and 12-month-old Dguok−/− mice, respectively. Based on MitoCarta 2.0 (10), 1158 proteins in total are located in mouse mitochondria. 77 out of 184 in 2-month-old and 100 out of 311 in 12-month-old mice, respectively, were proteins located in the mitochondria. More proteins were altered in 12-month-old mice compared to 2-month-old mice (311 vs 184 in total, 100 vs 77 specifics for mitochondria) (Fig. 3F). The pathway enrichment analysis of the differentially expressed proteins from the proteomics analysis further confirmed the dysfunction of mitochondria with oxidative phosphorylation among the top two most affected pathways in the Dguok−/− mice (Fig. 3G and H). Moreover, the pathway enrichment analysis showed that the sirtuin signalling pathway and LPS/IL-1 mediated inhibition of the retinoid X receptor (RXR) function were also affected in Dguok−/− mice (Fig. 3G and H). RXR is a member of the nuclear receptor superfamily and plays critical roles in physiology, including lipid metabolism. RXR can also bind to farnesoid X receptor (FXR) and regulate lipid metabolism, cholesterol to bile acid catabolism and inflammation. We further analyzed the proteins involved in mitochondrial oxidative phosphorylation process, our data showed that the nuclear-encoded members of NADH: ubiquinone oxidoreductases subcomplex (NDUF) (11), which are subunits for ETC complex I, were globally down-regulated both in 2- and 12-month-old mice (Supplementary Material, Fig. S1).
Figure 3 .
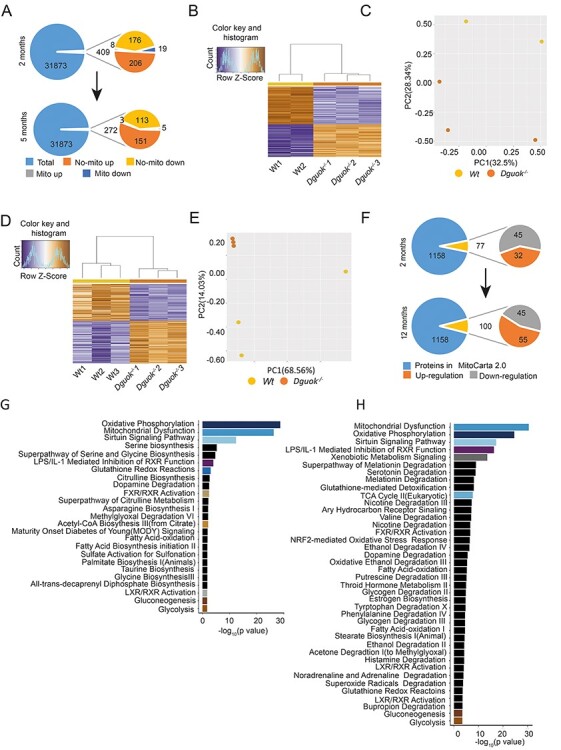
Microarray and proteomic analysis in Dguok−/− mice at different ages. (A) The total and selected genes in 2- and 5-month-old Dguok−/− based on the criteria of FC > 2 and P < 0.05. (B) Heatmap analysis of the transcriptome in 2-month-old Dguok−/− mice. Hierarchical clustering of samples (columns) and genes was based on Pearson’s correlation coefficient to measure the distance and the mean to cluster the samples. (C) PCA of the gene profiles in 2-month-old Dguok−/− mice. (D) Heatmap analysis of the transcriptome in 5-month-old Dguok−/− mice. (E) PCA of the gene profiles in 5-month-old Dguok−/− mice. (F). Selected mitochondrial proteins in 2- and 12-month-old Dguok−/− based on the criteria of P < 0.05. (G) Pathway enrichment of proteins in 2-month-old Dguok−/− mice. (H) Pathway enrichment of proteins in 12-month-old Dguok−/− mice.
Translation inhibition of both mtDNA and nuclear-encoded proteins involved in mitochondrial oxidative phosphorylation
To investigate if the downregulation of proteins involved in mitochondrial oxidative phosphorylation occurred at the transcriptional or translational level, we compared their corresponding mRNA and protein levels. Despite extremely low level of mtDNA (Table 1) and COXI protein level in the liver (Fig. 1C), the transcriptomics data showed that the mRNA level of COXI, and other mtDNA encoded peptide mRNAs, were not significantly decreased neither in 2- nor 5-month-old Dguok−/− mice, with the selection criteria P < 0.05 and FC ≥2 (Fig. 4A and B). Moreover, the levels of two ribosomal RNAs were not significantly affected by the low levels of mtDNA in 2- or 5-month-old Dguok−/− mice. However, the levels of the majority of the mtDNA encoded tRNAs in Dguok−/− were considerably lower than that in wild type mice. The levels of mt-Tr (arginine), mt-Tn (asparagine), mt-Tm (methionine), mt-Th (histidine) and mt-Tf (phenylalanine) were consistently down-regulated at both 2 and 5 months. Next, we analyzed the protein and mRNA levels of nuclear-encoded mitochondrial ribosomal proteins (MRPs) and the NDUF family in liver tissue of 2-month-old Dguok−/− mice. As shown in Figure 4C, the protein levels of most MRP members were highly down-regulated, while their mRNA levels were maintained at levels similar to wild type. The same pattern was also found for the nuclear-encoded mitochondrial NDUF family. Most of the NDUF family members were down-regulated, although the mRNA levels were not significantly changed (Fig. 4D and Supplementary Material, Fig. S1). These data suggest that translation of proteins involved in mitochondrial oxidative phosphorylation, including the mtDNA encoded mRNAs, was inhibited despite the apparent need of mtDNA encoded peptides to maintain the ETC function. Activation of cellular integrated stress responses (ISR) can lead to an inhibition of global protein translation, but induction of selected genes for cell survival. As seen in Supplementary Material, Table S1, the transcriptomics data showed that most of the genes involved in ISR, including Eif2a, Eif2ak3, Ddit3, Ddit4, Cebpb, Cebpd and Asns were up-regulated in Dguok−/− mice. These results indicate that the down-regulated translation of mtDNA encoded peptides, MRP and NDUF families may be due to ISR activation. However, the general expression level of these genes declined in 5-month-old mice compared to 2-month-old mice. Interestingly, Egln3 was initially down-regulated in 2-month-old, but up-regulated in 5-month-old Dguok−/−.
Figure 4 .
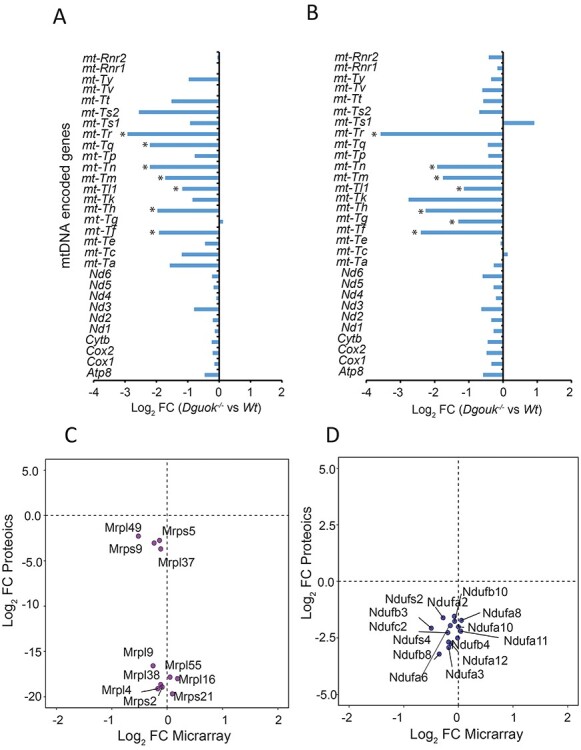
Translation inhibition of mtDNA encoded peptides and proteins from MRP and NDUF families. (A and B) The levels of mtDNA encoded RNAs in (A) 2-month-old and (B) 12-month-old Dguok−/− mice. (C and D) Correlation between transcripts and their proteins for the (C) MRP and (D) NDUF family in 2-month-old mice. n = 3, Student’s t-test*: P < 0.05.
Altered serine de novo synthesis, folate cycle and lipid metabolism in Dguok−/− mice
Activation of ISR has been linked to metabolic change and resistance to oxidative stress (12). Next, we investigated the enrichment of proteins and changes of metabolic pathways that followed the mitochondrial dysfunction and oxidative stress in Dguok−/− mice. During the onset stage of 2-month-old Dguok−/− mice, amino acid biosynthetic pathways, especially for serine, glycine and citrulline, were up-regulated in liver tissue (Fig. 3G). Moreover, glutathione redox reactions and fatty acid metabolism were also affected (Fig. 3G). However, the amino acids biosynthetic pathways were not different in 12-month-old mice compared to the 2-month-old mice (Fig. 3H). As shown in Fig. 3H, the majority of altered pathways were involved in substrate degradation of, for instance, melatonin, serotonin, valine and nicotine. Despite different metabolic profile patterns between 2- and 12-month-old mice, the LPS/IL-1 mediated inhibition of RXR function and FXR/RXR activation was consistent. Serine is synthesized from 3-phophoglycerate, an intermediate from glycolysis, via phosphoglycerate dehydrogenase (PHGDH), phosphoserine transaminase (PSAT1) and phosphoserine phosphatase (PSPH). In the transcriptomic analysis, the three enzymes in serine de novo synthesis were up-regulated (Fig. 5A and B).
Figure 5 .
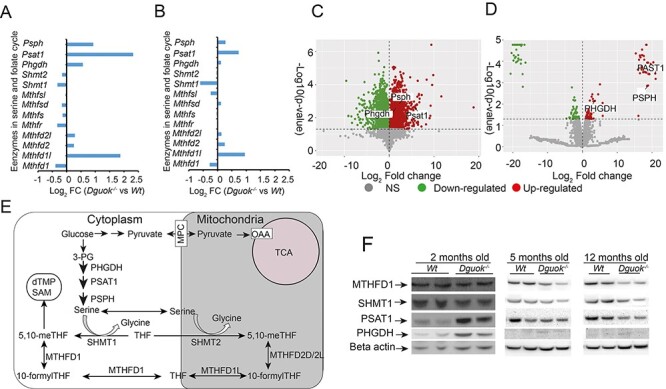
Serine and folate mediated 1C pathway in Dguok−/− mice. (A-B) Transcript levels of the enzymes in serine- and folate-mediated 1C pathway in (A) 2-month-old and (B) 5-month-old Dguok−/− mice. (C-D) Volcano plots of quantitative (C) transcriptomic and (D) proteomic analysis of enzymes in serine de novo synthesis pathway in 2-month-old Dguok−/− mice, representing the relation of the logarithm base 10 of the P-value using Bonferroni’s correction and the logarithm base 2 of fold change (log2FC). (E) Graphical illustration of serine- and folate-mediated 1C pathway. (F) Protein levels determined with western blot.
Moreover, an enzyme in the folate cycle, monofunctional C1-tetrahydrofolate synthase (MTHFD1L), was up-regulated, while serine hydroxy methyltransferase 1 (SHMT1) and C-1-tetrahydrofolate synthase (MTHFD1) were down-regulated in both 2- and 5-month-old mice (Fig. 5A and B). Both the mRNA and protein levels of PHGDH, PSAT1 and PSPH were up-regulated as shown in Figure 5C and D. PHGDH is the rate-limiting enzyme in de novo serine synthesis and SHMT1 links serine and the folate cycle in the cytoplasm (Fig. 5E). Consist with transcript levels, western blot analysis showed that the levels of SHMT1and MTHFD1 declined in Dguok−/− mice from 2 to 5 months of age (Fig. 5F). The protein expression level of PHGDH was increased in 2-month-old Dguok−/− mice compared to wild type but was barely detectable in wild-type and Dguok−/− mice at the age of 5 and 12 months. The expression of the PSAT1 gene also increased in 2-month-old mice but declined in 5- and 12-month-old Dguok−/− mice. These results indicated that the serine de novo synthesis and folate cycle increased at onset stage and decreased at late stage of disease, respectively. A gene set enrichment analysis (GSEA) of the differentially expressed genes from 2- and 12-month-old mice was performed with STRING (https://string-db.org/). Altered fatty acid metabolism was found in both 2- and 12-monthold mice, consistent with the low subcutaneous fat layer observed (Supplementary Material, Table S2). In 2-month-old mice the cytosolic fatty acid biosynthesis was down-regulated, but the enzymes (MECR and MCAT) for mitochondrial fatty acid synthesis were up-regulated. However, enzymes for fatty acid degradation were decreased in 12-month-old mice, probably due to body fat depletion at this stage. These results indicated that serine biosynthesis, the folate cycle and lipid metabolism may play an important role at onset stage of disease, but not at the late stage of Dguok−/− deficiency.
Altered expression of enzymes of the TCA cycle and pyruvate metabolism in Dguok−/− mice
To further identify metabolic alterations that support the survival of mice at the late stage of mitochondrial dysfunction, pathways activated in 12-month-old Dguok−/− mice were investigated. We identified four top activated pathways; 2-oxocarboxylic acid metabolism, branched amino acids (valine, leucine and isoleucine) degradation, TCA cycle and glutathione metabolism (Supplementary Material, Table S2). In the branched chain amino acids (BCAA) degradation pathway, more enzymes were involved at 12 months than at 2 months of age in Dguok−/− mice. The TCA cycle enzymes (IDH2, IDH3B, MDH2, CS and PDHA) and certain mitochondrial inner membrane carriers (MPC, SLC25a5 and VADC2) were significantly up-regulated in 12-month-old Dguok−/− mice (Supplementary Material, Fig. S1B) These results suggested that activation of specific metabolic pathways was linked to the progression of mitochondrial dysfunction (Fig. 6A). Our data suggest that the increased BCAA degradation and the increased TCA cycle activity were linked to the long survival of Dguok−/− mice. Moreover, the results from the integrated transcriptome and proteomics analysis showed that the PKLR expression was consistently down-regulated from early stage to late stage in Dguok−/− mice, while the PKM expression increased with disease progression (Supplementary Tables S3, S4 and Fig. 6A). The downregulation of the canonical enzyme PKLR might limit the flow of intermediates into the TCA cycle, and instead increased the flux of intermediates into other metabolic pathways, for instance serine synthesis and folate cycle at the initial stage of the mitochondrial dysfunction. With the decline of the serine synthesis and folate cycle with progression of the mitochondrial dysfunction, the TCA activity was increased through up-regulation of PKM and increased BCAA degradation (Supplementary Tables S3,S4 and Fig. 6B).
Figure 6 .
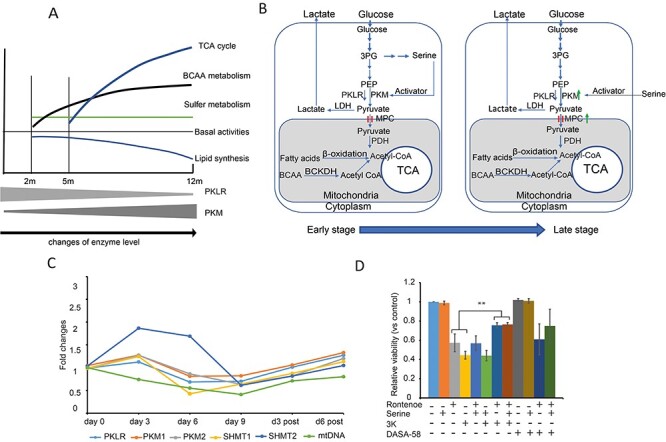
Metabolic shift in the Dguok−/− mice with disease progression. (A) The change in the metabolic pathways and enzymes in pyruvate metabolism. (B) Graphical illustration of the correlation between metabolic change and enzyme profile change. (C) Expression level changes of enzymes in pyruvate, serine and folate metabolism in A549 cells treated with ethidium bromide. (D) Viability of A549 cells treated with rotenone and PKM2 inhibitor (3 K) and activators (DASA-58 and serine). Data are presented as mean value± standard deviation. This experiment was repeated three times independently. One-way ANOVA test **: P < 0.01. PKLR: pyruvate kinase, isozyme in the liver; PKM: pyruvate kinase, M isozyme; PDH: pyruvate dehydrogenase; LDH: lactate dehydrogenase; MPC: mitochondrial pyruvate carrier. BCAA: branched chain amino acid; BCKDH: branched-chain alpha-keto acid dehydrogenase complex.
Pyruvate kinase mediates the interplay between the serine-1C-folate pathway and pyruvate metabolism in an mtDNA depleted cell model
To strengthen our hypothesis of the coordination of PKLR and PKM activities involved in the interplay between the serine-folate cycle and the TCA cycle, we used ethidium bromide (EtBr) to deplete mtDNA in the A549 cell line (13). As shown in Figure 6C, mtDNA copy number progressively declined to 41% after 9 days of EtBr treatment and gradually recovered to 71% and 80% at days 3 and 6 post-EtBr withdrawal, as compared to day 0. The serine hydroxy methyltransferase 2 (SHMT2) level rapidly increased on days 3 and 6 but decreased on day 9 with EtBr treatment. After the withdraw of EtBr, the mRNAs level of SHMT2 returned normal at day 6 post-EtBr withdraw. However, the levels of SHMT1, PKLR, PKM1 and PKM2 mRNAs continually declined parallel to the decrease of mtDNA copy number and then increased after the withdraw of EtBr. The change of directions of SHMT2 and the pyruvate kinases (including PKLR, PKM1 and PKM2) indicates that the flux of glycolytic intermediate into the mitochondrial TCA cycle was reduced to support the mitochondrial 1C cycle. To mimic acute mitochondrial ETC dysfunction, we treated A549 cells with rotenone, an inhibitor of the mitochondrial ETC complex I (14). To manipulate the PKM activity, especially PKM2, we treated cells with PKM2 inhibitor compound 3 K (15), PKM2 activator DASA-58 (16) and serine, respectively. As shown in Figure 6D, only the PKM2 inhibitor compound 3 K can partly rescue the cell viability from rotenone treatment, but not serine and DASA-58. These results support the hypothesis that pyruvate kinases play an important role to coordinate the serine folate cycle and the TCA activity under mitochondrial stress.
Altered metabolites in serum in Dguok−/− mice
Finally, we characterized the metabolite profile in serum from 5- and 12-month-old mice. As shown in Figure 7A, arginine decreased the most among the amino acids, while citrulline was one of the most increased amino acids in 5-month-old mice from targeted amino acids omics analysis. The changing patterns of arginine and citrulline in 12-month-old Dguok−/− mice were similar to those in 5-month-old mice (Fig. 7B). However, serum serine level was not changed in 5- or 12-month-old Dguok−/− mice. In addition to amino acids, we also found that urea levels were elevated in Dguok−/− at both 5 and 12 months (Fig. 7C). Since citrulline, arginine and urea are intermediates of the urea cycle, these results indicated an increased urea cycle activity, which might reflect an active amino acid degradation. Moreover, the levels of serum glycerol-2-phosphate and glycerol-3-phosphate were decreased in 5-month-old mice (Fig. 7C).
Figure 7 .
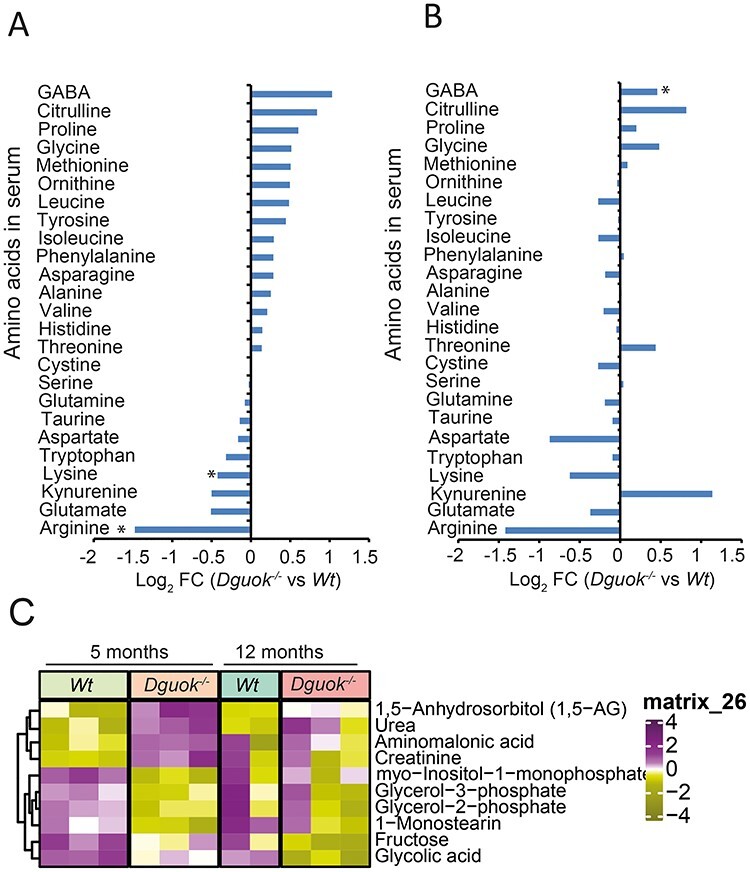
Levels of amino acids in the serum of Dguok−/− mice. (A and B) Amino acids levels in the serum from (A) 5-month-old and (B) 12-month-old mice from targeted amino acids metabolomics. (C) Heatmap analysis of significantly changed serum metabolites in 5- and 12-month-old Dguok−/− mice. Data are presented as mean value± standard deviation, n = 3, Student’s t-test *: P < 0.05.
Discussion
We report causal metabolism and molecular mechanisms that enable extended survival of a DGUOK deficient mouse model with deficient mtDNA levels that were most pronounced in liver tissue. Interestingly, the low mtDNA level was reached already at the age of 5 months and after that remained stable throughout the investigation. The long lifespan of the mice and that they behaved normal made it possible to investigate how the mtDNA deficient mice adjusted to dysfunctional mitochondria, primarily affecting liver tissue. In addition to the liver, kidney tissue was also damaged by DGUOK deficiency and probably contributed to disease progression. It has been shown previously that kidney is an organ affected in several mitochondrial disorders (17–19). Although DGUOK is expressed in all cells and together with TK2 provides all four dNTPs for mtDNA synthesis there is an interesting and unclear tissue specificity of symptoms from DGUOK and TK2 deficiency, as it is for many known mitochondrial disorders. Our data confirm clinical observations that DGUOK deficiency predominately affects the liver, and in our model also kidney, whereas other organs somehow better compensate for the DGUOK deficiency. The nature of such compensatory pathways for mtDNA synthesis in most parts remain unclear. Dividing cells can synthesize dNTPs that can reach the mitochondria through ribonucleotide reductase, but non-dividing cells rely predominantly on the nucleoside kinases (20). The general picture is that mtDNA copy number below a tissue-specific threshold will result in deficient production of mtDNA encoded peptides followed by impaired mitochondrial ETC function, low ATP production and overall deficient mitochondrial functions. The severe alterations that follow DGUOK deficiency should put affected cells in a stressful condition. It is well established that diverse stimuli can activate ISR in cells to restore cellular homeostasis (21,22). Such response can lead to a decrease in global protein synthesis combined with the induction of specific genes to promote cell recovery (21). It has been demonstrated that mitochondrial dysfunction can be part of a general stress response as well as itself activate the ISR (23–26). Recently, it has been shown that mitochondrial stress can be transmitted to the cytosol ISR through the OMA1-DELE1-HRI pathway (27). In our mice, the ISR was constantly activated supported by up-regulation of most of ISR related genes.
As expected, we found that the levels of mtDNA encoded peptides were much lower in liver tissue with low mtDNA copy number than wild type mice. Interestingly, consistent with the hypothesis of a stress response in the affected tissue, the mRNA levels of these mtDNA encoded peptides were not significantly decreased even in 5-month-old mice that had an abnormal phenotype. These results suggested that Dguok−/− mice maintained mRNA templates for peptide translation although mtDNA levels were decreased. This block of translation may be a consequence of activated ISR upon mitochondrial dysfunction.
MRPs are a set of nuclear DNA-encoded proteins responsible for mtDNA translation. Down-regulation of MRPs inhibits the general mtDNA translation (28,29). In our study the families of MRP and NDUF were significantly down-regulated when analyzed in 2-month-old Dguok−/− mice. A similar observation of down-regulated MRPs was done in Hela cells treated with four types of mitochondrial stressors (30). Moreover, we also found that certain mtDNA encoded tRNAs were reduced in Dguok−/− mice. Altogether, our results suggest an effort to rescue the mitochondrial dysfunction in Dguok−/− mice that failed at the mtDNA translational level, maybe due to lack of MRPs and certain types of mitochondrial tRNAs. In our Dguok−/− mice model, the down regulation of the MRP family of proteins and lack of mtDNA encoded peptides, in turn further blocked mtDNA translation although transcripts were present. This vicious cycle might also occur in other types of mtDNA depletion syndromes and further exploration of the specific pathways regulating the translations of MRPs in the mitochondrial integrated stress response might be a strategy to treat certain mitochondrial disorders.
In a mouse model with mitochondrial myopathy, an acute and a chronic mammalian integrated mitochondrial stress response (ISRmt) have been identified (23). The folate cycle was initially activated during the acute phase, and subsequently the serine biosynthesis and transsulfuration pathways were up-regulated. In the later stage the mitochondrial unfolded protein response (UPRmt) was activated. In the Dguok−/− mice, we also observed the level of ISR declined with disease progression. Moreover, at early stage of disease, serine de novo synthesis and folate mediated 1C metabolism was up-regulated. At late stage, an increased flow of intermediates into the TCA cycle was observed in the Dguok−/− mice. The levels of TCA enzymes and mitochondrial carriers were significantly up-regulated, which indicated an increased TCA cycle activity at the late stage of Dguok−/− mice.
Pyruvate links the glycolysis phase and the TCA cycle. Pyruvate kinase is the last rate-limiting enzyme in glycolysis, converting phosphoenolpyruvate to pyruvate (31). There are four isozymes of pyruvate kinase in vertebrates: L (in the liver), R (in erythrocytes), M1 (in muscle and brain) and M2 (in early foetal tissue and most adult tissues). From the onset stage to the late stage in Dguok−/− mice, the PKLR level was consistently down-regulated, while the PKM expression level increased at the late stage. The expression levels of PKM correlated with ISR level inversely. EGLN3 regulates cellular ISR activity through mediating ATF4 stability (32,33). Moreover, PKM2 is one of the targets of EGLN3. Interaction of PKM2 with EGLN3 enhances PKM2 binding to HIF-1α and increases glycolysis (34). The parallel expression pattern between PKM and EGLN3 indicates fine-tuning activities of pyruvate kinases and that play a key role in the metabolic change in Dguok−/− mice. Since PKM1 and PKM2 have a high similarity, PKM in this study represented the total levels of PKM1 and PKM2. At the acute onset stage (2 months), down-regulation of PKLR (the liver form) limited the flux of glycolysis intermediates into the TCA cycle and thereby directed more substrates into the serine de novo synthesis pathway. The synthesized serine can be directed into folate-mediated 1C metabolism, purine synthesis and glutathione synthesis to cope with mitochondrial stress. SHMT1 and SHMT2 link serine and 1C metabolism. They are the cytosolic and mitochondrial forms, respectively (35,36). SHMTs bring 1C from serine into folate 1C cycle. The decline in SHMT1 from the onset stage to the late stage is consistent with the reduced serine synthesis pathway in Dguok−/− mice. In cells treated with EtBr to deplete their mtDNA, SHMT2 initially was up-regulated and then down-regulated with a continuous decrease in mtDNA. However, the levels of PKLR, PKM1, PKM2 and SHMT1 were consistently down-regulated. After withdrawal of EtBr, the expression levels of the four genes recovered. These results indicate that SHMT expression is altered based on the severity of the mtDNA depletion and mitochondrial function. The detection of SHMT1 predominantly in Dguok−/− mice and SHMT2 predominantly in the A549 cancer cell line may reflect that normal tissue depends more on SHMT1, while cancer cells highly express SHMT2 (35,37). When the mitochondrial functions are damaged, the SHMT expression declines. Therefore, the utilization of serine for folate 1C cycle was slowed down and subsequently serine accumulation occurred inside the cytoplasm. Bao et al. demonstrated that intracellular serine accumulation treated with mitochondrial stressors was caused by an increased serine synthesis and meanwhile a decreased serine consumption compared to controls (38). Since the down regulation of serine-folate-mediated 1C metabolism occurred at the late stage of the Dguok−/− mice, supplement of either serine or folate might not alleviate symptoms in affected individuals. Instead, the observed increased flow of intermediates into the TCA cycle may suggest that intervention of TCA cycle intermediates may be a way to develop treatment.
A majority of the up-regulated enzymes in the TCA cycle and of the mitochondrial transporters are directly involved in pyruvate production and transport across the mitochondrial inner membrane. These results indicate an increased pyruvate turnover in the late stage of Dguok−/− deficiency. Since the PKLR level was consistently down-regulated during the disease progression, the increased pyruvate supply might be supported by the up-regulated PKM activity. This mechanism can also explain why the growth of Rho0-cells depends on pyruvate (13). The amino acids including valine, leucine and isoleucine are metabolically linked to energy and TCA activity (39). The increased degradation of these amino acids might be used to support TCA cycle in Dgouk−/− mice. However, the increased amino acid degradation also increased the urea cycle and probably contributed to kidney damage. Through coordinating the activities of PKLR and PKM and increased degradation of branched chain amino acids, the hepatocytes in Dguok−/− mice created a dynamic balance between the TCA cycle, the glutathione metabolism, the sulfur metabolism and the oxidant defence. Signs of oxidative stress were consistent from the onset to the late stage of disease. In the Dguok−/− mice, increased TCA cycle intermediates might help to enhance the antioxidant capacity. The mitochondrial antioxidant enzyme SOD2 was significantly increased at the late stage in Dguok−/− mice. The NAD(P)H/NAD(P) redox state and glutathione production could also be improved through up-regulation of the TCA cycle. It has been shown that pyruvate-supported TCA cycle via pyruvate carboxylase was able to increase the antioxidant capacity in liver (40). Loss of pyruvate carboxylase results in depletion of NADPH and glutathione for the cells to deal with oxidative stress. Recently, improvement of adult-onset mitochondrial myopathy was achieved by intervention of NAD+ levels with niacin (41). Moreover, the protection of liver function through supplement of branched amino acids has also been reported (42–45). Altogether, these studies suggest that supporting the metabolic balance might be a treatment strategy to be evaluated.
In summary, we report the long-term survival of Dguok−/− mice with very low levels of mtDNA predominantly in liver tissue. The integrated multi-omics analysis showed that lack of dNTPs for mtDNA replication is the primary cause of mitochondrial dysfunction. The mitochondrial dysfunction further inhibited mtDNA encoded protein translation via down-regulation of MRPs and mitochondrial tRNAs. The metabolic pathways shifted from serine de novo synthesis and folate 1C cycle to increase of TCA intermediates to support and coordinate pyruvate kinase activity in the Dguok−/− mice. Further identification of specific regulatory pathways responsible for MRPs and mtDNA translation and possible intervention strategies of mitochondrial TCA-related oxidative stress needs to be explored in future studies.
Materials and Methods
Chemicals and kits
Rotenone (Sigma: R8875); PKM2 inhibitor compound 3 k (Sigma: AMBH303C6BA3); DASA-58 (Sigma: SML2853); Serine (Sigma: S4500), Cell Proliferation Kit II (XTT) (Sigma: 11465015001); DNA extraction with DNeasy Blood and Tissue Kit (Qiagen: 69506); RNA extraction with RNeasy Mini Kit (Qiagen: 74106); cDNA synthesis with High-Capacity cDNA Reverse Transcript Kit (Thermo Fisher Scientific: 4368814); Relative quantitative PCR with KAPA SYBR Fast Universal Kit (Sigma: KK4602). Absolute quantification PCR with KAPA PROBE Fast Universal Kit (Sigma: KK4702). Solvents: Methanol, HPLC-grade was obtained from Fischer Scientific (Waltham, MA, USA) Chloroform, Suprasolv for GC was obtained from Merck (Darmstadt, Germany) H2O, Milli-Q. Stable isotopes internal standards: L-proline-13C5, alpha-ketoglutarate-13C4, myristic acid-13C3, cholesterol-D7 were obtained from Cil (Andover, MA, USA). Succinic acid-D4, salicylic acid-D6, L-glutamic acid-13C5,15 N, putrescine-D4, hexadecanoic acid-13C4, D-glucose-13C6, D-sucrose-13C12 were obtained from Sigma (St. Louis, MO, USA).
Animals
The Dguok−/− mice were generated in our lab (2). The homozygous Dguok−/− mice were produced through intercrossing heterozygous Dguok+/− mice. Animals were maintained in group-housing on a 12 h light/12 h dark cycle with free access to water and standard rodent chow. Housing room was maintained at 22–23°C. In each experiment, three Dguok−/− and three wild type control mice were used.
Cell lines
A549 cell line was obtained from ATCC. The cells were cultured in DMEM with 10% heat inactivated FBS and 1% penicillin and streptomycin (Thermo Fisher Scientific) and maintained at 37°C and 5% CO2.
Collection of organs and serum from Dguok−/− mice
Organs were collected from 5- and 12-month-old mice. Parts of the organs were fixed in different fixatives for histological and ultrastructure analysis, respectively. The rest of the organs were snap-frozen in liquid nitrogen and kept at −80°C for future use. The blood was collected in sterile 1.5 mL tubs via cardiac puncture. After 30 min at room temperature, the tubes were centrifuged at 2000 g for 10 min in a refrigerated centrifuge. The serum was collected and stored at −80°C for future analysis.
Cell experiment
For cell viability assay, 5000 A549 cells were seeded in 96-well plate in 100 μL DMEM with 10% heat inactivated FBS and 1% penicillin and streptomycin. After 24 h, the medium was replaced with 100 μL of fresh medium containing rotenone, serine, compound 3 k and DASA-58 at concentrations of 2 μM, 10 mM, 6 μM and 30 μM, respectively. After 48 h, the cell viability was determined with Cell Proliferation Kit II according to the manufacturer’s instruction. The experiment was repeated three times independently. To deplete mtDNA in A549 cells, the cells were treated with ErBt as described by Fernandez-Moreno, et al (13). Briefly, A549 cells were seeded in 10 cm petri dishes. The cells were cultured for 15 days: with ErBt (60 ng/mL) for the first 9 days to deplete mtDNA and without ErBt for the last 6 days to restore mtDNA. The cells were harvested at day 0, 3, 6, 9, 12 and 15, respectively.
Mitochondrial DNA copy number and gene expression levels determined with qPCR
The mtDNA copy numbers in the mouse liver, brain, heart, skeletal muscle and kidney were determined by absolute quantitative PCR as previously described (46). Briefly, total DNA was extracted from mouse tissues with DNeasy blood and tissue kit according to the manufacturer’s instruction. The mitochondrial encoded Nd1 gene was used for mtDNA copy number quantification and the single-copy-nuclear-encoded ribonuclease P RNA component H1 (Rpph1) was used as reference. The standard curves were established with a plasmid containing one copy of each of those two mouse genes as referred above. According to the standard curve, the number of copies from each gene was calculated: mtDNA copies per diploid nucleus = 2 × (mt-Nd1 gene copies/Rpph1 gene copies). The mtDNA copy numbers and gene expression levels of PKLR, PKM1, PKM2, SHMT1 and SHMT2 in EtBr treated cells were determined with relative quantification PCR. The total RNA was purified with RNeasy Mini Kit and the cDNA was synthesized with High-Capacity cDNA Reverse Transcription Kit according to the manufacturer’s instructions. All the primers and probes were synthesized by Sigma and their sequences are listed in Supplementary Material, Table S5.
Histology, immunohistochemistry and western blot analysis
The histological changes were analyzed in liver and kidney tissues. Ki67 staining was performed in liver tissue. For western blot, the tissues were homogenized in radioimmunoprecipitation assay buffer (RIPA) with a tissue disruptor. The RIPA buffer contained 150 mM sodium chloride; 1.0% NP–40; 0.5% sodium deoxycholate; 0.1% sodium dodecyl sulphate; 50 mM Tris, pH 8.0. An amount of 20 μg total protein was loaded for western blot analysis. The primary antibodies used were anti-MTCOI antibody (Abcam: ab14705) for mtDNA encoded peptide in ETC complex IV; anti-SDHA antibody (Abcam; ab14715) and anti-NDUF8 antibody (Abcam: ab110242) were used to nuclear encoded proteins in ETC. Anti-Ki-67 (Abcam: ab92742) was used to detected cell proliferation in liver. Anti-Phosphoserine Aminotransferase (Abcam: ab96136), anti-PHGDH/Malate dehydrogenase (Abcam: ab240744), anti-SHMT1(Abcam: ab186130) and anti-MTHFD1(Abcam: ab226341) were used to investigate serine-folate 1C metabolic pathway. Mouse anti-beta actin (Sigma: A5441) or anti-VDAC1/Porin (Abcam: ab14734) was used as loading control. The secondary antibodies are polyclonal rabbit anti-mouse IgG (Dako: P0260) and donkey anti-rabbit (Santa Cruz: SC2313).
Electron microscopy
The mouse liver and heart tissues were fixed in 2.5% glutaraldehyde and examined by TEM as described (8).
Microarray analysis
Microarray experiments were performed as described in our previous study (2). Briefly, Total RNA was extracted from livers of Dguok−/− and wild type mice, respectively. The arrays were performed with Mouse GENE 2.2–ST Array at the Bioinformatics and Expression Analysis core facility at the Karolinska Institute. The explorative gene expression analysis was carried out in the Qlucore Omics Explorer version 3.2. Two-group comparison was performed using unpaired Student’s t-test and cluster analysis (k-means) at FDR adjusted P(q) < 0.05. Fold change equal or more than 2(FC ≥ 2) and P < 0.05 were used as section criteria for screening differential expressed genes.
Quantitative proteomics analysis
Frozen liver samples were thawed on ice and cut into small pieces before adding 300 μL of 8 M urea in 50 mM ammonium bicarbonate (AmBic) and homogenized using Disruptor Genine for 2 min at 2800 rpm. Homogenization was completed by adding 150 μL of 0.1% ProteaseMAX (Promega) in 10% methanol/50 mM AmBic and run the samples on Disruptor Genine for 2 min at 2800 rpm. The samples were centrifuged at 14 000 g at 4°C for 10 min and the supernatant was used for tryptic digestion overnight at 37°C, following reduction with dithiothreitol and alkylation with iodoacetamide. The peptides were cleaned on C18 HyperSep™ plate with 40 μL bed volume (ThermoFisher Scientific) and dried on a vacuum concentrator (miVac, ThermoFisher Scientific).
Reconstituted peptide samples in 2% acetonitrile (ACN) and 0.1% formic acid (solvent A) were analyzed directly by nanoflow LC–MS/MS and used for label-free quantification or labelled with TMTsixplex™ (ThermoFisher Scientific) following the manufacturer’s instructions and quantified using the reporter ion intensities of TMT reagents.
Unlabelled peptides were separated by reversed-phase chromatography on a 50 cm long EASY-Spray™ on an Ultimate 3000 UHPLC system (ThermoFisher Scientific) in a 120 min linear gradient (4% to 26% ACN/0.1% formic acid). Data were acquired on a Orbitrap™ Fusion™ tribrid mass spectrometer (ThermoFisher Scientific) in data dependent acquisition (DDA) mode in 2 s cycle time, isolating precursors with 120 000 mass resolution in the mass range of 350–1600 m/z with maximum injection time (IT) of 50 ms and dynamic exclusion of 45 s; precursor isolation width of 1.6 Th with high collision energy (HCD) of 30%, resolution of 30 000 and maximum IT of 54 ms in MS2 event. TMT-labelled peptides were separated using the same organic gradient elution conditions. The mass spectrometer was operated with the same settings as above, expect for the precursor isolation width and HCD energy was set 1.4 Th and 35%, respectively.
Proteins were searched against SwissProt mouse database using the search engine Mascot Server v2.5.1 (MatrixScience Ltd, UK) in Proteome Discoverer v2.4 (ThermoFisher Scientific) software environment allowing maximum two missed cleavages. Oxidation of methionine, deamidation of asparagine and glutamine and TMTsixplex (in case of labelled samples only) were set as variable modifications, while carbamidomethylation of cysteine was used as fixed modification. The false discovery rate (FDR) was set to 1%.
Raw protein abundance data were first filtered for empty rows within house script and normalized with NormalizerDE. Normalization with quantile was selected based on NormalizerDE report. Histogram was used to assess that data follows a normal distribution. Dimension reduction was performed using PCA. Batch effect was removed using the ComBat function with default parameters of the sva R package. Batch effects are technical sources of variation that have been added to the samples during handling. The function returns an expression matrix adjusted for the batch. Differential gene expression analysis on proteomics data was performed with R package limma to determine proteins with differential abundance. Benjamini-Hochberg (BH) adjustment was applied. The cut-off for false discovery rate (FDR) was set up to 0.05. Ingenuity pathway analysis (IPA) was used for pathway enrichment analysis. Protein–protein interactions were retrieved from STRING Db (v5.0) (https://string-db.org/) a database of known and predicted interactions between proteins. Interactions were filtered on confidence score with minimum interaction of 0.700. Only interactions from databases and experiences were conserved. Using R (3.6.1) in-house script, Cytoscape network input file was produced using protein–protein and pathways-proteins associations. Cytoscape v 3.6.1 (http://www.cytoscape.org/) was used for network presentation and visualization. For each protein, fold change, P-value and q-value from limma analysis were added to the network. Nodes refer to connected objects in the network and edges to the connections between nodes. For nodes, proteins were represented as octagons and pathways as ellipses. Gradient colour was applied on protein nodes depending on foldchange.
Serum amino acids quantification by LC-ESI-MSMS and sugars by GC-TOF-MS analysis
Metabolomics analysis was performed at Swedish Metabolomics Centre, Umeå, Sweden. Amino acids were extracted by mixing 50 μL plasma with 450 μL 90:10 (v/v) methanol: water solution containing norvaline at 2.2 pmol/μL as an internal standard. Each sample was extracted for 2 min using a mixer mill, incubated in the freezer for 2 h and centrifuged at 4°C, 14 000 rpm, for 10 min; 25 μL of the supernatant was transferred to micro vials and evaporated to dryness in a speed-vac concentrator. Extracted samples were derivatized by AccQ-Tag™ (Waters, Milford, MA, USA) according to the manufacturers’ instructions. Derivatized samples were analyzed using a 1290 Infinitely system from Agilent Technologies (Waldbronn, Germany), consisting G4220A binary pump, G1316C thermostated column compartment and G4226A autosampler with G1330B autosampler thermostat coupled to an Agilent 6460 triple quadrupole mass spectrometer equipped with a jet stream electrospray source operating in positive ion mode. The MS parameters were optimized for each compound. MRM transitions for the derivatized amino acids were optimized using MassHunter MS Optimizer software (Agilent Technologies Inc., Santa Clara, CA, USA). The data were quantified using MassHunter™ Quantitation software B08.00 (Agilent Technologies Inc., Santa Clara, CA, USA) and the amount of each amino acid was calculated based on the calibration curves. The sugars were quantified following the methanol extraction and GC–MSTOF as described previously (47). Briefly, 0.5 μL of the derivatized sample was injected in splitless mode by a L-PAL3 autosampler (CTC Analytics AG, Switzerland) into an Agilent 7890B gas chromatograph equipped with a 10 m × 0.18 mm fused silica capillary column with a chemically bonded 0.18 μm Rxi-5 Sil MS stationary phase (Restek Corporation USA) The injector temperature was 270°C, the purge flow rate was 20 mL min-1 and the purge was turned on after 60 s. The gas flow rate through the column was 1 mL min-1, the column temperature was held at 70°C for 2 min, then increased by 40°C min-1 to 320°C and held there for 2 min. The column effluent was introduced into the ion source of a Pegasus BT time-of-flight mass spectrometer, GC/TOFMS (Leco Corp., St Joseph, MI, USA). The transfer line and the ion source temperatures were 250°C and 200°C, respectively. Ions were generated by a 70-eV electron beam at an ionization current of 2.0 mA, and 30 spectra s-1 were recorded in the mass range m/z 50–800. The acceleration voltage was turned on after a solvent delay of 150 s. The detector voltage was 1800–2300 V.
Quantification and statistical analysis
For the GC–MS data, all non-processed MS-files from the metabolic analysis were exported from the ChromaTOF software in NetCDF format to MATLAB R2016a (Mathworks, Natick, MA, USA), where all data pre-treatment procedures, such as base-line correction, chromatogram alignment, data compression and Multivariate Curve Resolution were performed using custom scripts. The extracted mass spectra were identified by comparisons of their retention index and mass spectra with libraries of retention time indices and mass spectra 3. Mass spectra and retention index comparison was performed using NIST MS 2.0 software. Annotation of mass spectra was based on reverse and forward searches in the library. Masses and ratio between masses indicative of a derivatized metabolite were especially notified. If the mass spectrum according to SMC’s experience was with the highest probability indicative of a metabolite and the retention index between the sample and library for the suggested metabolite was ±5 (usually less than 3) the deconvoluted ‘peak’ was annotated as an identification of a metabolite. Data are expressed as the mean ± standard deviation and were compared by one-way ANOVA test or Student’s t-test. Differences in values were considered significant at P < 0.05.
Data availability
All data needed to evaluate the conclusions in the paper are present in the paper and/or the Supplementary data. All raw mass spectrometry data and protein identification results are deposited to the ProteomeXchange Consortium (http://proteomecentral.proteomexchange.org) via the PRIDE partner repository [Perez-Riverol, Y. et al. The PRIDE database and related tools and resources in 2019: Improving support for quantification data. Nucleic Acids Res. 47, D442–D450 (2019)], (PXD023881). All the codes are available in GitHub https://github.com/neogilab/DGUOK_proteomics.
Supplementary Material
Acknowledgements
The authors would like to acknowledge support from the Swedish Metabolomics Centre, Umeå, Sweden, for metabolomics analysis and Proteomics Biomedicum; Karolinska Institute, Solna, for proteomics.
Conflict of Interest statement. The authors declare that they have no competing interests.
Contributor Information
Xiaoshan Zhou, Division of Clinical Microbiology, Department of Laboratory Medicine, Karolinska Institute, Karolinska University Hospital, Stockholm 141 86, Sweden.
Flora Mikaeloff, Division of Clinical Microbiology, Department of Laboratory Medicine, Karolinska Institute, Karolinska University Hospital, Stockholm 141 86, Sweden.
Sophie Curbo, Division of Clinical Microbiology, Department of Laboratory Medicine, Karolinska Institute, Karolinska University Hospital, Stockholm 141 86, Sweden.
Qian Zhao, Division of Clinical Microbiology, Department of Laboratory Medicine, Karolinska Institute, Karolinska University Hospital, Stockholm 141 86, Sweden.
Raoul Kuiper, Division of Pathology, Department of Laboratory Medicine, Karolinska Institute, Karolinska University Hospital, Stockholm 141 86, Sweden.
Ákos Végvári, Division of Chemistry I, Department of Medical Biochemistry and Biophysics, Karolinska Institute, Stockholm SE-171 65, Sweden.
Ujjwal Neogi, Division of Clinical Microbiology, Department of Laboratory Medicine, Karolinska Institute, Karolinska University Hospital, Stockholm 141 86, Sweden.
Anna Karlsson, Division of Clinical Microbiology, Department of Laboratory Medicine, Karolinska Institute, Karolinska University Hospital, Stockholm 141 86, Sweden.
Funding
The Swedish Cancer Society (grants 20 0681 ReVS 01 H, 20 0730 PjVSF 01 H); Swedish Research Council grants (2017–01330, 2018-06156).
Ethical approval
All animal experiments were approved and conducted following the guidelines of the local ethical committee (S101–15).
Author contributions
X.Z., U.W. S.C. and A. K designed the study. X.Z. and A.K. supervised the project and wrote the manuscript. X.Z. and Q.Z. performed lab experiments. A.V., F.M. and S. C performed proteomics and data analysis.
References
- 1. Johansson, M. and Karlsson, A. (1996) Cloning and expression of human deoxyguanosine kinase cDNA. P. Nat. l Acad. Sci. USA, 93, 7258–7262. [DOI] [PMC free article] [PubMed] [Google Scholar]
- 2. Zhou, X., Curbo, S., Zhao, Q., Krishnan, S., Kuiper, R. and Karlsson, A. (2019) Severe mtDNA depletion and dependency on catabolic lipid metabolism in DGUOK knockout mice. Hum. Mol. Genet., 28, 2874–2884. [DOI] [PubMed] [Google Scholar]
- 3. Saada-Reisch, A. (2004) Deoxyribonucleoside kinases in mitochondrial DNA depletion. Nucleosides Nucleotides Nucleic Acids, 23, 1205–1215. [DOI] [PubMed] [Google Scholar]
- 4. Slama, A., Giurgea, I., Debrey, D., Bridoux, D., deLonlay, P., Levy, P., Chretien, D., Brivet, M., LeGrand, A., Rustin, P.et al. (2004) Deoxyguanosine kinase (DGUOK) mutations in multiple mitochondrial respiratory chain deficiencies. Bba-Bioenergetics, 1657, 24–25. [DOI] [PubMed] [Google Scholar]
- 5. Dominguez-Gonzalez, C., Hernandez-Lain, A., Rivas, E., Hernandez-Voth, A., Catalan, J.S., Fernandez-Torron, R., Fuiza-Luces, C., Garcia, J.G., Moris, G., Olive, M.et al. (2019) Late-onset thymidine kinase 2 deficiency: a review of 18 cases. Orphanet J. Rare Dis., 14, 100. [DOI] [PMC free article] [PubMed] [Google Scholar]
- 6. Finsterer, J. and Ahting, U. (2013) Mitochondrial depletion syndromes in children and adults. Can. J. Neurol. Sci., 40, 635–644. [DOI] [PubMed] [Google Scholar]
- 7. Rusecka, J., Kaliszewska, M., Bartnik, E. and Tonska, K. (2018) Nuclear genes involved in mitochondrial diseases caused by instability of mitochondrial DNA. J. Appl. Genet., 59, 43–57. [DOI] [PMC free article] [PubMed] [Google Scholar]
- 8. Zhou, X.S., Solaroli, N., Bjerke, M., Stewart, J.B., Rozell, B., Johansson, M. and Karlsson, A. (2008) Progressive loss of mitochondrial DNA in thymidine kinase 2-deficient mice. Hum. Mol. Genet., 17, 2329–2335. [DOI] [PubMed] [Google Scholar]
- 9. Zhou, X.S., Kannisto, K., Curbo, S., vonDobeln, U., Hultenby, K., Isetun, S., Gafvels, M. and Karlsson, A. (2013) Thymidine kinase 2 deficiency-induced mtDNA depletion in mouse liver leads to defect beta-oxidation. PLoS One, 8, e58843. [DOI] [PMC free article] [PubMed] [Google Scholar]
- 10. Calvo, S.E., Clauser, K.R. and Mootha, V.K. (2016) MitoCarta2.0: an updated inventory of mammalian mitochondrial proteins. Nucleic Acids Res., 44, D1251–D1257. [DOI] [PMC free article] [PubMed] [Google Scholar]
- 11. Elurbe, D.M. and Huynen, M.A. (2016) The origin of the supernumerary subunits and assembly factors of complex I: A treasure trove of pathway evolution. BBA-Bioenergetics, 1857, 971–979. [DOI] [PubMed] [Google Scholar]
- 12. Harding, H.P., Zhang, Y.H., Zeng, H.Q., Novoa, I., Lu, P.D., Calfon, M., Sadri, N., Yun, C., Popko, B., Paules, R.et al. (2003) An integrated stress response regulates amino acid metabolism and resistance to oxidative stress. Mol. Cell, 11, 619–633. [DOI] [PubMed] [Google Scholar]
- 13. Fernandez-Moreno, M., Hermida-Gomez, T., Gallardo, M.E., Dalmao-Fernandez, A., Rego-Perez, I., Garesse, R. and Blanco, F.J. (2016) Generating Rho-0 cells using mesenchymal stem cell lines. PLoS One, 11, e0164199. [DOI] [PMC free article] [PubMed] [Google Scholar]
- 14. Li, N.Y., Ragheb, K., Lawler, G., Sturgist, J., Rajwa, B., Melendez, J.A. and Robinson, J.P. (2003) Mitochondrial complex I inhibitor rotenone induces apoptosis through enhancing mitochondrial reactive oxygen species production. J. Biol. Chem., 278, 8516–8525. [DOI] [PubMed] [Google Scholar]
- 15. Su, Y.P., Ko, M.E., Cheng, H.J., Zhu, R.H., Xue, M., Wang, J., Lee, J.W., Frankiw, L., Xu, A., Wong, S.et al. (2020) Multi-omic single-cell snapshots reveal multiple independent trajectories to drug tolerance in a melanoma cell line. Nat. Commun., 11, 2345. [DOI] [PMC free article] [PubMed] [Google Scholar]
- 16. Anastasiou, D., Yu, Y.M., Israelsen, W.J., Jiang, J.K., Boxer, M.B., Hong, B.S., Tempel, W., Dimov, S., Shen, M., Jha, A.et al. (2012) Pyruvate kinase M2 activators promote tetramer formation and suppress tumorigenesis (vol 8, pg 839, 2012). Nat. Chem. Biol., 8, 1008–1008. [DOI] [PMC free article] [PubMed] [Google Scholar]
- 17. Dimmock, D.P., Dunn, J.K., Feigenbaum, A., Rupar, A., Horvath, R., Freisinger, P., deCamaret, B.M., Wong, L.J. and Scaglia, F. (2008) Abnormal neurological features predict poor survival and should preclude liver transplantation in patients with deoxyguanosine kinase deficiency. Liver Transpl., 14, 1480–1485. [DOI] [PubMed] [Google Scholar]
- 18. Chen, Y.F., Lin, I.H., Guo, Y.R., Chiu, W.J., Wu, M.S., Jia, W. and Yen, Y. (2019) Rrm2b deletion causes mitochondrial metabolic defects in renal tubules. Sci. Rep-Uk, 9, 13238. [DOI] [PMC free article] [PubMed] [Google Scholar]
- 19. Hall, A.M., Unwin, R.J., Hanna, M.G. and Duchen, M.R. (2008) Renal function and mitochondrial cytopathy (MC): more questions than answers. Qjm-Int. J. Med., 101, 755–766. [DOI] [PubMed] [Google Scholar]
- 20. Wang, L.Y. (2016) Mitochondrial purine and pyrimidine metabolism and beyond. Nucleos. Nucleot. Nucl., 35, 578–594. [DOI] [PubMed] [Google Scholar]
- 21. Girardin, S.E., Cuziol, C., Philpott, D.J. and Arnoult, D. (2021) The eIF2 alpha kinase HRI in innate immunity, proteostasis, and mitochondrial stress. FEBS J., 288, 3094–3107. [DOI] [PubMed] [Google Scholar]
- 22. Zhao, Q., Wang, J.H., Levichkin, I.V., Stasinopoulos, S., Ryan, M.T. and Hoogenraad, N.J. (2002) A mitochondrial specific stress response in mammalian cells. EMBO J., 21, 4411–4419. [DOI] [PMC free article] [PubMed] [Google Scholar]
- 23. Forsstrom, S., Jackson, C.B., Carroll, C.J., Kuronen, M., Pirinen, E., Pradhan, S., Marmyleva, A., Auranen, M., Kleine, I.M., Khan, N.A.et al. (2019) Fibroblast growth factor 21 drives dynamics of local and systemic stress responses in mitochondrial myopathy with mtDNA deletions. Cell Metab., 30, 1040–1054. [DOI] [PubMed] [Google Scholar]
- 24. Munoz-Carvajal, F. and Sanhueza, M. (2020) The mitochondrial unfolded protein response: A hinge between healthy and pathological aging. Front. Aging Neurosci., 12, 581849. [DOI] [PMC free article] [PubMed] [Google Scholar]
- 25. Pakos-Zebrucka, K., Koryga, I., Mnich, K., Ljujic, M., Samali, A. and Gorman, A.M. (2016) The integrated stress response. EMBO Rep., 17, 1374–1395. [DOI] [PMC free article] [PubMed] [Google Scholar]
- 26. Sasaki, K., Uchiumi, T., Toshima, T., Yagi, M., Do, Y., Hirai, H., Igami, K., Gotoh, K. and Kang, D. (2020) Mitochondrial translation inhibition triggers ATF4 activation, leading to integrated stress response but not to mitochondrial unfolded protein response. Biosci. Rep., 40, BSR20201289. [DOI] [PMC free article] [PubMed] [Google Scholar]
- 27. Guo, X.Y., Aviles, G., Liu, Y., Tian, R.L., Unger, B.A., Lin, Y.H.T., Wiita, A.P., Xu, K., Correia, M.A. and Kampmann, M. (2020) Mitochondrial stress is relayed to the cytosol by an OMA1-DELE1-HRI pathway. Nature, 579, 427–432. [DOI] [PMC free article] [PubMed] [Google Scholar]
- 28. Calamita, P., Gatti, G., Miluzio, A., Scagliola, A. and Biffo, S. (2018) Translating the game: ribosomes as active players. Front. Genet., 9, 533. [DOI] [PMC free article] [PubMed] [Google Scholar]
- 29. Rudler, D.L., Hughes, L.A., Viola, H.M., Hool, L.C., Rackham, O. and Filipovska, A. (2020) Fidelity and coordination of mitochondrial protein synthesis in health and disease. J. Physiol-London, 00, 1–14. [DOI] [PubMed] [Google Scholar]
- 30. Quiros, P.M., Prado, M.A., Zamboni, N., D'Amico, D., Williams, R.W., Finley, D., Gygi, S.P. and Auwerx, J. (2017) Multi-omics analysis identifies ATF4 as a key regulator of the mitochondrial stress response in mammals. J. Cell Biol., 216, 2027–2045. [DOI] [PMC free article] [PubMed] [Google Scholar]
- 31. Liu, Z.T., Zhang, C., Lee, S., Kim, W., Klevstig, M., Harzandi, A.M., Sikanic, N., Arif, M., Stahlman, M., Nielsen, J.et al. (2019) Pyruvate kinase L/R is a regulator of lipid metabolism and mitochondrial function. Metab. Eng., 52, 263–272. [DOI] [PubMed] [Google Scholar]
- 32. Koditz, J., Nesper, J., Wottawa, M., Stiehl, D.P., Camenisch, G., Franke, C., Myllyharju, J., Wenger, R.H. and Katschinski, D.M. (2007) Oxygen-dependent ATF-4 stability is mediated by the PHD3 oxygen sensor. Blood, 110, 3610–3617. [DOI] [PubMed] [Google Scholar]
- 33. Yano, H., Sakai, M., Matsukawa, T., Yagi, T., Naganuma, T., Mitsushima, M., Iida, S., Inaba, Y., Inoue, H., Unoki-Kubota, H.et al. (2018) PHD3 regulates glucose metabolism by suppressing stress-induced signalling and optimising gluconeogenesis and insulin signalling in hepatocytes. Sci. Rep-UK, 8, 14290. [DOI] [PMC free article] [PubMed] [Google Scholar]
- 34. Luo, W.B., Hu, H.X., Chang, R., Zhong, J., Knabel, M., O'Meally, R., Cole, R.N., Pandey, A. and Semenza, G.L. (2011) Pyruvate kinase M2 is a PHD3-stimulated coactivator for hypoxia-inducible factor 1. Cell, 145, 732–744. [DOI] [PMC free article] [PubMed] [Google Scholar]
- 35. Ducker, G.S. and Rabinowitz, J.D. (2017) One-carbon metabolism in health and disease. Cell Metab., 25, 27–42. [DOI] [PMC free article] [PubMed] [Google Scholar]
- 36. Pietzke, M., Meiser, J. and Vazquez, A. (2020) Formate metabolism in health and disease. Mol. Metab., 33, 23–37. [DOI] [PMC free article] [PubMed] [Google Scholar]
- 37. Nilsson, R., Jain, M., Madhusudhan, N., Sheppard, N.G., Strittmatter, L., Kampf, C., Huang, J., Asplund, A. and Mootha, V.K. (2014) Metabolic enzyme expression highlights a key role for MTHFD2 and the mitochondrial folate pathway in cancer. Nat. Commun., 5, 3128. [DOI] [PMC free article] [PubMed] [Google Scholar]
- 38. Bao, X.R., Ong, S.E., Goldberger, O., Peng, J., Sharma, R., Thompson, D.A., Vafai, S.B., Cox, A.G., Marutani, E., Ichinose, F.et al. (2016) Mitochondrial dysfunction remodels one - carbon metabolism in human cells. Elife, 5, e10575. [DOI] [PMC free article] [PubMed] [Google Scholar]
- 39. Adeva-Andany, M.M., Lopez-Maside, L., Donapetry-Garcia, C., Fernandez-Fernandez, C. and Sixto-Leal, C. (2017) Enzymes involved in branched-chain amino acid metabolism in humans. Amino Acids, 49, 1005–1028. [DOI] [PubMed] [Google Scholar]
- 40. Cappel, D.A., Deja, S., Duarte, J.A.G., Kucejova, B., Inigo, M., Fletcher, J.A., Fu, X.R., Berglund, E.D., Liu, T.M., Elmquist, J.K.et al. (2019) Pyruvate-carboxylase-mediated Anaplerosis promotes antioxidant capacity by sustaining TCA cycle and redox metabolism in liver. Cell Metab., 29, 1291–1305. [DOI] [PMC free article] [PubMed] [Google Scholar]
- 41. Pirinen, E., Auranen, M., Khan, N.A., Brilhante, V., Urho, N., Pessia, A., Hakkarainen, A., Kuula, J., Heinonen, U., Schmidt, M.S.et al. (2020) Niacin cures systemic NAD(+) deficiency and improves muscle performance in adult-onset mitochondrial myopathy. Cell Metab., 31, 1078–1090. [DOI] [PubMed] [Google Scholar]
- 42. Muyyarikkandy, M.S., McLeod, M., Maguire, M., Mahar, R., Kattapuram, N., Zhang, C.E., Surugihalli, C., Muralidaran, V., Vavilikolanu, K., Mathews, C.E.et al. (2020) Branched chain amino acids and carbohydrate restriction exacerbate ketogenesis and hepatic mitochondrial oxidative dysfunction during NAFLD. FASEB J., 34, 14832–14849. [DOI] [PMC free article] [PubMed] [Google Scholar]
- 43. Park, J.G., Tak, W.Y., Park, S.Y., Kweon, Y.O., Chung, W.J., Jang, B.K., Bae, S.H., Lee, H.J., Jang, J.Y., Suk, K.T.et al. (2020) Effects of branched-chain amino acid (BCAA) supplementation on the progression of advanced liver disease: A Korean Nationwide, Multicenter, prospective, observational, cohort study. Nutrients, 12, 1429. [DOI] [PMC free article] [PubMed] [Google Scholar]
- 44. Ruocco, C., Segala, A., Valerio, A. and Nisoli, E. (2021) Essential amino acid formulations to prevent mitochondrial dysfunction and oxidative stress. Curr Opin Clin. Nutr., 24, 88–95. [DOI] [PubMed] [Google Scholar]
- 45. Sanchez-Gonzalez, C., Nuevo-Tapioles, C., Martin, J.C.H., Pereira, M.P., Sanz, S.S., deMolina, A.R., Cuezva, J.M. and Formentini, L. (2020) Dysfunctional oxidative phosphorylation shunts branched-chain amino acid catabolism onto lipogenesis in skeletal muscle. EMBO J., 39, e103812. [DOI] [PMC free article] [PubMed] [Google Scholar]
- 46. Paredes, J.A., Zhou, X.S., Hoglund, S. and Karlsson, A. (2013) Gene expression deregulation in postnatal skeletal muscle of TK2 deficient mice reveals a lower pool of proliferating myogenic progenitor cells. PLoS One, 8, e53698. [DOI] [PMC free article] [PubMed] [Google Scholar]
- 47. A, J., Trygg, J., Gullberg, J., Johansson, A.I., Jonsson, P., Antti, H., Marklund, S.L. and Moritz, T. (2005) Extraction and GC/MS analysis of the human blood plasma metabolome. Anal. Chem., 77, 8086–8094. [DOI] [PubMed] [Google Scholar]
Associated Data
This section collects any data citations, data availability statements, or supplementary materials included in this article.
Supplementary Materials
Data Availability Statement
All data needed to evaluate the conclusions in the paper are present in the paper and/or the Supplementary data. All raw mass spectrometry data and protein identification results are deposited to the ProteomeXchange Consortium (http://proteomecentral.proteomexchange.org) via the PRIDE partner repository [Perez-Riverol, Y. et al. The PRIDE database and related tools and resources in 2019: Improving support for quantification data. Nucleic Acids Res. 47, D442–D450 (2019)], (PXD023881). All the codes are available in GitHub https://github.com/neogilab/DGUOK_proteomics.