. 2021 Aug 27;10:e66525. doi: 10.7554/eLife.66525

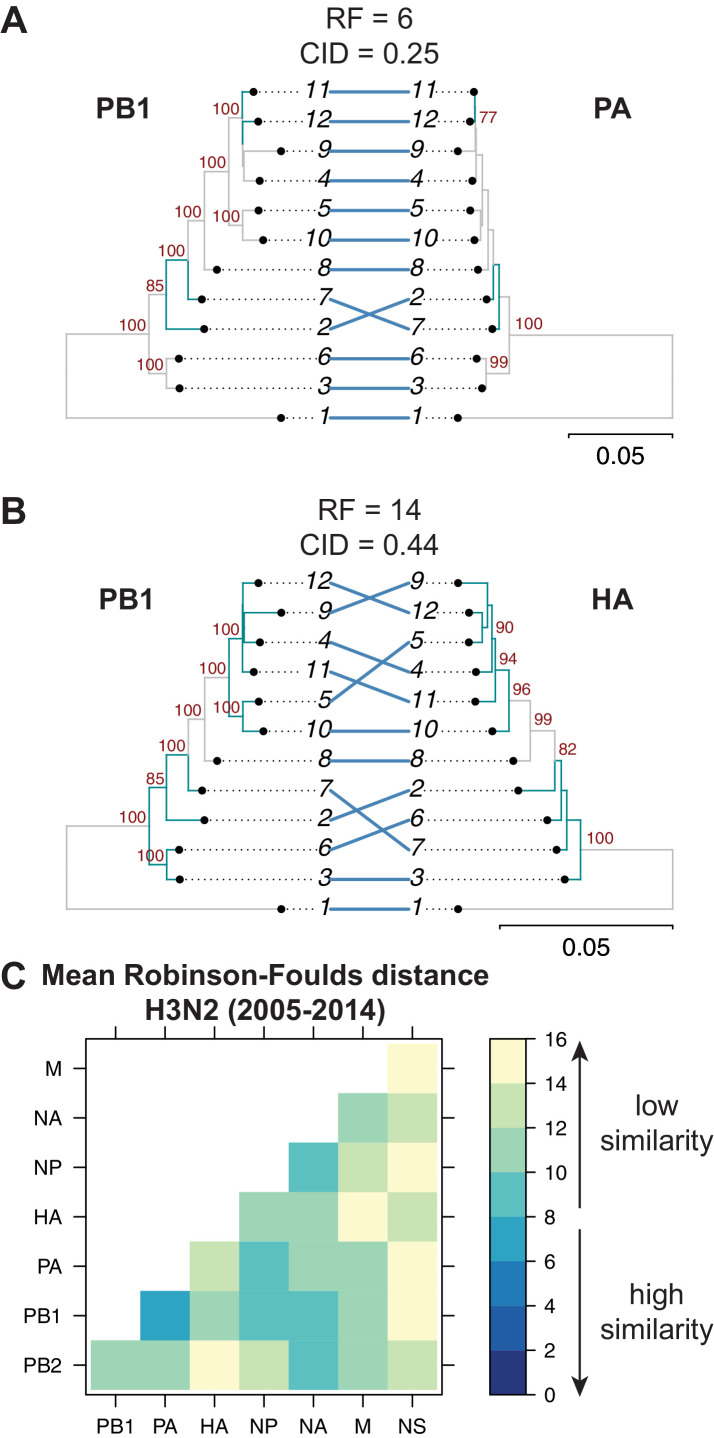
Figure 2. Parallel evolution between viral RNA (vRNA) segments varies in H3N2 viruses from 2005 to 2014.

Seven replicate maximum-likelihood trees were reconstructed for each vRNA gene segment from human H3N2 virus sequences (2005 to 2014) as described in Figure 1. (A–B) Highly similar (PB1 and PA gene segments) (A) or dissimilar (PB1 and HA gene segments) trees (B) from replicate one were plotted as tanglegrams with discrepancies in branch topology highlighted in green. Robinson-Foulds distances (RF) and clustering information distances (CID) are shown above the tanglegram. Intersecting lines map leaves on the left tree to the corresponding leaves on the right. Strains are coded by cluster number; strain identities can be found in Supplementary file 2. Bootstrap values greater than 70 are shown in red. Scale bars indicate substitutions per site. (C) Pairwise RF were calculated between each pair of trees in each replicate. Mean tree distances were visualized in a heatmap. Refer to Figure 2—figure supplement 1 for the standard error of the mean RF of each pair of trees.

Figure 2—source data 1. Mean Robinson-Foulds distance (RF) of pairwise replicate tree comparisons of H3N2 viruses from 2005 to 2014 (corresponding to Figure 2C).

Figure 2.

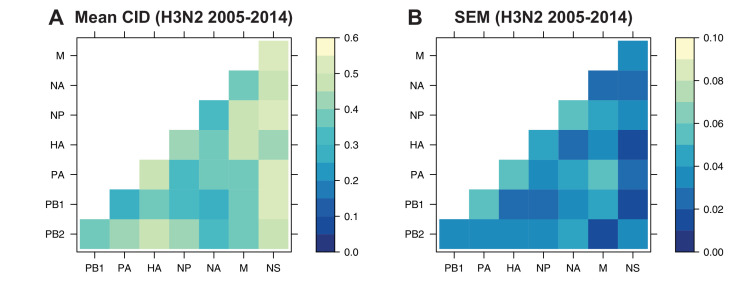
Figure 2—figure supplement 1. The standard error of the mean (SEM) of replicate Robinson-Foulds distances (RF).
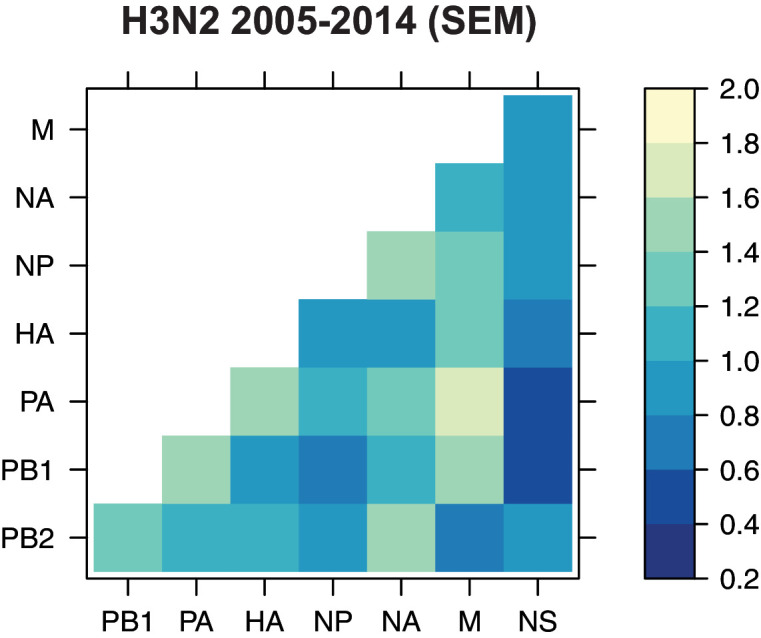
Figure 2—figure supplement 1.

The SEM of all pairwise RF was determined for H3N2 viruses from 2005 to 2014 (corresponding to the mean tree distances shown in Figure 2C).
Figure 2—figure supplement 2. The mean clustering information distance (CID) of replicate viral RNA (vRNA) trees.

Figure 2—figure supplement 2.

The pairwise CID was calculated between each replicate vRNA tree from human H3N2 viruses from 2005 to 2014. The mean CID (A) and standard error of the mean (SEM) of all pairwise CID (B) were visualized in a heatmap.
Figure 2—figure supplement 2—source data 1. Pairwise clustering information distance (CID) for each replicate tree from H3N2 viruses from 2005 to 2014.
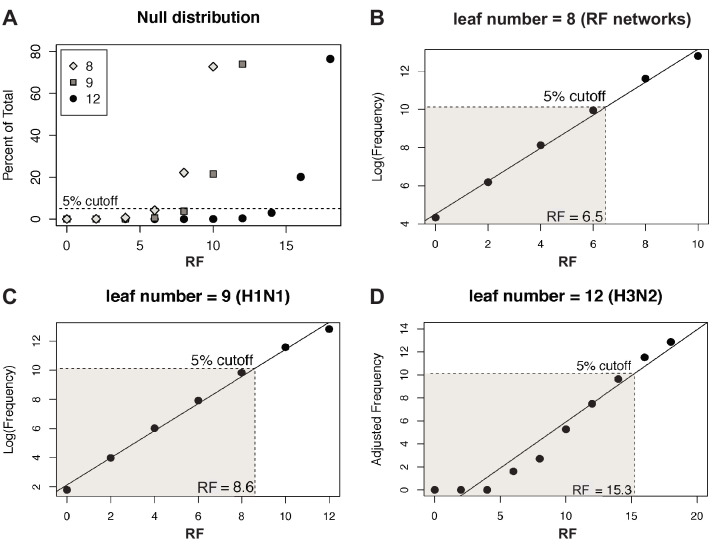
Figure 2—figure supplement 3. Null distribution of Robinson-Foulds distances (RF).

Figure 2—figure supplement 3.

(A) The null distribution of RF in sets of 1000 randomly sampled, unrooted trees with either 8 (gray diamonds, corresponding to the number of tips in tree distance networks), 9 (gray squares, the number of tips in each H1N1 tree), or 12 (black circles, the number of tips in each H3N2 tree) leaf tips was determined. A dashed line demarcates the threshold for the 95% confidence interval. (B–D) The null distributions shown in (A) were log-transformed (B, C) or Yeo-Johnson-transformed (Yeo and Johnson, 2000) (D) and fit to a linear regression model to establish the cutoff for the first five percentiles (shaded region), which was set as the 95% confidence interval cutoff. The distance at which 95% confidence is exceeded is indicated.
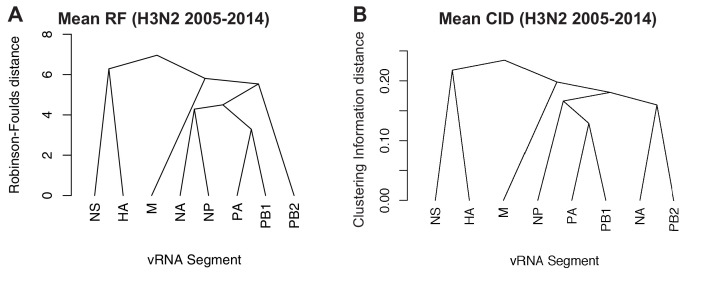
Figure 2—figure supplement 4. Networks determined from pairwise tree distances.

Figure 2—figure supplement 4.

Overall viral RNA (vRNA) relationships corresponding to H3N2 viruses from 2005 to 2014 were assessed with UPGMA trees derived from the mean Robinson-Foulds distance (RF) corresponding to Figure 2C (A) or the mean clustering information distance (CID) corresponding to Figure 2—figure supplement 2A (B). Scale bar corresponds to either RF or CID. The point at which edges merge is equivalent to 1/2 RF or 1/2 CID.