Abstract
Purpose
Drug resistance is one of the main causes of chemotherapy failure in patients with small cell lung cancer (SCLC), and extensive biological studies into chemotherapy drug resistance are required.
Materials and Methods
In this study, we performed lncRNA microarray, in vitro functional assays, in vivo models and cDNA microarray to evaluate the impact of lncRNA in SCLC chemoresistance.
Results
The results showed that KCNQ1OT1 expression was upregulated in SCLC tissues and was a poor prognostic factor for patients with SCLC. Knockdown of KCNQ1OT1 inhibited cell proliferation, migration, chemoresistance and promoted apoptosis of SCLC cells. Mechanistic investigation showed that KCNQ1OT1 can activate transforming growth factor-β1 mediated epithelial-to-mesenchymal transition in SCLC cells.
Conclusion
Taken together, our study revealed the role of KCNQ1OT1 in the progression and chemoresistance of SCLC, and suggested KCNQ1OT1 as a potential diagnostic and prognostic biomarker in SCLC clinical management.
Keywords: LncRNA, KCNQ1OT1, Small cell lung cancer, Prognostic, Chemotherapy
Introduction
Lung cancer is one of the most common malignant tumors and has the highest incidence and mortality rates of all tumors type in the world [1]. Lung cancer includes small cell lung cancer (SCLC) and non–small cell lung cancer (NSCLC), and SCLC accounts for approximately 13%–15% of all lung cancer cases [2,3]. SCLC is the most aggressive type of lung cancer. Although some SCLC patients initially have a good response to chemotherapy drugs, they will develop chemotherapy drug resistance eventually. The poor prognosis of SCLC patients is largely related to chemotherapy drug resistance [4,5]. Therefore, a deep understanding of the mechanisms of chemotherapy drug resistance is urgently needed to develop the effective therapeutic strategies of SCLC patients.
The human transcriptome consists of 2% protein-coding RNAs and 98% non–protein-coding RNAs (ncRNAs) [6]. ncRNA are divided into short ncRNA and long-ncRNA (lncRNAs) according to the size. LncRNAs are a class of transcripts that are longer than 200 nucleotides in length with no ability to encode proteins [7]. Extensive studies have demonstrated that lncRNAs are involved in various biological processes, such as regulating cell proliferation, cell metastasis, cell differentiation and apoptosis [8–10]. With the further understanding of lncRNAs, it is reasonable to believe that the abnormal expression of lncRNAs is related to the occurrence and development of malignant tumors including lung cancer. Recent studies showed that some lncRNAs such as HOTAIR, HOTTIP, and Linc00173 were involved in SCLC chemoresistance. HOTAIR appeared to affect SCLC chemoresistance by regulating HOXA1 DNA methylation [11]. HOTTIP induced SCLC chemoresistance by sponging miR-216a [12,13]. Linc00173 promotes chemoresistance and progression of SCLC by sponging miR-218 to regulate Etk expression [14]. Therefore, analysis of lncRNAs related to chemoresistance in SCLC is important for understanding SCLC chemoresistance.
The purpose of this study was to find the lncRNA related to chemotherapy drug resistance of SCLC cells and determine the underlying molecular mechanism. LncRNA microarray data indicated that lncRNA KCNQ1OT1 was upregulated in chemotherapy drug-resistant SCLC cell lines H69AR. Further research identified the function of KCNQ1OT1 in SCLC and revealed a potential mechanism by which KCNQ1OT1 contributes to chemotherapy drug resistance. We also analyzed the expression and prognosis of KCNQ1OT1 in SCLC patients. Our findings thus will provide new insights into the regulatory mechanisms of KCNQ1OT1 in SCLC tumorigenesis and chemotherapy drug resistance.
Materials and Methods
1. Patients and specimens
A total of 84 lung cancer tissues were obtained from patients who had underwent bronchofiberscopy, biopsy or lobectomy for SCLC diagnosis or surgery during January 2013 to December 2016 at Fujian Medical University Union Hospital and Fujian Provincial Hospital. The non-tumoral lung tissues were obtained from the lung benign diseases including bronchiectasis and pulmonary bulla by thoracoscopic lobectomy.
2. Cell culture
The human SCLC cell lines H69 and H446 and the drug-resistant subline H69AR obtained from the American Type Culture Collection (ATCC). The H446DDP cell was obtained by culturing H446 cell in gradually increasing doses of cisplatin (cDDP) up to 0.8 μM after a total of 14 months in our laboratory according to literature report. All cells lines were cultured in RPMI 1640 containing 10% fetal bovine serum (Gibco, Carlsbad, CA) at 37°C and 5% CO2. The drug-resistant cells were maintained in drug-free medium for at least 2 weeks before any experiment.
3. Microarray analysis
LncRNA microarray analyses were compared between H69AR and H69 cells. Global gene expression in H446DDP stably transfected with shRNA for the knockdown of KCNQ1OT1 or control were evaluated using cDNA microarray analysis.
4. RNA extraction and quantitative reverse transcription polymerase chain reaction
Total RNA was extracted from cells and tumor tissues using the Trizol reagent (Invitrogen, Carlsbad, CA) according to the manufacturer’s instruction. Prime Script RT reagent kit (TIANGEN, Beijing, China) was used to synthesize cDNA from total RNA. Quantitative reverse transcription polymerase chain reaction (RT-qPCR) was used to detect the expression of KCNQ1OT1 and other genes, and performed on an Applied Biosystems StepOne Plus Real-Time PCR System (Takara, Otsu, Japan). Glyceraldehyde 3-phosphate dehydrogenase (GAPDH) was used as an endogenous control. Relative quantification method 2−ΔΔCt was utilized to detect the relative expression of different genes. The sequences of siRNA and shRNA as well as primers were presented in S1 Table.
5. Western blot analysis
Cell proteins were extracted using radioimmunoprecipitation assay buffer. Protein concentrations in lysate were measured by BCA protein assay kit (CoWin Biosciences, Beijing, China). Subsequently, protein sample (60 μg) was separated on 10% sodium dodecyl sulfate polyacrylamide gel electrophoresis and transferred onto Amersham Protran nitrocellulose membrane (GE Healthcare Life Sciences, Fairfield, CT). After blocking with block buffer at room temperature for 1 hour, the membrane was incubated with primary antibodies at 4°C overnight. Finally, the membranes were incubated with secondary antibody for 1 hour. GAPDH was used as control. The proteins were detected by BIO-RAD ChemiDoc XRS+ system (Bio-Rad, Hercules, CA).
6. Cell Counting Kit 8 assay
For Cell Counting Kit 8 (CCK-8) assay, SCLC cells were seeded in a 96-well plat at 5×10³ cells per well for 24 hours. Cells were treated with three kinds of chemotherapy drugs (adriamycin [ADM], Yifei Biotech, Jiangsu, China), cisplatin (cDDP; Qilu Pharma, Shandong, China), etoposide (VP-16; Qilu Pharma) for 24 hours respectively. Each of the test sample was incubated with 10 μL CCK-8 (Dojindo, Kumamato, Japan) solution and measured at 450 nm. The SCLC cells incubated without chemotherapeutic drug were set as control and were utilized to assess the IC50 concentration of each drug.
7. Colony formation assay
For clone formation assay, SCLC cells were seeded in 6-well plates at a density of 200 cells per well for 2 weeks. Then the culture medium was removed, and the cells were stained with 0.1% crystal violet.
8. Flow cytometric analysis
Cells were treated with drugs for 10 hours and then washed twice in cold phosphate buffered saline (PBS) and fixed with 70% ethanol. Apoptosis was detected by Annexin V-fluorescein isothiocyanate according to the manufacturer’s protocol. The samples were all analyzed by flow cytometry (BD FACSVerse, BD Biosciences, San Jose, CA) using FACSuite software (BD Biosciences).
9. Wound healing assay
Wound healing assay was performed to confirm the migration ability. SCLC cells were seeded into a 6-well plates at 1.5×10⁵ cells per well. When cells reached 90% confluence, a wound field was made using a 200 μL pipette tip. Subsequently, all cells were cultured in medium without serum for 24 hours. Images of cells were captured to record the repair process.
10. Transwell assay
To confirm the invasion ability, a transwell invasion assay was carried out. SCLC cells were seeded in the interior of the insert chamber (Corning, New York, NY) with the matrigel-coated membrane. After fixation and staining with 0.1% crystal violet, five random fields were selected and counted.
11. Tumor formation assay
BALB/c nude mice (male, 5 weeks old) were purchased from Sun Yat-Sen University Laboratory Animal Center (Guangzhou, China). All procedures were performed according to the guidelines of the Association for the Assessment and Accreditation of Laboratory Animal Care International. The mice were randomly separated into four groups. Exponentially growing SCLC cells were injected subcutaneously into the flanks of mice (5×10⁶ cells in 100 μL of PBS per animal). Tumor volume was calculated using the formula V=(L×W2)×1/2, where V=volume, L=length, W=width. Tumor size was monitored every 2 days. When the tumors had reached an average volume of about 150 mm3, the mice were treated with cDDP (3 mg/kg, every week) and VP16 (7 mg/kg, every 2 days). The mice were euthanized 28 days after injection.
12. Oligonucleotides and transfections
The siRNA targeting KCNQ1OT1 mRNA (si KCNQ1OT1), siCtrl were synthesized from GenePharma (Shanghai, China). Cells were seeded at a density of 3×10⁵ cells per well in 6-well plates with Dulbecco’s modified Eagle’s medium containing 10% fetal bovine serum for 24 hours. The transfection was performed using lipofectamine 2000 (Invitrogen) according to the manufacturer’s guidelines. The lentiviral particles of shKCNQ1OT1 and sh-control were also synthesized from GenePharma.
13. Statistical analysis
All experiment was performed at least triplicate. Results are presented as the mean±standard deviation of three independent experiments. The difference between the means were tested by the Student’ s t test or One-way ANOVA test. All p < 0.05 were considered statistically significant.
Results
1. Clinical value of KCNQ1OT1 expression in SCLC
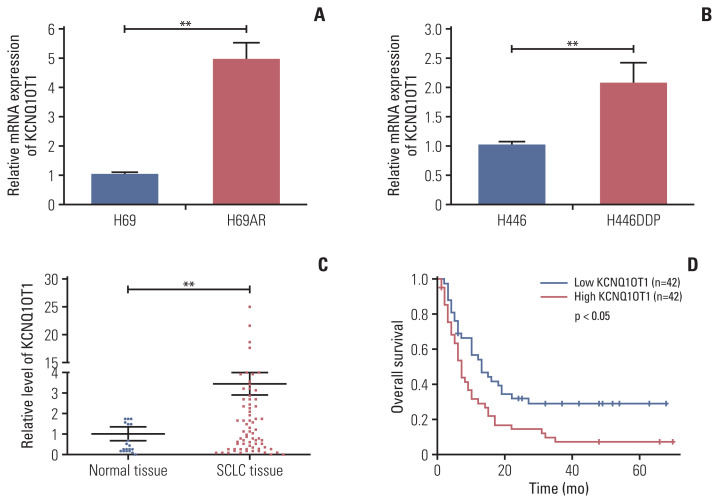
In order to identify lncRNA involved in the progression or development of chemoresistance in SCLC, we compared lncRNA profiles of H69AR cell and H69 cell. In total, 1,521 significant lncRNAs expression differences were observed with up-regulation of 1,024 lncRNAs and down-regulation of 497 lncRNAs in H69AR cell compared with H69 cell. Previous studies have showed that KCNQ1OT1 was abnormally expressed in a variety of tumors [15–18]. Based on the analysis of lncRNA microarray, KCNQ1OT1 expression was upregulated in H69AR cell. Then we found that the expression of KCNQ1OT1 in H69AR cell and H446DDP cell were higher than that in H69 cell and H446 cell by RT-qPCR, respectively (Fig. 1A and B). Meanwhile, the expression of KCNQ1OT1 was detected in SCLC tissues and non-tumoral lung tissues by RT-qPCR. KCNQ1OT1 expression was significantly upregulated in SCLC tissues compared with non-tumoral lung tissues (Fig. 1C). In addition, we further investigated the association between KCNQ1OT1 and clinical features of SCLC patients. Our results indicated that SCLC patients with high KCNQ1OT1 expression had a significantly poor prognosis than those with low KCNQ1OT1 expression (Fig. 1D).
Fig. 1.
High level of KCNQ1OT1 was a poor prognosis factor for patients with small cell lung cancer (SCLC). The expression of KCNQ1OT1 in H69 and H69AR (A), in H446 and H446DDP (B) cells. (C) The expression of KCNQ1OT1 in SCLC tissues and non-tumoral lung tissues. (D) The role of KCNQ1OT1 in the prognosis of SCLC patients. **p < 0.01.
Examination of the correlation between KCNQ1OT1 expression and clinical pathological features showed that a high KCNQ1OT1 expression was correlated with SCLC disease stage, but KCNQ1OT1 expression was not associated with sex, age or smoking history of patients (Table 1). Compared with the patients for high level of KCNQ1OT1, those with low level of KCNQ1OT1 had a good prognosis at limited disease (S2A Fig.). However the expression of KCNQ1OT1 was not associated with prognosis for SCLC patients at extensive-stage disease (S2B Fig.). These results strongly suggested that the upregulated expression of KCNQ1OT1 was a potential prognostic biomarker and may be useful in the development of chemoresistance progression for SCLC.
Table 1.
Association of KCNQ1OT1 with clinical parameters
| Characteristic | No. | Average expression of KCNQ1OT1 | p-value |
|---|---|---|---|
| Age (yr) | |||
| ≤ 60 | 40 | 0.47 | 0.180 |
| > 60 | 44 | 0.36 | |
| Sex | |||
| Male | 76 | 0.42 | 0.340 |
| Female | 8 | 0.36 | |
| Smoking history | |||
| Yes | 65 | 0.40 | 0.450 |
| No | 19 | 0.42 | |
| Disease stage | |||
| Limited disease | 44 | 0.29 | 0.024 |
| Extensive-stage disease | 40 | 0.54 | |
2. The biological functions of KCNQ1OT1 in SCLC
To explore the biological functions of KCNQ1OT1 in SCLC, KCNQ1OT1-siRNA and shRNA were used to manipulate KCNQ1OT1 level in SCLC cells. We designed two specific siRNAs of KCNQ1OT1 and transfect them into SCLC cells, respectively. KCNQ1OT1 expression was measured by RT-qPCR at 24-hour post-transfections. In H69, H69AR, H446 and H446DDP cells, KCNQ1OT1 expression was effectively 50%, 56%, 54%, and 56% knocked down by KCNQ1OT1-si1, 48%, 54%, 68%, and 66% by KCNQ1OT1-si2 compared with negative control cells (Fig. 2A). For stable KCNQ1OT1 RNAi effects, the RNAi sequences were constructed on the KCNQ1OT1 shRNA1 and KCNQ1OT1 shRNA2 vectors, respectively. The knockdown effects were verified by RT-qPCR (Fig. 2B). CCK8 assay showed that knockdown of KCNQ1OT1 expression inhibited proliferation of H69, H69AR, H446, and H446DDP cells (Fig. 2C–F). Next, we found that knockdown of KCNQ1OT1 significantly inhibited the colony formation of H69AR, H446 and H446DDP cells (Fig. 2G). Furthermore, we analyzed the effect of KCNQ1OT1 on the migration and invasion behavior of H69AR, H446, and H446DDP cells. The results showed that knockdown of KCNQ1OT1 were able to inhibit the migration and invasion of H69AR, H446, and H446DDP cells (Fig. 2H and I).
Fig. 2.
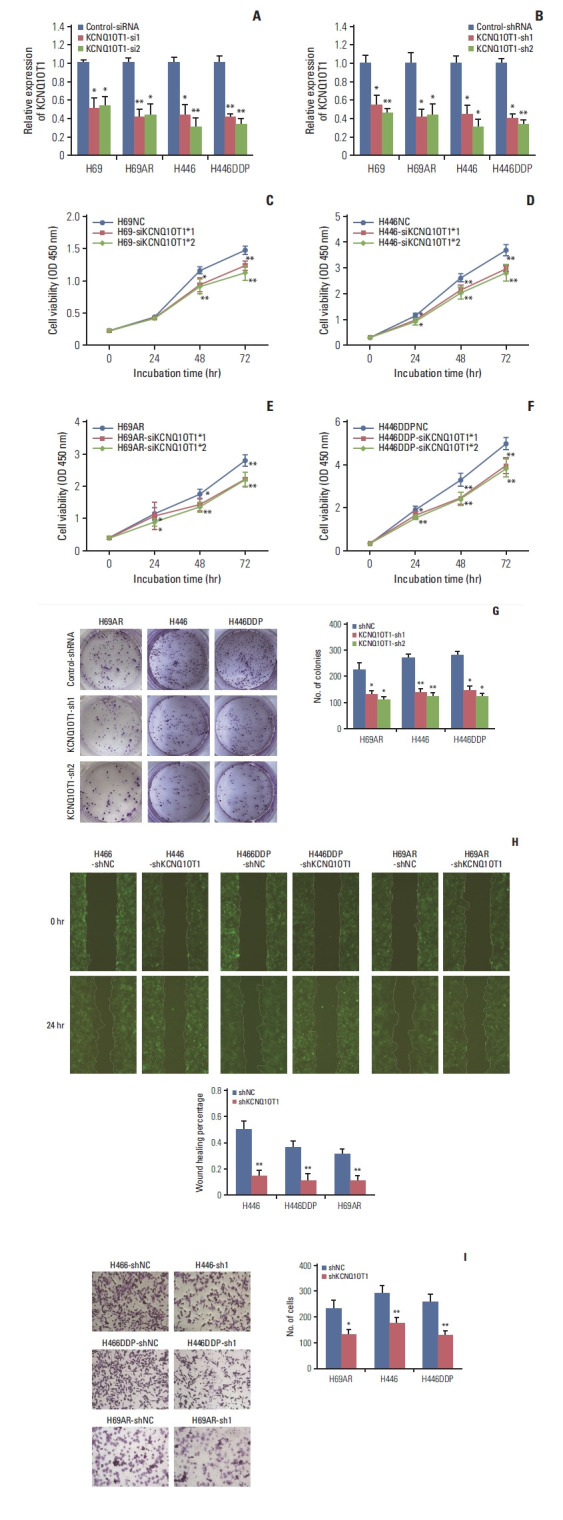
Knockdown of KCNQ1OT1 expression inhibited proliferation, migration and invasion of small cell lung cancer cells. (A) siRNA-mediated knockdown of KCNQ1OT1 expression in H69, H69AR, H446, and H446DDP cells. (B) shRNA-mediated knockdown of KCNQ1OT1 expression in H69, H69AR, H446, and H446DDP cells. The effect of KCNQ1OT1 knockdown on proliferation in H69 (C), H446 (D), H69AR (E), and H446DDP (F) cell using Cell Counting Kit 8 assay. The effect of KCNQ1OT1 knockdown on colony formation (G), migration (H), and invasion (I) in H446, H446DDP, and H69AR cells. *p < 0.05, **p < 0.01.
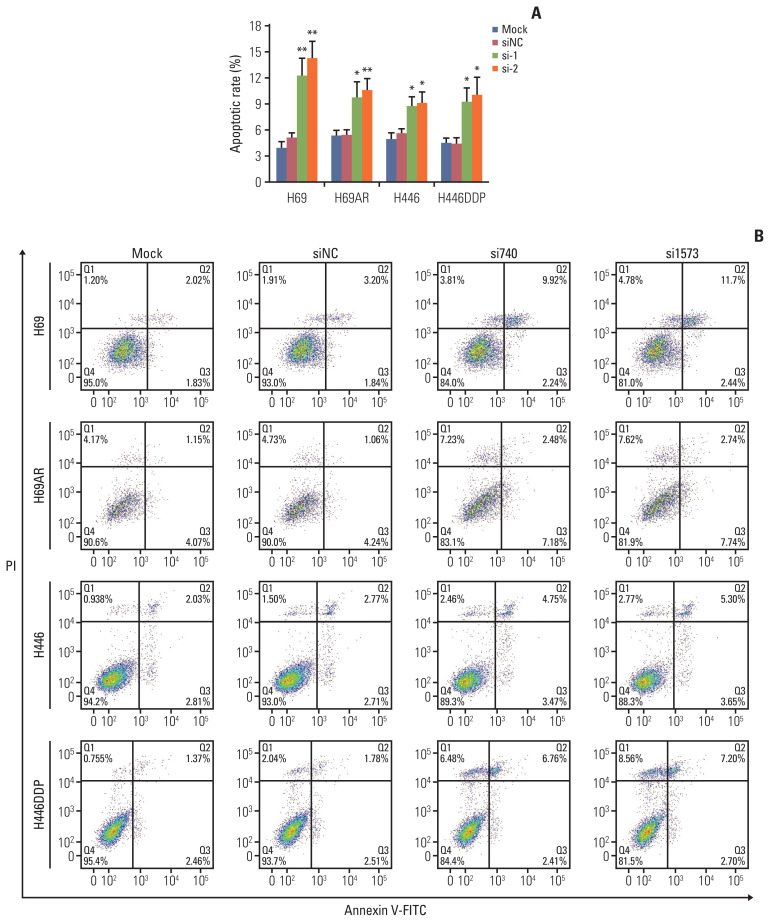
Flow cytometry assay was performed to identify the effect of KCNQ1OT1 expression on SCLC cells apoptosis. As expected, down-regulation of KCNQ1OT significantly promoted H69, H69AR, H446, and H446DDP cells apoptosis compared with negative control cells, respectively (Fig. 3A and B).
Fig. 3.
Knockdown of KCNQ1OT1 expression promoted small cell lung cancer cell apoptosis. Flow cytometric analysis was used for cell apoptosis detection after KCNQ1OT1 knockdown in H69, H69AR, H446, and H446DDP cells. (A) A bar graph demonstrating the rate of apoptosis using flow cytometry analysis. (B) Representative flow cytometry analysis graphs. PI, propidium iodide. *p < 0.05, **p < 0.01.
3. The relationship between KCNQ1OT1 and chemoresistance in SCLC
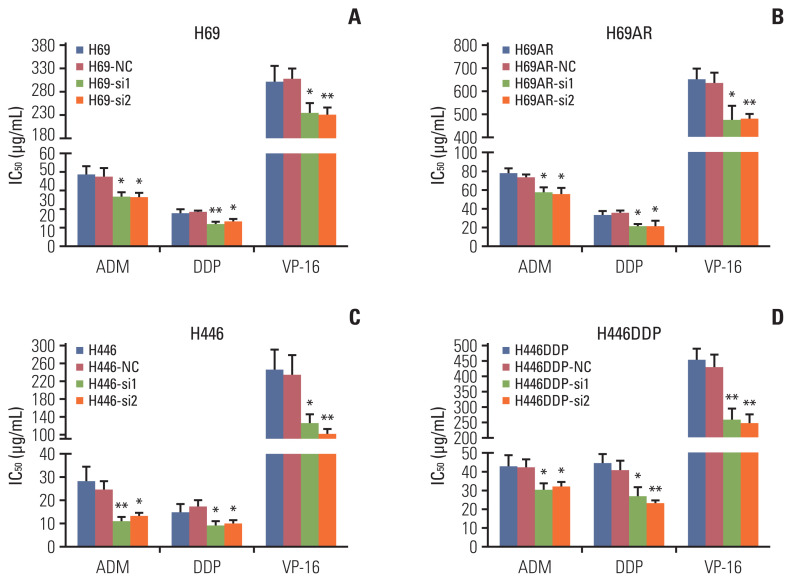
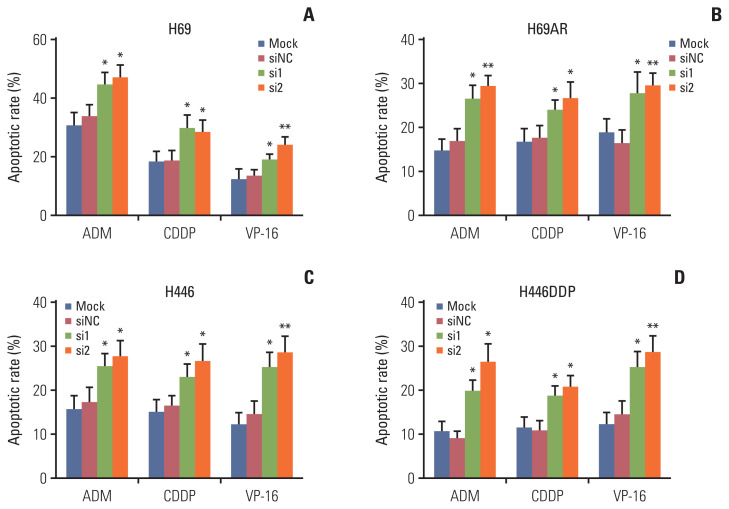
Apoptosis usually affects the resistance of tumor cells to chemotherapy. So we investigated the effect of KCNQ1OT1 expression on the sensitivity of SCLC cells to chemotherapy. H69, H69AR, H446, and H446DDP cells were initially transiently transfect with KCNQ1OT1 siRNA or siRNA NC. Subsequently, the sensitivity of each cell line to ADM, cDDP, or VP-16 was assayed individually. Knockdown of KCNQ1OT1 expression has been proved to significantly improve H69, H69AR, H446, and H446DDP cells chemotherapy sensitivity to ADM, cDDP, and VP-16 (Fig. 4A–D). Cells transfected with siRNA and knockdown was confirmed by RT-qPCR (S3 Fig.). In addition, our data showed that ADM, cDDP, and VP-16 can significantly induce the apoptosis of H69, H69AR, H446, and H446DDP cells after knocking down KCNQ1OT1 expression compared to negative control cells (Fig. 5, S4 and S5 Figs.).
Fig. 4.
Knockdown of KCNQ1OT1 expression resulted in increased chemosensitivity in small cell lung cancer cells. Cells were treated with the indicated dose of drug. IC50 values are as showed for ADM, DDP, VP-16 in H69, H69-NC, H69-si1, and H69-si2 cells (A), in H69AR, H69AR-NC, H69AR-si1, and H69AR-si2 cells (B), in H446, H446-NC, H446-si1, and H446-si2 cells (C), in H446DDP, H446DDP-NC, H446DDP-si1, and H446DDP-si2 cells (D). *p < 0.05, **p < 0.01.
Fig. 5.
Knockdown of KCNQ1OT1 increased apoptosis of cells treated with chemotherapy drugs. Flow cytometric analysis was used for cell apoptosis detection for KCNQ1OT1 knockdown cells treated with chemotherapy drugs. A bar graph demonstrating the rate of apoptosis using flow cytometry analysis in KCNQ1OT1 knockdown H69 (A), H69AR (B), H446 (C), and H446DDP (D) cells. *p < 0.05, **p < 0.01.
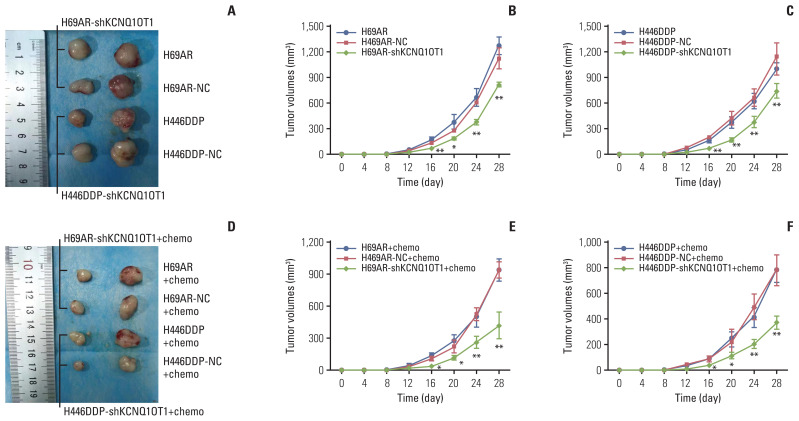
The effect of KCNQ1OT1 to confer chemoresistance was further explored via an in vivo tumor model. As showed in Fig. 6A–C, KCNQ1OT1 knockdown resulted in smaller mice subcutaneous tumor sizes, and intraperitoneal injection of VP-16+cDDP into these mice with KCNQ1OT1 knockdown further restrained the growth of the tumor (Fig. 6D–F).
Fig. 6.
Knockdown of KCNQ1OT1 expression inhibited small cell lung cancer cell chemoresistance and tumorigenesis in vivo. (A) Excised tumors’ image from tumor bearing nude mice in H69AR and H446DDP group, volume change curve of H69AR (B) and H446DDP (C) group measured on the indicated days. (D) Excised tumors image from tumor bearing nude mice in H69AR+Chemo and H446DDP+Chemo group, volume change curve of H69AR+Chemo (E) and H446DDP+Chemo (F) group measured on the indicated days. *p < 0.05, **p < 0.01.
4. The potential mechanism of KCNQ1OT1-mediated chemoresistance
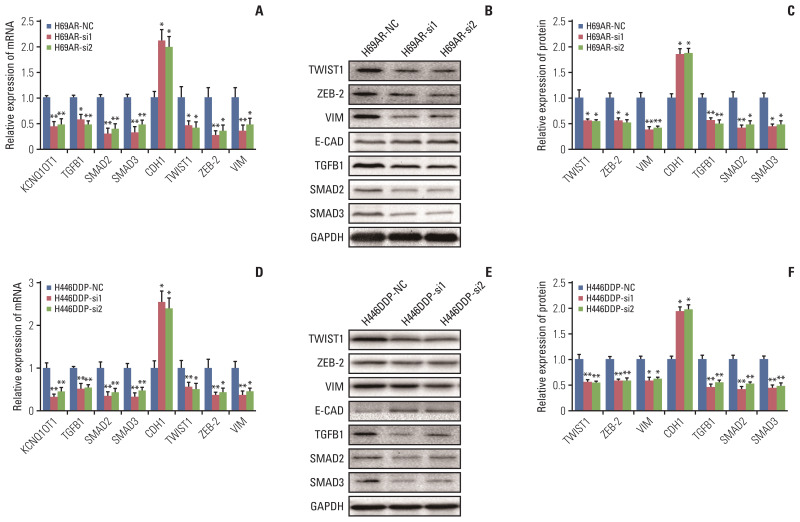
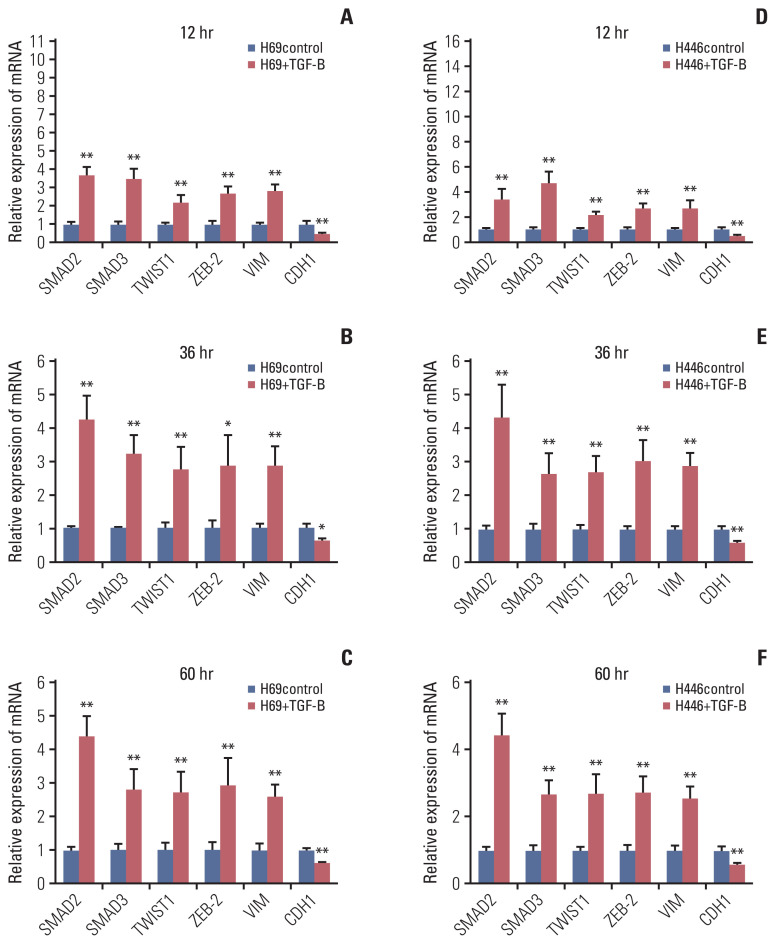
To identify pathways regulated by KCNQ1OT1 and to understand the potential mechanism of its chemoresistance effects in SCLC, gene expression profiles of H446DDP cells with or without KCNQ1OT1 knockdown were analysed by cDNA microarray. The heatmap was displayed in S6 Fig. We found that E-cadherin gene, the typical epithelial-to-mesenchymal transition (EMT) molecular marker, was significantly upregulated in KCNQ1OT1 knockdown H446DDP cells. Accordingly, three mesenchymal genes (VIM [vimentin], TWIST1 [twist family bHLH transcription factor 1], and ZEB-2 [zinc finger E-box binding homeobox 2]) and three key genes of transforming growth factor-β (TGF-β) signaling pathway (TGFB1 [transforming growth factor, beta 1], SMAD2 [SMAD family member 2], and SMAD3 [SMAD family member 3]) were down-regulated in KCNQ1OT1 knockdown H446DDP cells (Table 2). The results were subsequently detected using RT-qPCR and western blotting on H69AR cell (Fig. 7A–C) and H446DDP cell (Fig. 7D–F). As expected, knockdown of KCNQ1OT1 resulted in EMT, as evidenced by repression of the mesenchymal genes VIM, TWIST1, and ZEB-2 and induction of the epithelial marker E-cadherin. Recent studies have suggested that activated TGF-β pathway could facilitate EMT. To elucidate the molecular mechanism through which KCNQ1OT1 leads to the EMT activating phenotype, we examined TGF-β pathways participated. Addition of exogenous TGFB1 significantly increased the expression of SMAD2, SMAD3, TWIST, ZEB-2, and VIM, and decreased the expression of E-cadherin in H69 (Fig. 8A–C) and H446 (Fig. 8D–F) cells.
Table 2.
Changes in gene expression after knockdown of KCNQ1OT1
| Gene Id | Log2FC | p-value |
|---|---|---|
| E-CAD | 0.466781074 | 0.029809636 |
| TWIST1 | −0.0599418 | 0.477872819 |
| ZEB1 | −0.732119998 | 1.04E-40 |
| ZEB2 | −0.634441333 | 2.43E-21 |
| N-CAD | −0.113228561 | 0.010006974 |
| TGFB1 | −0.575819785 | 3.27E-19 |
| SMAD2 | −0.557860465 | 1.63E-37 |
| SMAD3 | −0.261259289 | 0.000200333 |
Fig. 7.
KCNQ1OT1 may promote small cell lung cancer chemoresistance by regulating transforming growth factor-β and epithelial-to-mesenchymal transition signaling pathway. Analysis of mRNA expression of KCNQ1OT1, TGFB1, SMAD2, SMAD3, CDH1, TWIST1, ZEB-2, and VIM in H69AR (A) and H446DDP (D) cells, the protein expression of TWIST1, ZEB-2, VIM, E-CAD, TGFB1, SMAD2, and SMAD3 in H69AR-si (B) and H446DDP-si (E) cells were measured with western blotting and presented as histogram (C, F). *p < 0.05, **p < 0.01.
Fig. 8.
Exogenous TGFB1 increased KCNQ1OT1 expression and activated epithelial-to-mesenchymal transition pathway in small cell lung cancer cells. Exogenous TGFB1 stimulated H69 cell lines, and the mRNA level of KCNQ1OT1, SMAD2, SMAD3, TWIST1, ZEB-2, VIM, and CDH1 were detected at 12 hours (A), 36 hours (B), and 60 hours (C), respectively. Exogenous TGFB1 stimulated H446 cell lines, and the mRNA level of KCNQ1OT1, SMAD2, SMAD3, TWIST1, ZEB-2, VIM, and CDH1 were detected at 12 hours (D), 36 hours (E), and 60 hours (F), respectively. *p < 0.05, **p < 0.01.
In summary, our results indicated that KCNQ1OT1 could emerge as important regulators of EMT, enabled by TGF-β pathway activation, which ultimately endows SCLC cell chemoresistant. And a reciprocal regulation between KCNQ1OT1 and TGF-β pathway could exist in SCLC cells.
Discussion
The rapid emergence of drug resistance limits the benefits of SCLC treatment, resulting in poor survival and prognosis. Numerous studies revealed that lncRNAs were involved in the development and progression of multiple cancers. Recently, aberrant expression of lncRNAs has been observed in chemoresistant cancer cells, making them a promising target for cancer chemotherapy. In order to investigate the role of lncRNA in the development of chemoresistant in SCLC cells, we compared lncRNA expression profiles in SCLC chemoresistant cells by lncRNA microarray. Compared with the H69 cell, KCNQ1OT1 expression was significantly upregulated in H69AR cell, and has not been reported on SCLC. Therefore, KCNQ1OT1 was selected for further research.
Recently, high levels of KCNQ1OT1 were detected in a variety of tumors. In colorectal cancer, KCNQ1OT1 expression increased and promoted gastrointestinal metastasis [17]. Guo et al reported that KCNQ1OT1 promoted tumor growth and metastasis in melanoma. Luo et al. [15] demonstrated that KCNQ1OT1 enhanced ovarian cancer cells proliferation, as well as migration. Zheng et al. [19] and Sun et al. [20] reported that the expression of KCNQ1OT1 was upregulated in NSCLC and stage I Lung cancer patients respectively. In addition, the drug resistance of cancer cells was also associated with KCNQ1OT1 expression. For instance, the enhanced resistance to oxaliplatin in colon cancer and hepatocellular carcinoma was associated with increased level of KCNQ1OT1 [21,22].
In this study, we found that KCNQ1OT1 expression was increased in H69AR cell and H446DDP cell compared with H69 cell and H446 cell, respectively. Furthermore, high level of KCNQ1OT1 was also confirmed in SCLC tissues compared with non-tumoral lung tissues, and high levels of KCNQ1OT1 indicated poor prognosis in SCLC patients. In addition, silencing of KCNQ1OT1 expression reduced SCLC cell proliferation, invasion and migration and induced cellular apoptosis.
Previous studies showed that cell apoptosis played an important role in tumor treatment [23]. The reason for tumor drug resistance is mainly due to the anti-apoptotic pathway of cancer cells and the sensitivity to cancer cell apoptosis induced by chemotherapy drugs [24,25]. In this study, we found that knockdown of KCNQ1OT1 expression increased the sensitivity of SCLC cells to the chemotherapeutic drug ADM, cDDP and VP-16, and that knockdown of KCNQ1OT1 significantly increased apoptosis of SCLC cells. These results illustrate that KCNQ1OT1 is involved in chemotherapy drug resistance in SCLC treatment.
Some recent studies showed that KCNQ1OT1 was involved in the progression of multiple cancers by targeting multiple miRNAs [26,27]. In NSCLC cells, KCNQ1OT1 promoted cell migration and invasion by regulating miR-27b-3p [25]. In cholangiocarcinoma, KCNQ1OT1 promoted cells proliferation, invasion, and migration by regulating miR-140-5p [26]. In addition, KCNQ1OT1 promoted the progression of ovarian cancer through miR-142-5p [27], which suggested that KCNQ1OT1 could regulate numerous genes by targeting multiple miRNAs. Therefore, we choose not to look at miRNAs regulated by KCNQ1OT1, but instead, we utilized cDNA microarray to determine genes regulated by KCNQ1OT1 in SCLC. In this study, we found that KCNQ1OT1 knockdown inhibited the TGF-β and EMT signaling pathways. EMT has been reported to enhance resistance to chemotherapy in cancer cells in a variety of tumors, including breast cancer, pancreatic cancer, and non-SCLC [28]. TGF-β is considered to be the most important factor that induces EMT in developmental processes, cancer and other pathological conditions [29,30]. In some epithelial cell lines cultured in vitro, TGF-β stimulation can induce EMT. We further found that TGF-β can regulate EMT in SCLC cells. Based on the above results, we believe that KCNQ1OT1 might regulates chemotherapy drug resistance of SCLC cells through the TGF-β mediated EMT pathway.
The findings presented in the research have allowed us to conclude that the expression of KCNQ1OT1 was increased in SCLC, and the high level of KCNQ1OT1 is a novel biomarker with poor prognosis in SCLC patients. In addition, KCNQ1OT1 was found to inhibit tumor cell apoptosis, promote proliferation, invasion and migration, and enhance cell chemotherapy drug resistance. Although the oncogene role of KCNQ1OT1 has been reported on some tumors, such as NSCLC, ovarian cancer, the role of KCNQ1OT1 in SCLC is still unknown. More importantly, our study suggests that KCNQ1OT1 may play an important role in SCLC chemotherapy drug resistance by regulating the TGF-β mediated EMT signaling pathway. In summary, our research suggests that KCNQ1OT1 silencing may be considered as a new therapeutic application in SCLC patients, and lead to a better understanding of combination therapy based on chemotherapy.
Acknowledgments
This research was funded by Natural Science Foundation of Guangdong Province (2016A030313137) and Special Grant for Education and Scientific Research of Fujian Provincial Department of Finance (Fujian Finance Document (2019) 926).
Footnotes
Ethical Statement
The study was performed with the approval of the Ethics Committee of Fujian Provincial Hospital (k2017-12-024). The implement of the current study adhered to the tenets of the Declaration of Helsinki of the World Medical Association with regard to scientific research on human subjects. The written informed consent forms for participation and publication were obtained for all study participants.
Author Contributions
Conceived and designed the analysis: Liu Z, Liu H, Guo L.
Collected the data: Li D, Liu H, Guo L.
Contributed data or analysis tools: Tong Q, Lian Y.
Performed the analysis: Tong Q, Lian Y, Chen Z, Huang W, Wen Y, Wang Q, Liang S, Li M, Zheng J.
Wrote the paper: Li D.
Validation: Zhu Y, Huang W, Wang Q.
Conflicts of Interest
Conflict of interest relevant to this article was not reported.
Electronic Supplementary Material
Supplementary materials are available at Cancer Research and Treatment website (https://www.e-crt.org).
References
- 1.Ferlay J, Soerjomataram I, Dikshit R, Eser S, Mathers C, Rebelo M, et al. Cancer incidence and mortality worldwide: sources, methods and major patterns in GLOBOCAN 2012. Int J Cancer. 2015;136:E359–86. doi: 10.1002/ijc.29210. [DOI] [PubMed] [Google Scholar]
- 2.Lozano R, Naghavi M, Foreman K, Lim S, Shibuya K, Aboyans V, et al. Global and regional mortality from 235 causes of death for 20 age groups in 1990 and 2010: a systematic analysis for the Global Burden of Disease Study 2010. Lancet. 2012;380:2095–128. doi: 10.1016/S0140-6736(12)61728-0. [DOI] [PMC free article] [PubMed] [Google Scholar]
- 3.Sabari JK, Lok BH, Laird JH, Poirier JT, Rudin CM. Unravelling the biology of SCLC: implications for therapy. Nat Rev Clin Oncol. 2017;14:549–61. doi: 10.1038/nrclinonc.2017.71. [DOI] [PMC free article] [PubMed] [Google Scholar]
- 4.Faivre-Finn C, Snee M, Ashcroft L, Appel W, Barlesi F, Bhatnagar A, et al. Concurrent once-daily versus twice-daily chemoradiotherapy in patients with limited-stage small-cell lung cancer (CONVERT): an open-label, phase 3, randomised, superiority trial. Lancet Oncol. 2017;18:1116–25. doi: 10.1016/S1470-2045(17)30318-2. [DOI] [PMC free article] [PubMed] [Google Scholar]
- 5.Gaspar LE, McNamara EJ, Gay EG, Putnam JB, Crawford J, Herbst RS, et al. Small-cell lung cancer: prognostic factors and changing treatment over 15 years. Clin Lung Cancer. 2012;13:115–22. doi: 10.1016/j.cllc.2011.05.008. [DOI] [PubMed] [Google Scholar]
- 6.Wolin SL, Maquat LE. Cellular RNA surveillance in health and disease. Science. 2019;366:822–7. doi: 10.1126/science.aax2957. [DOI] [PMC free article] [PubMed] [Google Scholar]
- 7.Slack FJ, Chinnaiyan AM. The role of non-coding RNAs in oncology. Cell. 2019;179:1033–55. doi: 10.1016/j.cell.2019.10.017. [DOI] [PMC free article] [PubMed] [Google Scholar]
- 8.Li Z, Zhang J, Liu X, Li S, Wang Q, Di C, et al. The LINC01138 drives malignancies via activating arginine methyltransferase 5 in hepatocellular carcinoma. Nat Commun. 2018;9:1572. doi: 10.1038/s41467-018-04006-0. [DOI] [PMC free article] [PubMed] [Google Scholar]
- 9.Zhuo W, Liu Y, Li S, Guo D, Sun Q, Jin J, et al. Long noncoding RNA GMAN, up-regulated in gastric cancer tissues, is associated with metastasis in patients and promotes translation of ephrin A1 by competitively binding GMAN-AS. Gastroenterology. 2019;156:676–91. doi: 10.1053/j.gastro.2018.10.054. [DOI] [PubMed] [Google Scholar]
- 10.Mendell JT. Targeting a long noncoding RNA in breast cancer. N Engl J Med. 2016;374:2287–9. doi: 10.1056/NEJMcibr1603785. [DOI] [PubMed] [Google Scholar]
- 11.Fang S, Gao H, Tong Y, Yang J, Tang R, Niu Y, et al. Long noncoding RNA-HOTAIR affects chemoresistance by regulating HOXA1 methylation in small cell lung cancer cells. Lab Invest. 2016;96:60–8. doi: 10.1038/labinvest.2015.123. [DOI] [PubMed] [Google Scholar]
- 12.Sun Y, Hu B, Wang Q, Ye M, Qiu Q, Zhou Y, et al. Long non-coding RNA HOTTIP promotes BCL-2 expression and induces chemoresistance in small cell lung cancer by sponging miR-216a. Cell Death Dis. 2018;9:85. doi: 10.1038/s41419-017-0113-5. [DOI] [PMC free article] [PubMed] [Google Scholar]
- 13.Sun Y, Zhou Y, Bai Y, Wang Q, Bao J, Luo Y, et al. A long non-coding RNA HOTTIP expression is associated with disease progression and predicts outcome in small cell lung cancer patients. Mol Cancer. 2017;16:162. doi: 10.1186/s12943-017-0729-1. [DOI] [PMC free article] [PubMed] [Google Scholar]
- 14.Zeng F, Wang Q, Wang S, Liang S, Huang W, Guo Y, et al. Linc00173 promotes chemoresistance and progression of small cell lung cancer by sponging miR-218 to regulate Etk expression. Oncogene. 2020;39:293–307. doi: 10.1038/s41388-019-0984-2. [DOI] [PubMed] [Google Scholar]
- 15.Luo ZP, Jin H. Effects of LncRNA KCNQ1OT1 on proliferation and migration of ovarian cancer cells by Wnt/beta-catenin. Eur Rev Med Pharmacol Sci. 2019;23:8788–94. doi: 10.26355/eurrev_201910_19273. [DOI] [PubMed] [Google Scholar]
- 16.Guo B, Zhang Q, Wang H, Chang P, Tao K. KCNQ1OT1 promotes melanoma growth and metastasis. Aging (Albany NY) 2018;10:632–44. doi: 10.18632/aging.101418. [DOI] [PMC free article] [PubMed] [Google Scholar] [Retracted]
- 17.Xian D, Zhao Y. LncRNA KCNQ1OT1 enhanced the methotrexate resistance of colorectal cancer cells by regulating miR-760/PPP1R1B via the cAMP signalling pathway. J Cell Mol Med. 2019;23:3808–23. doi: 10.1111/jcmm.14071. [DOI] [PMC free article] [PubMed] [Google Scholar]
- 18.Wang J, Zhang H, Situ J, Li M, Sun H. KCNQ1OT1 aggravates cell proliferation and migration in bladder cancer through modulating miR-145-5p/PCBP2 axis. Cancer Cell Int. 2019;19:325. doi: 10.1186/s12935-019-1039-z. [DOI] [PMC free article] [PubMed] [Google Scholar]
- 19.Zheng L, Zhang FX, Wang LL, Hu HL, Lian YD. LncRNA KCNQ1OT1 is overexpressed in non-small cell lung cancer and its expression level is related to clinicopathology. Eur Rev Med Pharmacol Sci. 2019;23:6944–50. doi: 10.26355/eurrev_201908_18734. [DOI] [PubMed] [Google Scholar]
- 20.Sun X, Xin Y, Wang M, Li S, Miao S, Xuan Y, et al. Overexpression of long non-coding RNA KCNQ1OT1 is related to good prognosis via inhibiting cell proliferation in non-small cell lung cancer. Thorac Cancer. 2018;9:523–31. doi: 10.1111/1759-7714.12599. [DOI] [PMC free article] [PubMed] [Google Scholar]
- 21.Li Y, Li C, Li D, Yang L, Jin J, Zhang B. lncRNA KCNQ1OT1 enhances the chemoresistance of oxaliplatin in colon cancer by targeting the miR-34a/ATG4B pathway. Onco Targets Ther. 2019;12:2649–60. doi: 10.2147/OTT.S188054. [DOI] [PMC free article] [PubMed] [Google Scholar]
- 22.Hu H, Yang L, Li L, Zeng C. Long non-coding RNA KCNQ1OT1 modulates oxaliplatin resistance in hepatocellular carcinoma through miR-7-5p/ABCC1 axis. Biochem Biophys Res Commun. 2018;503:2400–6. doi: 10.1016/j.bbrc.2018.06.168. [DOI] [PubMed] [Google Scholar]
- 23.Fujita K, Iwama H, Oura K, Tadokoro T, Samukawa E, Sakamoto T, et al. Cancer therapy due to apoptosis: galectin-9. Int J Mol Sci. 2017;18:74. doi: 10.3390/ijms18010074. [DOI] [PMC free article] [PubMed] [Google Scholar]
- 24.Park JH, Kim YH, Park EH, Lee SJ, Kim H, Kim A, et al. Effects of metformin and phenformin on apoptosis and epithelial-mesenchymal transition in chemoresistant rectal cancer. Cancer Sci. 2019;110:2834–45. doi: 10.1111/cas.14124. [DOI] [PMC free article] [PubMed] [Google Scholar]
- 25.Rouhrazi H, Turgan N, Oktem G. Zoledronic acid overcomes chemoresistance by sensitizing cancer stem cells to apoptosis. Biotech Histochem. 2018;93:77–88. doi: 10.1080/10520295.2017.1387286. [DOI] [PubMed] [Google Scholar]
- 26.Sun H, Li Y, Kong H, Dai S, Qian H. Dysregulation of KCNQ1OT1 promotes cholangiocarcinoma progression via miR-140-5p/SOX4 axis. Arch Biochem Biophys. 2018;658:7–15. doi: 10.1016/j.abb.2018.09.019. [DOI] [PubMed] [Google Scholar]
- 27.Liu H, Chen R, Kang F, Lai H, Wang Y. KCNQ1OT1 promotes ovarian cancer progression via modulating MIR-142-5p/CAPN10 axis. Mol Genet Genomic Med. 2020;8:e1077. doi: 10.1002/mgg3.1077. [DOI] [PMC free article] [PubMed] [Google Scholar]
- 28.Du B, Shim JS. Targeting epithelial-mesenchymal transition (EMT) to overcome drug resistance in cancer. Molecules. 2016;21:965. doi: 10.3390/molecules21070965. [DOI] [PMC free article] [PubMed] [Google Scholar]
- 29.Zhu L, Fu X, Chen X, Han X, Dong P. M2 macrophages induce EMT through the TGF-beta/Smad2 signaling pathway. Cell Biol Int. 2017;41:960–8. doi: 10.1002/cbin.10788. [DOI] [PubMed] [Google Scholar]
- 30.Xu J, Lamouille S, Derynck R. TGF-beta-induced epithelial to mesenchymal transition. Cell Res. 2009;19:156–72. doi: 10.1038/cr.2009.5. [DOI] [PMC free article] [PubMed] [Google Scholar]
Associated Data
This section collects any data citations, data availability statements, or supplementary materials included in this article.


