

Graphical abstract
Keywords: HCoV SARS 3CLpro, GA-MLR, QSAR based virtual screening, Molecular docking and MD simulation, Lead, MMGBSA calculations
Abbreviations: QSAR, Quantitative Structure Activity Relationship; VS, Virtual Screening; GA-MLR, Genetic Algorithm Multilinear Regression; OECD, Organization for Economic Corporation and Development; MERS, Middle East Respiratory Syndrome; HCoVs, human coronaviruses; HCoV-NL63, Human coronavirus NL63; HCoV-HKU1, Human coronavirus HKU1; SARS, severe acute respiratory sign; 3CLpro, 3C like Protease; FDA, Food and Drug Administration; RNA, Ribo-nucleic acid; MDS, molecular dynamic simulation; MD, Molecular Docking; MMGBSA, Molecular Mechanics Generalized Born and Surface Area
Abstract
Congruous coronavirus drug targets and analogous lead molecules must be identified as quickly as possible to produce antiviral therapeutics against human coronavirus (HCoV SARS 3CLpro) infections. In the present communication, we bear recognized a HIT candidate for HCoV SARS 3CLpro inhibition. Four Parametric GA-MLR primarily based QSAR model (R2:0.84, R2adj:0.82, Q2loo: 0.78) was once promoted using a dataset over 37 structurally diverse molecules along QSAR based virtual screening (QSAR-VS), molecular docking (MD) then molecular dynamic simulation (MDS) analysis and MMGBSA calculations. The QSAR-based virtual screening was utilized to find novel lead molecules from an in-house database of 100 molecules. The QSAR-vS successfully offered a hit molecule with an improved PEC50 value from 5.88 to 6.08. The benzene ring, phenyl ring, amide oxygen and nitrogen, and other important pharmacophoric sites are revealed via MD and MDS studies. Ile164, Pro188, Leu190, Thr25, His41, Asn46, Thr47, Ser49, Asn189, Gln191, Thr47, and Asn141 are among the key amino acid residues in the S1 and S2 pocket. A stable complex of a lead molecule with the HCoV SARS 3CLpro was discovered using MDS. MM-GBSA calculations resulted from MD simulation results well supported with the binding energies calculated from the docking results. The results of this study can be exploited to develop a novel antiviral target, such as an HCoV SARS 3CLpro Inhibitor.
1. Introduction
Coronaviruses are classified as RNA viruses. To date, seven human coronaviruses (HCoVs) viz. SARS-CoV, Middle East Respiratory Syndrome (MERS) -CoV, and SARS-CoV-2, 229E, Human coronavirus OC43, Human coronavirus NL63 (HCoV-NL63), and Human coronavirus HKU1 (HCoV-HKU1) have been discovered. First, three of the seven coronaviruses, particularly SARS-CoV, MERS-CoV, and SARS-CoV-2 are pathogenic species. Whereas the ultimate four, namely 229E, OC43, NL63, and HKU1 cause mild diseases. Coronaviruses belongs to the order Nidovirales, household Coronaviridae, and subfamily Orthocoronavirinae. Amongst the four coronavirus genera (Alphacoronavirus, Betacoronavirus, Gammacoronavirus, Deltacoronavirus), HCoVs are categorized below Alphacoronaviruses; HCoV-229E and NL63 and Betacoronaviruses; MERS-CoV, SARS-CoV, HCoVOC43 and HCoV-HKU1. SARS-CoV-2 from the Betacoronavirus genus has fairly close relatedness with two bat-derived CoV-like coronaviruses, viz. bat-SL-CoVZC45 and bat-SL-CoVZXC21 (Malik, 2020) Coronaviruses are of sphere-shape with a diameter of a hundred twenty-five nm with the club-shaped projections on the floor that resemble a photo voltaic corona. Coronavirus has fairly the greatest genome amongst each and every positive-strand RNA viruses. (Lai et al., 2006)
An incredibly transmissible coronavirus to that amount causes lethal respiratory harm was once in the beginning determined of China. The severity of the symptoms is characterized by the increased nasal mucosal plasma exudation and interferon γ (IFNγ) levels in nasal lavage specimens (Linden et al., 1995). The advance peak of respiratory tract viral loads seems within the preceding three days then infection or drops off dramatically within a week, correlating including development and raise within signs and symptoms stability.
Dramatically, there is a consequential considerable vibrancy into the quantity of corona cases. To date, corona infection has reached more than 29 lot humans international with a mortality dimensions as high as 3.15 % (according in accordance with World Health Organization’s (WHO’s) report, September 2020). Despite the fact, potent hit in opposition to SARS-CoV-2 is still a dream durability (Konwar and Sarma, 2020).
A 3C-like protease (3CLpro) additionally appear among CoV-229E, the causative agent for the severe acute respiratory sign (SARS) into human. CoV-229E and SARS-CoV exist in a complex with the inhibitors were investigated in the several crystal structures of 3Cpro from CVB3 and 3CLpro protein. (Lee et al., 2009) In it concern, numerous investigators hold utilized MD, MDS, quantitative structure–activity relationship (QSAR) studies for virtual screening to to identify a new hit for HCoV SARS 3CLpro inhibition.
QSAR techniques have been effectively implemented not only In the development of a reliable statistics-based mathematical correlation between physicochemical properties of chemical substances and their desired biological activities but also to forecast the biological activity of de novo molecules.
In the last couple of decades together with the advances in the computational field, wet-lab chemical experimentation has been substituted by molecular modeling and virtual experimentation that deploy fundamentals of basic sciences such as, mathematics, chemistry, physics, and algorithms (Gini, 2016).
Enriching the utility about QSAR methodologies among the drug search yet development endeavor, especially into the improvement on the doubtlessly potent fresh chemical entities then hit/lead together with diverse bioactivity is a captivating scientific research community. (Garro Martinez et al., 2015) With the advances in computational sciences, QSAR technologies are evolving rapidly and gaining potential makes use of in regulatory science. Food and Drug Administration (FDA) had invested a lot of efforts to facilitate the development of reliable QSAR models in setting up chemical databases using superb and protected experimental statistics accompanied with the aid of the development of computational algorithms (Hong et al., 2016).
Successful application of high throughput screening (HTS) to molecules’ libraries to find out the new lead for a particular biological property is one of the core traits in drug discovery. To set up the correlation of the undertaking of a molecule with molecular descriptors, QSAR analysis is frequently used which includes digital molecular filtering and screening based on a mathematical model. This strategy reduces the cost in the failure of a drug candidate in superior (clinical) degrees by filtering combinatorial libraries, rejecting these molecules with an expected toxic effect, and disadvantaged pharmacokinetic profiles, thereby decreasing the number of experiments.
Molecular docking (MD) is one of the widely used, well-established in-silico structure-based drug discovery methods. Docking describes and/or predicts ligand-target interactions at the molecular level, set up structure–activity relationships (SAR) and enable the identification of new lead candidate of therapeutic interest a priori information on the chemical structure of other goal modulators. MD techniques are largely used to discover conformation adopted by means of ligands inside the binding pocket(s) of the macromolecular targets. MD additionally evaluates the ligand-receptor binding free power by way of assessing critical phenomena via a complicated intermolecular recognition system (Ferreira et al., 2015).
Hit identification and lead optimization are abundantly tangled with computational modeling. In drug discovery, structure-based virtual screening (VS) has been indispensable for more than a decade with its drastically studied, underlying computational technique, docking. The parameters for vS may range with the objective, however the usual protocol is very straightforward. Principally in vS a library of small molecules are docked into the binding pocket of a macromolecule (target receptor, protein, etc.). The system ends up by way of returning various solutions per molecule, ranked in the order of acceptance for similarly screening and the identification of the fine possible hit(s) (Kontoyianni, 2017). vS is a time, cost, resources, and labor saving approach and this has marked vS as one of the effective computational techniques to display libraries of small molecules for new hits to be experimentally examined for desired property/activity. Among the vS approaches, QSAR analysis is the most powerful method due to its excessive and speedy throughput and desirable hit rate. A QSAR model once developed and fully validated for robustness and productiveness, can be utilized to the reliable prediction of the biological property of novel compounds. Although the experimental trying out of computational hits is now not an inherent section of QSAR methodology, it is exceptionally preferred and need to be carried out as an ultimate validation of developed models, advisably.
In the present scientific contribution, QSAR primarily based virtual screening strategy is expected for the rapid and less expensive development of medicines to deal with SARS-CoV-2. This tactic is primarily based on discovering the anti-HCoV SARS 3CLpro attainable of leverage molecules beforehand testified to have powerful inhibitory recreation for the same. Critical evaluations of present information on HCoV SARS 3CLpro inhibitors the use of QSAR based vS supported and enriched by way of MD and MDS procedures have been carried out to perceive novel HCoV-229E inhibitors with preferred properties.
2. Experimental
2.1. Preparation of data sets
To begin, we classified the complete Chembl information set into two classes, with assays of each the wild kind and mutant form of the target. As documented with the aid of Chembl, no in-vitro assay was developed to evaluate Human Coronavirus 229E inhibitory activity towards mutant targets.
After removing structural duplicates, we used the median EC50 value to create the QSAR models. The log-transformed EC50 values were used for the QSAR models. All the compounds test in vitro against Human coronavirus 229E were used in this collection of inhibitor structures from the ChEMBL database.In the end, 39 compounds representing 37 unique compounds were identified as having been tested against Human Coronavirus 229E (see Table 1 ).
Table 1.
showing Experimental end point (experimental pEC50 value in nm), Predicted fitting (Predicted pEC50 value) and Predicted fit residual value (residual).
| sn | Status | Exp. endpoint | Pred. fitting | Pred.Fit.Res. | Pred. LOO | Pred. LOO Res. |
|---|---|---|---|---|---|---|
| 1 | Training | 6.699 | 6.4234 | −0.2756 | 6.3412 | −0.3578 |
| 2 | Training | 6.301 | 6.4887 | 0.1877 | 6.5641 | 0.2631 |
| 3 | Training | 6.222 | 5.8991 | −0.3229 | 5.8629 | −0.3591 |
| 4 | Training | 5.886 | 5.6832 | −0.2028 | 5.6284 | −0.2576 |
| 5 | Training | 5.824 | 5.5829 | −0.2411 | 5.5531 | −0.2709 |
| 6 | Prediction | 5.745 | 5.475 | −0.27 | PRED | −0.27 |
| 7 | Training | 5.745 | 5.8673 | 0.1223 | 5.9219 | 0.1769 |
| 8 | Prediction | 5.745 | 5.8991 | 0.1541 | PRED | 0.1541 |
| 9 | Training | 5.602 | 5.8991 | 0.2971 | 5.9324 | 0.3304 |
| 10 | Training | 5.284 | 5.0159 | −0.2681 | 4.9946 | −0.2894 |
| 11 | Training | 5.268 | 5.1013 | −0.1667 | 5.0908 | −0.1772 |
| 12 | Training | 5.268 | 5.1013 | −0.1667 | 5.0908 | −0.1772 |
| 13 | Training | 5.268 | 5.2093 | −0.0587 | 5.2047 | −0.0633 |
| 14 | Training | 5.268 | 5.1013 | −0.1667 | 5.0908 | −0.1772 |
| 15 | Training | 5.268 | 5.6909 | 0.4229 | 5.746 | 0.478 |
| 16 | Training | 5.26 | 5.1239 | −0.1361 | 5.1067 | −0.1533 |
| 17 | Training | 5.102 | 5.1293 | 0.0273 | 5.1346 | 0.0326 |
| 18 | Training | 5.102 | 5.1293 | 0.0273 | 5.1346 | 0.0326 |
| 19 | Training | 5.102 | 5.0213 | −0.0807 | 5.0119 | −0.0901 |
| 20 | Prediction | 5.102 | 5.0866 | −0.0154 | PRED | −0.0154 |
| 21 | Training | 5.102 | 5.3523 | 0.2503 | 5.3728 | 0.2708 |
| 22 | Training | 5.073 | 4.9786 | −0.0944 | 4.9689 | −0.1041 |
| 23 | Training | 5.051 | 4.9934 | −0.0576 | 4.985 | −0.066 |
| 24 | Training | 5.051 | 4.765 | −0.286 | 4.7031 | −0.3479 |
| 25 | Prediction | 5.051 | 4.9079 | −0.1431 | PRED | −0.1431 |
| 26 | Training | 5.051 | 5.2093 | 0.1583 | 5.2217 | 0.1707 |
| 27 | Training | 5.051 | 4.9786 | −0.0724 | 4.9712 | −0.0798 |
| 28 | Prediction | 5.048 | 4.7402 | −0.3078 | PRED | −0.3078 |
| 29 | Training | 5.025 | 4.7627 | −0.2623 | 4.6986 | −0.3264 |
| 30 | Prediction | 5.025 | 4.8481 | −0.1769 | PRED | −0.1769 |
| 31 | Training | 4.928 | 5.3321 | 0.4041 | 5.3673 | 0.4393 |
| 32 | Training | 4.923 | 5.0415 | 0.1185 | 5.0826 | 0.1596 |
| 33 | Training | 4.609 | 4.5289 | −0.0801 | 4.5015 | −0.1075 |
| 34 | Training | 4.403 | 4.4822 | 0.0792 | 4.5994 | 0.1964 |
| 35 | Training | 4.357 | 4.7999 | 0.4429 | 4.9401 | 0.5831 |
| 36 | Training | 4.347 | 4.5491 | 0.2021 | 4.5866 | 0.2396 |
| 37 | Training | 4.222 | 4.4209 | 0.1989 | 4.4861 | 0.2641 |
2.1.1. Modeling set preparation from ChEMBL data
ChEMBL's trustworthily determining criteria were used to prefilter the compounds and data in the database: (1) the confidence score (a quantitative indicator of data quality in ChEMBL) is greater than 8; (2) expert-based curation; (3) data source (PubMed); is indicated; (4) EC50 is a parameter of activity measurement; (5) EC50 is precisely define (there is no “>” or “*” signal before EC50); (6) We have not included the structure because it is not a multi-component complex or salt. Therefore, only the compounds tested against the Human Coronavirus 229E inhibition assay were extracted from ChEMBL.
2.2. Structure optimization and molecular descriptor calculation
To create the structures, ACD Labs' chemical sketch program (www.acdlabs.com) was used. The structures were converted into 3D structures using Open-Babel 2.4 and then optimized with MMFF94 force fields.The 3D constructions were optimized using TINKER default settings, and then they were aligned using Open3DAlign.
2.3. Molecular descriptor pruning
Over 30,000 molecular descriptors have been created by way of PyDescriptor and PaDEL for each molecule in all sets. This led to molecular descriptor thinning as it eliminated vain molecular descriptors. As a way to keep away from multi-collinear and counterfeit variables in the GAMLR (Genetic Algorithm–Multi-linear Regression) model, molecular descriptors with excessive co-linearity (|R|greater than0.90) and tightly constant (greater than95 %) had been excluded the usage of objective feature selection in QSARINS ver. 2.2.4. Despite the limited variety of molecular descriptors, the condensed pool was once massive adequate to embody the area of 1D to 3D descriptors (Davies et al., 2015, Masand et al., 2018, Masand et al., 2017).
2.4. Splitting the data set into training and external sets and subjective feature selection (SFS):
A precise way to avoid statistics leakage is to split the data set into training, prediction, and external/test sets with the appropriate composition and parts prior to exhaustive subjective feature selection (Masand et al., 2017). For bias-free analysis, the dataset was randomly split up into training (80 % = 30 molecules) and prediction (20 % = 7 molecules) sets. To choose a set of molecular descriptors, a training set was used alone, and a prediction/external set was used solely to perform external validation of the model (Predictive QSAR) (See Fig. 1 ).
Fig. 1.

Depiction of 37 dataset molecules used in QSAR study.
We employed QSARINS-2.2.4′s GA-MLR method to pick out relevant descriptors for subjective feature decision the usage of Q2 LOO as a fitness parameter. The variety of molecular descriptors in the model is an essential factor in growing a profitable QSAR model without excessive over-fitting. Using breaking point values drawn from R2 tr and Q2 LOO values, a design (see Fig. 2 ) was plotted between the wide variety of molecular descriptors involved in the QSAR model and the number of molecular descriptors involved in the model. The breaking point used to be consequently viewed to be the optimal number of the molecular descriptors. According to Fig. 2, there are four variables that determine the breaking point. As a result, we excluded QSAR models with more than 4 descriptors.
Fig. 2.

Plot of number of descriptors against Coefficient of Determination R2 and Leave-One out Coefficient of Determination Q2 to identify the optimum number of descriptors.
2.5. QSAR model building and their validation:
The set of information used to be arbitrarily split using random splitting in QSARINS into a training set and a prediction set (80 % training and 20 % prediction, respectively). After creating the model, the training set was used for external validation, that is, to reveal the model's potential to predict fresh chemical entities (Masand et al., 2016, Masand et al., 2015, Masand et al., 2015, Gramatica, 2020).
With default settings, QSARINS used to be used to create GA-MLR primarily based QSAR models. In GA, the selected fitness purpose to maximize used to be Q2, which also covered the double cross-validation. During the improvement of the model, it was once found that the value of Q2 extended up to 4 variables, but then dropped significantly. To avoid overfitting and construct simple and informative QSAR models, the molecular descriptor vary was once confined to a set of 4 descriptors (Fujita and Winkler, 2016, Gramatica, 2014).
Values for molecular descriptors used in QSAR models can be determined in the extra information for every molecule. Because one of the OECD guidelines advises methodically validating a QSAR model, all of the fashions had been subjected to inside and external validation, Y-scrambling, and QSARINS model applicability domain (AD) analysis. A GA-MLR based QSAR model's statistical agreeable and strength have been assessed the use of the following criteria: (a) Internal validation primarily based on leave-one-out (LOO) and leave-many-out (LMO) system (i.e. cross-validation (CV)); (b) the usage of External validation; (c) Y-randomization (or Y-scrambling) and (d) fulfilling of precise threshold value for the statistical limits (Consonni et al., 2019, Huang and Fan, 2011) : R2 tr ≥ 0.6, Q2 loo ≥ 0.5, Q2 LMO ≥ 0.6, R2 > Q2 ,R2 ex ≥ 0.6, RMSEtr < RMSEcv, ΔK ≥ 0.05, CCC ≥ 0.80, Q2 -Fn ≥ 0.60, r2m ≥ 0.6, (1-r 2/ro2) < 0.1, 0.9 ≥ ok ≥ 1.1 or (1-r 2/r’o2) < 0.1,0.9 ≥ k’ ≥ 1.1,| ro2 ≥ r’o2| < 0.3 with RMSE and MAE shut to zero. As a result, any QSAR model that did no longer meet the above-mentioned criteria was once eliminated. The formulae for calculating these statistical parameters are accessible in the supplementary material.
2.6. Molecular docking analysis
The protein data bank provided the pdb file for SARS-CoV 229e 3CLpro (pdb id-2zu2). The pdb 2zu2 was carefully chosen for its X-ray resolution and sequence completion. For docking analysis, the optimised protein is suitable (see Fig. 7). The native ligand (zinc-coordinating and peptidomimetic chemicals) was eliminated before docking study. The binding site for native ligand has been considered as the active site in the present work. Consequently, all the compounds were docked into the active site, where native ligand was bound with SARS-CoV 229e 3CLpr, the docking pose for the most active molecule as a representative is presented here for convenience.
Fig. 7.

Display of Superimposed structures of Molecule 4 (Green colored) with Molecule TG-0204988 (Cyan Colored) within the binding pocket of SARS-CoV 229e 3CLpro (pdb id-2zu2).
The software NRGSuite was utilized to perform the molecular docking study. (Gramatica, 2007) This is a free and open source software that may be used as a PyMOL plugin. With the help of FlexAID, it can detect surface holes in a protein and use them as target binding sites for docking simulations. It uses a genetic algorithm to operate conformational search, model ligand and side-chain flexibility, and allows for covalent docking simulation. To acquire the great performance using NRGSuite, the flexible–rigid docking method was used with the following default settings: input method for binding sites—spherical shape (diameter: 18 Å); spacing of three dimensional grid—0.375 Å; side chain flexibility-no; ligand flexibility-yes; ligand pose as reference-no; constraints-no; Hetero groups-included water molecules; van der Walls permeability-0.1; solvent types-no type; number of chromosomes-1000; number of generations-1000; fitness model-share; reproduction model-population boom; and number of top complexes-5 . For validation of molecular docking, the molecule TG-0204998, a recognized peptidomimetic inhibitor of SARS-CoV 229e 3CLpro, was used to validate the docking protocol.
2.7. MD simulation analysis
The virtual screening results are used to analyze the Hit Molecule 97 with a docking score of −8.043 kcal/mol and Molecule 4 the usage of the Schrodinger Desmond module in molecular dynamics and simulation (MD simulation). Using Hit Molecule 97 and Molecule 4 docking complexes, the SPC (Simple point charge) model used to be employed to bind protein ligands. The OPLS-2005 pressure subject (Gaudreault et al., 2015) and explicit solvent model with the SPC water molecules have been used in this system (Lee et al., 2009). Na + ions had been introduced to neutralize the charge. 0.15 M, NaCl options delivered to the machine to simulate the physiological environment. The NPT ensemble was set up by the use of the Nose-Hoover chain coupling scheme (Jorgensen et al., 1996) with temperature 300 K, leisure time of 1.0 ps and pressure 1 bar was once maintained in all the simulations. A time step of 2 fs used to be used. The Martyna-Tuckerman–Klein chain coupling scheme barostat technique was used for pressure control with a leisure time of 2 ps.
Long-range electrostatic interactions were calculated the use of the particle mesh Ewald technique (Martyna et al., 1992) with a radius of 9 Å for Coulomb interactions. The non-bonded forces have been calculated using the RESPA integrator. To have a look at the balance of the complex in MD simulations, the root mean square deviation (RMSD), root mean square fluctuation (RMSF), radius of gyration (Rg), and protein ligand interactions had been measured.−
2.8. Molecular mechanics generalized Born and surface area (MMGBSA) calculations
During MD simulations of 2zu2 complexed with dataset compound 4, most active hit molecule 97 and least active hit molecule 70, the binding free energy (Gbind) of docked complexes was calculated using the premier molecular mechanics generalized Born surface area (MM-GBSA) module (Schrodinger suite, LLC, New York, NY, 2017–4). The binding free energy was calculated using the OPLS 2005 force field, VSGB solvent model, and rotamer search methods (Lai et al., 2006). After the MD run, 10 ns intervals were used to choose the MD trajectories frames. The total free energy binding was calculated using Eq. (1):
| (1) |
Where,
ΔGbind = binding free energy,
Gcomplex = free energy of the complex,
Gprotein = free energy of the target protein, and
Gligand = free energy of the ligand.
3. Result
In this paper, QSAR and Molecular docking studies were employed to uncover hidden structural information responsible for SARS-CoV 229e 3CLpro inhibition. The QSAR model is created using PyDescriptor, which is simple to understand and link with biological activity. With the availability of easily accessible chemical descriptors and interpretation in terms of structural properties, the four-parameter GA–MLR model shows strong external prediction ability. Even though the current analysis used a straight evaluation of EC50 values of the molecules in the dataset to describe the influence of a precise descriptor, it is important to note that the combined or opposite effect of unknown factors or other molecular descriptors could have a significant impact on the molecule's EC50 value. (See Table 1)
The present QSAR analysis is performed using a data set comprising structurally assorted 37 compounds with experimentally determined EC50 value ranging from 200 to 60,000 nM. Therefore, it encompasses acceptable as well as comprehensive chemical space and data range. This will be utilized for the development of properly validated genetic algorithm combined multilinear regression (GA-MLR) model to assemble or outspread exhaustive evidence about the pharmacophoric features that govern desired bio-activity (Descriptive QSAR) and having adequate external predictive capability (Predictive QSAR). The four variable based GA-MLR QSAR model along with the selected internal and external validation parameters (see supplementary material for additional parameters) is as follow:
3.1. QSAR model
To accomplish a better knowledge about structural features determining the SARS-CoV 229e 3CLpro inhibitory activity, we have used interpretable molecular descriptors (as structural features) for model development. The GA-MLR QSAR four parametric model with its selected internal and external validation parameters (see supplementary material for additional parameters), is as follow:
QSAR Model: Training set: 30 (80 %) and Prediction set: 7 (20 %)
pEC50 = 5.343 (±0.516) + 0.567 (±0.562) * fnotringNsp3C3B + -0.043 (±0.198) * faccH4B + -0.108 (±0.352) * com_lipohyd_3A + -0.208 (±0.555) * ringC_sp3N_2B
Validation parameters for QSAR model: R2: 0.8425, R2 adj: 0.8183, Q2 loo: 0.7762, R2-Q2 loo: 0.0663, R2-R2 adj: 0.0242, Kxx: 0.2178, Delta K: 0.1545, RMSE tr: 0.2203, RMSE cv: 0.2626, RMSE ex: 0.2014, Sy: 0.2405, F: 34.7785, Q2-F1: 0.6342, Q2-F2: 0.6168, Q2-F3: 0.8683, CCC tr: 0.9145, CCC cv: 0.8776, CCC ex: 0.8584, r2m av: 0.6534, r2m de: 0.1706, MAE tr: 0.1896 , MAE cv: 0.2272, MAE ex: 0.1779, RSS tr: 1.5043, PRESS cv: 2.1379, PRESS ex: 0.2434 , R2 LMO: 84.6802, Q2 LMO: 73.6421, R2 Yscr: 13.6730, Q2 Yscr: −25.4536
In the present QSAR modeling work, various statistical validation parameters were suggested to justify the internal and external robustness and have typical meaning (see supplementary material for detailed descriptions and formulae). The high value of unlike statistical parameters like R2 tr (coefficient of determination), R2 adj. (adjusted coefficient of determination), and R2 cv (Q2loo) (cross-validated coefficient of determination for leave-one-out), R2 ex (external coefficient of determination), Q2 − Fn and CCCex (Concordance Correlation Coefficient) etc. and low value of LOF (lack-of-fit), RMSEtr (Root mean square error), MAEtr (Mean absolute error), R2 Yscr (R2 for Y-scrambling), etc. alongside different graphs obtained in the developed QSAR model explain the statistical robustness as well as excellent internal and external predictive ability with no chancy correlation. Furthermore, the Williams plot specifies that the model is statistically satisfactory (see Fig. 5 ). Thus, the developed QSAR model satisfies all the Organisation for Economic Co-operation and Development (OECD) suggested guidelines. (See supplimentary material section 1.3.1 for explanation and calculation method of various statistical parameters)
Fig. 3.

Display of Descriptor fnotringNsp3C3B exclusively for the molecule 1 and 37.
3.2. Discussion
A properly developed and validated QSAR model successfully established a correlation between a salient pharmacophoric traits presented by molecular descriptors and their biological activity, that extend hidden information about mechanistic features of molecule, specificity of particular substituents and even presence or absence of various pharmacophoric aspects critical for SARS-CoV 229e 3CLpro inhibition. Although, in the developed QSAR model, we have compared the EC50 value of diverse dataset molecules in correlation and as an effect of certain molecular descriptor, however a similar or opposite effect of other molecular descriptors or unknown features having a prevailing influence in determining the general EC50 value of a molecule cannot be ignored. Moreover, In other words, a single molecular descriptor is not sufficiently expert of fully clarifying the experimental EC50 value for such a diverse set of molecules. That is, the successful application of the established QSAR model depend on the simultaneous usage of constituent molecular descriptors.
3.2.1. Mechanistic interpretation of descriptor
3.2.1.1. FnotringNsp3C3B
The descriptor fnotringNsp3C3B point out closer to the frequency of prevalence of sp3 hybridized carbon atom precisely at three bonds from non-ring nitrogen atom. The descriptor fnotringNsp3C3B has nice corelationship with the pEC50, therefore increase in the wide variety of such combination in molecule, and may similarly enhances the SARS-CoV 229e 3CLpro inhibition.
The calculation of the fnotringNsp3C3B descriptor was disallowed if the same sp3 hybridized carbon atom was once simultaneously present at one or two bonds from any different non-ring nitrogen atom. This statement supports, when we have compared the structures of molecule 1(pEC50 = 6.69, fnotringNsp3C3B = 3) and 37(pEC50 = 4.22, fnotringNsp3C3B = 0). If, we amplify the value of the descriptor fnotringNsp3C3B from 1 for the molecule 37 to 3 resulted into increase in the pEC50 by means of about 2.47 unit (about 20-fold expand in the SARS-CoV 229e 3CLpro inhibition). Furthermore, the presence of a sp3 hybridized carbon atom at 3 bonds from a non-ring nitrogen atom performs a necessary role in SARs covid viral inhibition when we consider that it increases hydrophobicity and offers an electrostatic function to the molecule 1. Molecular 37, on the different hand, lacks the same property, which ought to be the reason of the discrepancy in pEC50 of these molecules. (See Fig. 3), Similar observation is revealed when we have in contrast molecule 2 (pEC50 = 6.30 nm, fnotringNsp3C3B = 3) with molecule 34(pEC50 = 4.43 nm, fnotringNsp3C3B = 0).
3.2.1.2. FaccH4B
The descriptor faccH4B highlights the frequency of hydrogen atoms precisely at four bonds from the acceptor atoms. Because the descriptor has a negative correlation with pEC50, adding greater nitrogen atoms at four bonds from the acceptor atom might also decrease the pEC50 value of these molecules. If the identical Hydrogen atom is simultaneously existing at two to three bonds from any acceptor atom, then it was once excluded at some stage in the calculation of faccH4B.
The poor pEC50 for the molecule 33(pEC50 = 4.60) and 37 (pEC50 = 4.22) could be attributed to the frequency of occurrence of such hydrogen atoms exactly at 4 bonds from the acceptor atoms. (faccH4B = 14). This ought to be the possible reason for the variation in the biological activity of the molecule1 (pEC50 = 6.69, faccH4B = 12), 37(pEC50 = 4.22, faccH4B = 14) resp (See Fig. 4 ). If, we limit the value of the descriptor faccH4B from 14 for the molecule 37 to the 12 resulted into increase in the pEC50 by about 2.47 unit (about 20-fold amplification in the SARS-CoV 229e 3CLpro inhibition) (see Fig. 5 ).
Fig. 4.

Presentation of the descriptor faccH4B for the molecules 1 and 37 only.
Fig. 5.


Different graphs associated with the developed Quantitative Structure − Activity Relationship (QSAR) model: (a) experimental vs predicted pEC50 and (b) Williams plot to assess applicability domain of model, and (c) Insubria Plot.
Because this descriptor has a negative coefficient in the generated models, the number of hydrogen atoms close to the 4 bonds acceptor atom is a proper combination to hire for SARS-CoV 229e 3CLpro lead/drug optimization. Because hydrogen is the smallest element, it suggests that the bulk in the vicinity of ring Nitrogen atoms be stored to a minimum. To enhance SARS-CoV 229e 3CLpro inhibition, steric bulk close to acceptor atom inside four bonds atoms be decreased or averted in future changes.
3.2.1.3. Com_lipohyd_3A
This descriptor signify the prevalence of hydrophobic atoms inside 3A0 from the center of mass of the molecule. It has a negative coefficient in the developed QSAR model; therefore, growing the number of such hydrophobic atoms may want to end result in the reduced EC50 value for a molecule for SARs covid virus. The underprivileged pEC50 values for the molecules 35(pEC50 = 4.35, com_lipohyd_3A = 4), 36(pEC50 = 4.34, com_lipohyd_3A = 3) and 37(pEC50 = 4.22, com_lipohyd_3A = 3) may want to be associated with the occurrence of hydrophobic atoms inside 3A0 from the center of mass of the molecule. This observation supported, when we have compared another pair of molecules, 25 (pEC50 = 5.05, com_lipohyd_3A = 3) with 3 (pEC50 = 6.22, com_lipohyd_3A = 1). If, we limit the value of the descriptor com_lipohyd_3A from 3 for the molecule 25 to 1 will give upward thrust to the 2 expand in the pEC50 via about 1.17 unit (about eleven fold increase in the SARS-CoV 229e 3CLpro inhibition). Furthermore, in some molecules namely; 1(pEC50 = 5.10, com_lipohyd_3A = 0), 18(pEC50 = 5.10, com_lipohyd_3A = 0) and 20(pEC50 = 5.10, com_lipohyd_3A = 0), lipo-hydrophobic atom is absent therefore, it is exhibits that there is a requirement of only one lipo-hydrophobic atom inside 3A0 from the center of mass of the molecule. This statement is supported, when we have in contrast the activity of molecule 1(pEC50 = 6.69, com_lipohyd_3A = 1) with the molecule 17, 18 and 20.
3.2.1.4. RingC_sp3N_2B
The presence of a sp3 hybridized nitrogen atom within two bonds from ring carbon atoms is represented by this description. In the mounted QSAR model, this descriptor has a negative coefficient; thus, an amplification in the number of such sp3 hybridized nitrogen atoms should result in a decrease in the EC50 value for the molecule for SARS-CoV 229e 3CLpro. The poor EC50 for the molecules 34 (pEC50 = 4.40, ringC_sp3N_2B = 3), 35 (pEC50 = 4.35, ringC_sp3N_2B = 4), 23 (pEC50 = 5.05, ringC_sp3N_2B = 3), 25 (pEC50 = 5.05, ringC_sp3N_2B = 3) and 26 (pEC50 = 5.051, ringC_sp3N_2B = 1) may additionally attributed to the high frequency of occurrence of such sp3 hybridized nitrogen atoms. In the existing dataset, there are around 14 molecules which have 3 to 1 such sp3 hybridized nitrogen within 2 bonds from the ring carbon atoms. Based on this analysis, it is rationale to say that, close combination of such nitrogen atom and ring carbon atom should be eluded in future to have higher EC50 for SARS-CoV 229e 3CLpro inhibition. Alongside, molecule 1(pEC50 = 6.69, ringC_sp3N_2B = 0), 2(pEC50 = 6.3, ringC_sp3N_2B = ), 3(pEC50 = 6.2, ringC_sp3N_2B = 0), 7(pEC50 = 5.74, ringC_sp3N_2B = 0), 8(pEC50 = 5.74, ringC_sp3N_2B = 0), and 9(pEC50 = 5.60, ringC_sp3N_2B = 0) show absence of such Sp3 hybridized nitrogen atoms, that ought to be the possible cause for the decrease in the activity of these molecules.
The constituent molecular descriptors obtained in the GA–MLR QSAR model have presented visible and hidden records about the structure landscapes linked to a various set of molecules investigated for their activity against SARS-CoV 229e 3CLpro inhibition in the current QSAR study. It is essential to recognize that no single molecular description can totally explain the supported EC50 distribution for such a numerous set of molecules. That is, the performance of the built QSAR model is dependent on the employment of constituent molecular descriptors at the equal time.
3.3. QSAR-Based virtual screening
Supplementary Materials include SMILES notations, calculated molecular descriptor values, pEC50, and EC50 for a 100-compound in-house library utilized for virtual screening. We've included the five most active and five least active hit molecules from the in-house library, as predicted through the created QSAR model, for the sake of convenience. (See Fig. 2)
3.3.1. Docking analysis
SARS-CoV 3CLpro is a dimeric protein with three domains in each subunit. 3CLpro has a massive loop between -strands C1 and D1, in accordance to structure-based sequence alignment. SARS-CoV 3CLpro's C1–D1 loop keeps the P2 facet chain in the S2 hydrophobic pocket. The C1–D1 loop of SARS-CoV 3CLpro secures the S2 hydrophobic pocket for the P2 side chain. Gln as the P1 residue, a hydrophobic residue at the P2 position, and a brief amino acid residue at the P1 position are all identified by means of 3CLpro with similar substrate specificity. (see Fig. 6 ).
Fig. 6.

Depiction of Molecule 4 orientation within the binding pocket of SARS-CoV 229e 3CLpro (pdb id-2zu2).
To unfold binding mode and interactions, the dataset molecule 4 and a known inhibitor such as TG-0204998 were docked into the active binding pocket of SARs Cov 229e 3CLpro in this study.
The substrate binding subsites are chosen as S1, S1, S2, S3, and S4. with preserved water molecules. The catalytic dyad of His-Cys is located in the active site in the cleft between domains I and II, whereas domain III participates in the protease dimerization. TG-0204998, the unsaturated ethyl ester occupies the S1site, which is in close proximity to the catalytic center. Therefore, we have selected native binding site of known inhibitors, TG-0204998 as an active site in the docking protocol.
The TG-0204998 is the peptidomimetic inhibitors of SARs Cov 229e 3CLpro, whose X-ray resolution shape is used to validate the docking protocol. The alignment of SARs Cov 229e 3CLpro with the TG-0204998 and the molecule four is depicted in Fig. 7 , which mean that the docking protocol is agreeable (see Fig. 7). Table 2 divulges the docking scores for the 5 most active and 5 least active dataset molecules.
Table 2.
Portrayal of Structures, Docking Score (kcal/mol) and RMSD values for the five most active and five least active dataset molecules.
| Molecule | Structures | Docking Score | RMSD |
|---|---|---|---|
| 1 |  |
−7.1447477 | 2.7707791 |
| 2 |  |
−7.8803358 | 1.7312964 |
| 3 |  |
−7.3945093 | 2.4114711 |
| 4 |  |
−8.4731464 | 1.6090333 |
| 5 |  |
−9.605979 | 2.440057 |
| 33 |  |
−7.4059458 | 1.5316099 |
| 34 |  |
−6.7014847 | 2.1337159 |
| 35 |  |
−10.147323 | 2.534488 |
| 36 |  |
−6.8096747 | 2.0087693 |
| 37 |  |
−7.909008 | 1.5497004 |
In this paper, we have identified a novel class of SARs Cov 229e 3CLpro inhibitor by performing a computer aided drug-design protocol. Our experiment contain selection of the dataset containing 37 structurally diverse compounds whose activity was predicted by using QSAR modelling. Further, the developed QSAR model was once used to predict the biological activity of in-house library undertaking of 100 numerous compounds. Successively, we have docked all the hundred compounds into the SARs Cov 229e 3CLpro. On the foundation of docking simulation outcomes (docking score), we have chosen 5 most active and 5 lease active hit compounds accompanied through molecular dynamic simulation and binding free energy calculations.
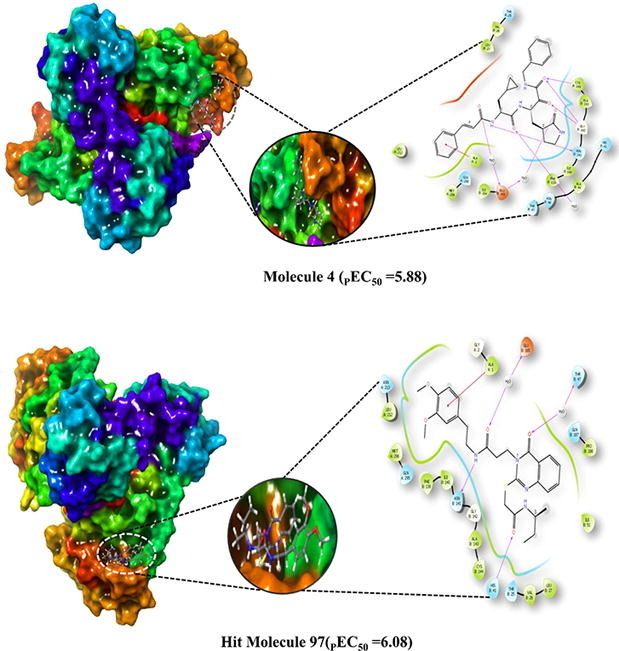
Amongst the five most active molecules, molecule 4 (-8.473 kcal/mol) and molecule 5 (-9.605 kcal/mol) achieved good docking score but, RMSD value become less for the molecule 5; therefore. Molecule four is chosen for the docking analysis. The molecule four with the RMSD value of 1.609 display better fit into the binding pocket of SARS-CoV 229e 3CLpro. The 2D and 3D interactions of molecule 4 with SARS-CoV 229e 3CLpro is presented in Fig. 2, Fig. 3 Even though, some inactive molecule namely, molecule 35 collect a docking score of −10.147 kcal/mol with the RMSD value of 2.53, that should be attributed to the large size of the molecule 10, as in contrast to molecule 4.
3.3.2. Docking pose analysis of the most active molecule 4
The molecule 4 bind to the active site of SARS-CoV 229e 3CLpro as that of the TG-0204998 in the similar manner. Chemically, molecule 4 is a (S)-N-benzyl-3-((S)-2-cinnamamido-3-cyclopropylpropanamido)-2-oxo-4-((S)-2-oxopyrrolidin-3-yl) butanamide. The terminal benzyl substituent anchored with hydrophobic residue ALA: 1 thru pi-cation interactions. Likewise, 2-cinnamamido moiety subsequent to the benzyl moiety structure a hydrogen bond with the negatively charged residue GLU165 through the involvement of a water molecule, while cinnamamido nitrogen form a hydrogen bonding contact with polar residue ASN B:14. Here, Glu165 is a necessary residue for keeping the enzyme in proper conformation. (See Fig. 8 )
Fig. 8.

Presentation of 2D interaction of molecule 4 with SARS-CoV 3CLpro (pdb id-2zu2).
Further, the cyclopropyl substituent show exposure to the solvent whilst adjoining carbonyl oxygen bind with water molecule by hydrogen bonding interactions. Concurrently, oxygen atom of 2-oxopyrrolidin bind with negatively charged residue GLU165 through means of hydrogen bonding interaction whereas, terminal 2-oxo oxygen attached with Gly143 residue the usage of hydrogen bond. At the same time, adjacent benzamide oxygen anchored hydrogen bond with the hydrophobic residue Cys144, which form the S2 pocket of the SARS-CoV 229e 3CLpro. Moreover, pyrrolidine ring form a close contact with the catalytic polar residue His B: 41 Here, it show off Pi-alkyl contact with the His B: 41 which signify the inhibitory impact of SARS-CoV 229e 3CLpro.
The identical observation is indicated by using the descriptor fnotringNsp3C3B, highlight the significance of sp3 hybridized carbon atom exactly at three bonds from non-ring nitrogen atom. In the molecule 4, cinnamamido nitrogen structure hydrogen bonding with the polar residue Asn141 while Sp3 hybridized C1 carbon atom of cyclopropyl flexibly exposed the molecule 4 to the solvent accessible surface area of the receptor. Thus, QSAR and molecular docking results are analogous and are complimentary. Further, the descriptor faccH4B signify that, the presence of least quantity of hydrogen atom precisely at four bonds from acceptor atom in the ligand molecule is recommended for biological activity. The much less density of hydrogen atoms in the close proximity of the acceptor oxygen atom in the molecule 4 leads to the less steric bulk, which facilitate the desirable binding and alignment of molecule into the active pocket. This justify that, QSAR analysis showed right correlation with the docking results. Subsequently, the descriptor com_lipohyd_3A mean the prominence of the lipo-hydrophobic atoms within 3A0 from the center of mass of the molecule. Herein, center of mass of the molecule 4 is located near cyclopropylamido nitrogen atom, where no bulky hydrophobic substituent is present within the vicinity of 3A0; therefore, it flexibly align the molecule four in the S2 pocket of the SARS-CoV 229e 3CLpro. This implies that, docking outcomes are in good agreement with QSAR analysis. Finally, the descriptor ringC_sp3N_2B gives an idea about the prevalence of sp3 hybridized nitrogen atom within 2 bonds from ring carbon atoms. In this, molecule four don’t have such kind of combination which may additionally drop the binding affinity against SARS-CoV 229e 3CLpro. This exhibits that, QSAR analysis correctly identified concealed and hidden structural characteristic decisive for SARS-CoV 229e 3CLpro inhibition.
3.3.3. Docking pose analysis of the most active hit molecule 97
Table 3 shows the molecular docking scores for the six most active and six least lively hit molecules. With a docking score of −8.043 kcal/mol and an RMSD of 1.53257, hit no. molecule 97 emerged as the most active of the 100 hit molecules. It reveals a 6.089 predicted EC50. Although various hit molecules, such as 19, 6, 39, 91, and 38, exhibited robust predictive activity, but they did now not have top binding characteristics, consequently hit molecule 97 was chosen as the most outstanding hit for the analysis.
Table 3.
Presentation of Structures, Docking Score (kcal/mol), RMSD and PEC50 values for the five most active and five least active Hits obtained in QSAR Modeling Based Virtual Screening.
| sn | Molecule | Structure | Docking score | RMSD | PEC50 | status |
|---|---|---|---|---|---|---|
| 1 | 19 |  |
−6.960 | 1.368 | 6.872 | Most active |
| 2 | 6 |  |
−7.126 | 2.978 | 6.743 | Most active |
| 3 | 39 |  |
−7.126 | 1.598 | 6.678 | Most active |
| 4 | 91 |  |
−6.728 | 2.3425 | 6.175 | Most active |
| 5 | 97 |  |
−8.043 | 1.53257 | 6.089 | Most active |
| 6 | 38 |  |
−7.335 | 1.666 | 6.025 | Most active |
| 7 | 4 |  |
−6.627 | 2.1068397 | 3.937 | Least active |
| 8 | 9 |  |
−7.485 | 1.298 | 3.921 | Least active |
| 9 | 59 |  |
−6.756 | 1.814 | 3.743 | Least active |
| 10 | 98 |  |
−6.948 | 0.9944 | 3.657 | Least active |
| 11 | 94 |  |
−7.533 | 1.638 | 3.635 | Least active |
| 12 | 70 |  |
−7.042 | 2.106 | 3.592 | Least active |
Chemically, hit molecule 97 is (S)-3-(2-((2-(sec-butylamino)-2-oxoethyl) thio)-4-oxoquinazolin-3(4H)-yl)-N-(3, 4-dimethoxyphenethyl) propenamide). To verify the binding mode of hit molecule 97, we have docked it into the SARS-CoV 3CLpro. The docking pose analysis exhibits that, hit molecule ninety-seven bind with the SARS-CoV 3CLpro via hydrogen bonding and hydrophobic contacts with the involvement of water molecules. The drug receptor interaction give rise to the docking score of −8.043 with the RMSD of 1.53. This results support that, the molecule 97 have very good fitting and affinity for SARS-CoV 3CLpro. (See Fig. 9, Fig. 10, Fig. 11 )
Fig. 9.

Presentation of 2D interaction of Hit molecule 97 with SARS-CoV 3CLpro (pdb id-2zu2).
Fig. 10.

Depiction of Hit Molecule 97 orientation within the binding pocket of SARS-CoV 229e 3CLpro (pdb id-2zu2).
Fig. 11.

Display of Superimposed structures of Hit Molecule 97 (Green colored) with Molecule TG-0204988 (cyan Colored) within the binding pocket of SARS-CoV 229e 3CLpro (pdb id-2zu2).
In the molecule 97, the 2-oxo-ethylthio oxygen form a hydrogen bonding interaction with the key amino acid residue His B: 41, which form a catalytic dyad of SARS-CoV 3CLpro and an important amino acid residue in the S1 pocket (See Fig. 10). Further, the terminal side chain substituent di methoxy substituted phenyl ring structure a pi-cation contact with the hydrophobic residue Ala: 1 of S2 hydrophobic pocket. Next, 4-oxoquinazolin oxygen atom bind with Thr B: 7 residue through hydrogen bonding interaction with the involvement of water molecule. Moreover, propanamide oxygen in amide linkage joining quinazoline and dimethoxy phenyl ring, form a contact of hydrogen bond with the negatively charged Glu B:165 residue, while amide nitrogen anchored a hydrogen bond with the Asn B:141 residue. Here, binding of hit molecule 97 into the respective S1 and S2 binding pocket of SARS-CoV 3CLpro give an explanation for its binding specificity. Our docking evaluation outcomes provide a structural basis for the optimization of the Hit molecule 97 and development of potential candidate for the antiviral therapies.
3.4. Molecular dynamic simulation based analysis for the molecule 4 and hit molecule 97
Root mean square deviation (RMSD) of the C-α backbone of 229e with ligand coupled complex confirmed a fairly stable structure, with a fluctuation of 80 Å denoted as a pink colored line. However, the ligand Hit Molecule 97, RMSD was once at first slightly distorted until 40 ns, after which it grew to be steady from 70 ns to 100 ns with no in addition variations. The RMSD of the C-α spine of HcoV 229e with ligand bound complex, on the other hand, confirmed a relatively stable structure with a fluctuation of 80, as proven by the green colored line. However, the ligand Molecule 4, RMSD exhibited minor distortions until 50 ns, after which it became stable from 60 ns to a hundred ns, with no similar fluctuations. (See Fig. 12 )
Fig. 12.

Root mean square deviation (RMSD) of C-α backbone of 229e (red) with Hit Molecule 97and Hcov_229e(green) with ligand compound 4 for 100 ns simulation exhibiting a stable configuration of 229e-hit6 & Hcov_229e-compound4.
On the other hand, root mean square fluctuations of respective amino acids of C-α spine of 2 displayed least fluctuations signifying the stable protein structure (Fig. 13 ).
Fig. 13.

Root mean square fluctuation of C-α backbone of 229e (red) & Hcov_229e (green) at its respective amino acid residues for 100 ns simulation exhibiting a stable configuration.
Ligand-protein interactions might also be tracked for the duration of the simulation. There are 4 sorts of interactions: additive, multiplicative, functions, and symmetric. Hydrogen bonds, hydrophobic, ionic, and water bridges are classifications of protein–ligand interactions. Ligand interaction of Hit Molecule 97 with the binding site residues of 229e and molecule 4 with the binding site residues of Hcov_229e; displayed the formation of non-bonded interactions such as hydrophobic interaction as shown in Fig. 14 (A) & (B).
Fig. 14.

The types of bonds and the amino acid residues that participated during 100 ns of simulation; (A)229e- Hit Molecule 97, (B)Hcov_229e-complex molecule 4.
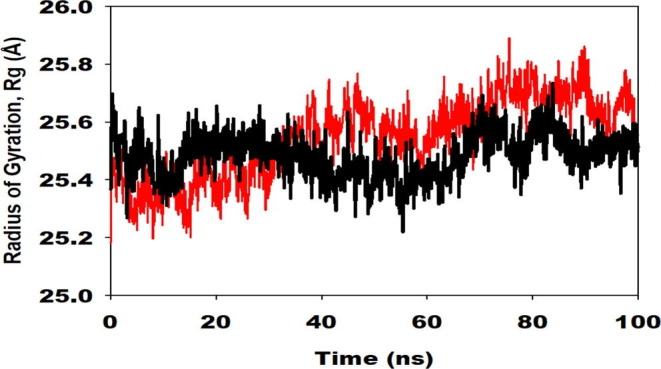
The radius of gyration (Rg) is the indicator of the size and compactness of the protein in the ligand-bound state displayed in Fig. 12. We have observed the Rg plot of Cα-backbone of 229e- Hit Molecule 97 (red) and Hcov_229e-complex molecule 4(black) bound protein complex in Fig. 12 having significant compactness well after the last 40 ns with an average of 25.8 Å deviation indicating the significant convergence. We observed less Rg score in complex molecule 4 bound 229e complex with 25.6 Å throughout the simulation (Figure S1, black, See Supplimentary material). But we observed the high lowering of Rg in Hcov_229e- Hit Molecule 97 bound complex (Figure S1 , red, see Supplimentary material), which signify less compactness and lesser stability comparatively.
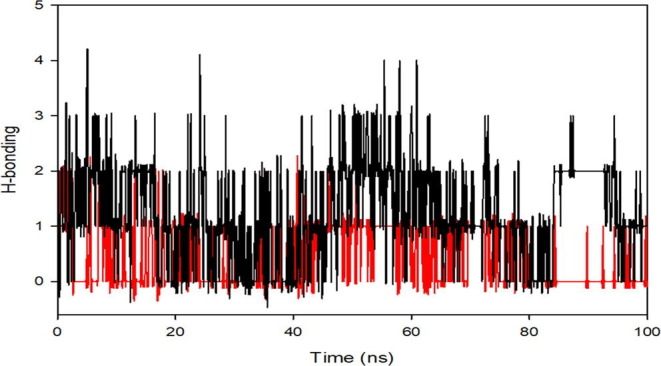
We have also recorded the average hydrogen bonds formed between complexes Hcov_229e- Hit Molecule 97 (red) & 229e-complex molecule 4(black), during the 100 ns simulation in (Figure S2 , see Supplimentary material). The average hydrogen bond formed for complex Hcov_229e- Hit Molecule 97 (red) is 1 and for complex 229e-complex molecule 4(black) is 2.
A chronology of the interactions and contacts that were listed on the preceding page. The (Figure S3 , See Supplimentary material) displays the total number of distinct interactions the protein makes with the ligand during the journey. Ligand-interacting residues are shown on the bottom panel in Figure S4 in Supplimentary material. Some residues make several specific contacts with the ligand, which is shown by a deeper shade of orange on the y-axis.The range of distribution of distinct forms of the molecule is determined by the RMSD of a ligand to the reference conformation. Calculate the radius of gyration using the ligand's “extendedness,” which is equal to the ligand's moment of inertia. In a ligand molecule, the number of intramolecular hydrogen bonds (intramolecular HB).
Use a probe radius of 1.4 to estimate the molecular surface area. This is the van der Waals area. Use the formula with the oxygen and nitrogen atoms acting as the entire composition to get the PSA. Figure S5 (See Supplimentary material) highlights the ligand characteristics such as RMSD, radius of gyration (rGyr), intramolecular hydrogen bond, molecular surface area (MolSA), solvent accessible surface area (SASA), and polar surface area (PSA). Both the ligands possess an intramolecular hydrogen bond.
A detailed molecular structure drawing that depicts the ligand molecules' molecular structure as well as specific amino acid residue interactions with protein residues. Interactions that occur 12.0 % or more of the simulation time are reported if the simulation lasts from 0.00 to 100.00 nsec. Some residuals are capable of interacting with the same ligand atom via a variety of interactions. From the Fig. 15 (A) it can be concluded that Glu165 is charge negatively; Ile164, Pro188, Leu190 are having hydrophobic interactions; while Thr25, His41, Asn46, Thr47, Ser49, Asn189, Gln191 are showing polar interactions with the ligand Hit Molecule 97. While from the Fig. 15 (B) it can be concluded that Pro188 is showing hydrophobic interactions; Asp186 is negatively charged; Gly142 is showing a hydrophilic interaction; while His41, Thr47, Asn141, Gln163 are having a polar interaction with the ligand complex molecule 4. (see Fig. 16, Fig. 17 for 2D and 3D depiction of hit molecule 97 and molecule 4)
Fig. 15.

2D interaction plots showing ligand interactions of 229e with (A) Hit Molecule 97 & (B) complex molecule 4 with the binding cavity residues of SARS-CoV 3CLpro.
Fig. 16.

Presentation of 3D and 2D interaction of Hit Molecule 97 in complex with SARS-CoV 3CLpro.
Fig. 17.

Presentation of 3D and 2D interaction of Molecule 4 in complex with SARS-CoV 3CLpro.
3.5. Molecular mechanics generalized Born and surface area (MMGBSA) calculations
MMGBSA is a popular method in calculating the binding energy of ligand to protein molecules. The estimation of the binding free energy of each of the protein–ligand complexes, as well as the role of other non-bonded interactions energies were estimated. The average binding energy of the ligands dataset compound 4 (229e-complex4), most active hit molecule 97 (229e-hit6) and least active hit molecule 70 with SARS CoV-229E 3CLpro were found to be –32.2 ± 7.6, −53.81 ± 6.7 and −7.2 ± 3.4, respectively (Table 4 ). The ΔGbind is influenced by of various types of non-bonded interactions, including ΔGbind Coulomb, ΔGbindCovalent, ΔGbindHbond, ΔGbindLipo, ΔGbindSolvGB and ΔGbindvdW interactions. Among all the types of interactions ΔGbindvdW, ΔGbindLipo and ΔGbindCoulomb energies contributed most to achieve the average binding energy. In contrast, ΔGbindSolvGB and ΔGbind covalent energies contributed the lowest to attain the final average binding energies (see Fig. 18).
Table 4.
MMGBSA binding energy contribution by non bonded interactions by 229e-complex4, 229e-hit6 and 70-inactive molecules with the target protein.
| Energies (kcal/mol) | 229e-complex4 | 229e-hit97 | 70-inactive |
|---|---|---|---|
| ΔGbind | –32.2 ± 7.6 | −53.81 ± 6.7 | −7.2 ± 3.4 |
| ΔGbindLipo | −13.8 ± 2.9 | −19.5 ± 2.4 | −5.6 ± 1.1 |
| ΔGbindvdW | −38.1 ± 7.7 | −52.2 ± 7.2 | −4.8 ± 6.0 |
| ΔGbindCoulomb | −8.1 ± 7.9 | −14.0 ± 9.1 | −2.8 ± 0.9 |
| ΔGbindHbond | −0.14 ± 0.2 | −0.95 ± 0.1 | −0.49 ± 0.3 |
| ΔGbindSolvGB | 23.6 ± 9.1 | 30.6 ± 5.4 | 2.2 ± 0.7 |
| ΔGbindCovalent | 4.9 ± 2.3 | 2.8 ± 1.9 | 3.1 ± 3.5 |
Fig. 18.

MMGBSA trajectory (0 ns, before simulation and 100 ns, after simulation) exhibited conformational changes of dataset compound 4(a), most active hit molecule 97(b) and least active hit molecule 70 upon binding with the protein SARS CoV-229E 3CLpro. The arrows indicating the overall positional variation (movement and pose) of dataset compound 4, most active hit molecule 97 and least active hit molecule 70 at the binding site cavity.
3.5.1. Results presented in Mean ± SD
In addition, the values of ΔGbindHbond interaction of hit molecule 97, dataset compound 4 and 70-inactive protein complexes showed the stable hydrogen bonds with the amino acid residues. In all the complexes ΔGbindSolvGB and ΔGbindCovalent showed unfavorable energy contributions and thus opposed binding. It is observed from Fig. 18 , at pre-simulation (0 ns) dataset compound 4, most active hit molecule 97 and least active hit molecule 70 at the binding pocket of SARS CoV-229E 3CLpro undergone substantial angular movement of the pose (curved to straight) after post simulation (100 ns). These conformational changes consequences the better acquisition at the binding pocket as well as the interaction with the residues for higher stability and better binding energy.
Thus MM-GBSA calculations resulted, from MD simulation trajectories well corroborated with the binding energies calculated from the docking results. Therefore, it can be suggested that the dataset compound 4, most active hit molecule 97 has good affinity for the major target SARS CoV-229E 3CLpro. However, least active hit molecule 70 displayed least binding energy with SARS CoV-229E 3CLpro. The MMGBSA trajectories displayed the conformational changes in the dataset compound 4, most active hit molecule 97 and least active hit molecule 70 to achieve the best fitting in the binding cavity of the protein.
4. Conclusion
Throughout of this paper, QSAR modelling, QSAR-based virtual screening, molecular docking, and MD simulation reality findings are used to uncover the new molecule as a SARS-CoV 229e 3CLpro inhibitor. Expending four descriptors, a GA-MLR based QSAR model is invented to understand the essential pharmacophoric prospect accountable for the SARS-CoV 3CLpro inhibition. Ensuing OECD directions, the QSAR model was once appraise for both internal and external validation measures. Pharmacophoric characters counting fnotringNsp3C3B, faccH4B, com_lipohyd_3A, and ringC_sp3N_2B seems as prominent aspects that deliver SARS-CoV 3CLpro inhibition, concurrent to the cutting-edge investigation. Internal and external validation specification in the derived model have a high value. In addition, QSAR-based virtual screening yielded a compound with a lower PEC50 value of 5.88 nm and a higher PEC50 value of 6.08. Furthermore, molecular docking investigation of molecule 4 into the SARS-CoV 3CLpro proclaim the key pharmacophoric moieties implicated in the binding interactions that are accountable for the inhibitory potential. The MD simulation and Molecular Docking evaluation divulge the imperative pharmacophoric centers like benzene ring, phenyl ring, amide oxygen and nitrogen etc. plays vital position in executing hydrogen bonding and hydrophobic interactions with the key amino acide residues namely; Ile164, Pro188, Leu190, Thr25, His41, Asn46, Thr47, Ser49, Asn189, Gln191, His41, Thr47, Asn141. In order to produce effective and selective SARS-CoV 3CLpro inhibitors, QSAR and molecular docking yielded a consensus as well as complimentary pharmacophoric features, which should be kept in the future. Finally, the extraordinary high docking score of hit molecule 97 with SARS-CoV 3CLpro explains the higher affinity and opens up new domain for a novel SARS-CoV 3CLpro inhibitor drug.
Declaration of Competing Interest
The authors declare that they have no known competing financial interests or personal relationships that could have appeared to influence the work reported in this paper.
Acknowledgement
The authors extend their appreciation to the Deanship of Scientific Research at Imam Mohammad bin Saud Islamic University for funding this work through Research Group no-21-09-77. Authors Rahul D. Jawarkar and Magdi E.A. Zaki are thankful to Dr. Paola Gramatica for providing free copy of QSARINS-2.2.4's.
Footnotes
Peer review under responsibility of King Saud University.
-
•See supplimentary material section 1.3.1 for explanation and calculation method of various statistical parameters.
-
•Section 1.3.3 Figure S1, S2, S3, S4, S5.
-
•Excel file contains smiles for dataset compound along with EC50 & PEC50,Calculated descriptors for dataset molecule and Smiles notation for 100 in house library of compounds used in QSAR based Virtual Screening and their Predicted pEC50 values.
Supplementary data to this article can be found online at https://doi.org/10.1016/j.arabjc.2021.103499.
Appendix A. Supplementary material
The following are the Supplementary data to this article:
Supplementary Fig. 1.
Supplementary Fig. 2.
Supplementary Fig. 3.

Supplementary Fig. 4.

Supplementary Fig. 5.

References
- Consonni V., Todeschini R., Ballabio D., Grisoni F. On the Misleading Use of Q 2F3 for QSAR Model Comparison. Molecular informatics. 2019;38(1–2) doi: 10.1002/minf.201800029. In this issue. [DOI] [PubMed] [Google Scholar]
- Davies M., Nowotka M., Papadatos G., Dedman N., Gaulton A., Atkinson F., Bellis L., Overington J.P. ChEMBL web services: streamlining access to drug discovery data and utilities. Nucleic acids research. 2015;43(W1):W612–W620. doi: 10.1093/nar/gkv352. [DOI] [PMC free article] [PubMed] [Google Scholar]
- Ferreira L.G., Dos Santos R.N., Oliva G., Andricopulo A.D. Molecular docking and structure-based drug design strategies. Molecules (Basel, Switzerland) 2015;20(7):13384–13421. doi: 10.3390/molecules200713384. In this issue. [DOI] [PMC free article] [PubMed] [Google Scholar]
- Fujita T., Winkler D.A. Understanding the Roles of the “Two QSARs”. Journal of chemical information and modeling. 2016;56(2):269–274. doi: 10.1021/acs.jcim.5b00229. In this issue. [DOI] [PubMed] [Google Scholar]
- Garro Martinez J.C., Vega-Hissi E.G., Andrada M.F., Estrada M.R. QSAR and 3D-QSAR studies applied to compounds with anticonvulsant activity. Expert opinion on drug discovery. 2015;10(1):37–51. doi: 10.1517/17460441.2015.968123. In this issue. [DOI] [PubMed] [Google Scholar]
- Gaudreault F., Morency L.P., Najmanovich R.J. NRGsuite: a PyMOL plugin to perform docking simulations in real time using FlexAID. Bioinformatics. 2015;31(23):3856–3858. doi: 10.1093/bioinformatics/btv458. In this issue. [DOI] [PMC free article] [PubMed] [Google Scholar]
- Gini G. QSAR Methods. Methods in molecular biology (Clifton. N.J.) 2016;1425:1–20. doi: 10.1007/978-1-4939-3609-0_1. In this issue. [DOI] [PubMed] [Google Scholar]
- Gramatica P. Principles of QSAR models validation: internal and external. QSAR & combinatorial science. 2007;26(5):694–701. doi: 10.1002/qsar.200610151. In this issue. [DOI] [Google Scholar]
- Gramatica P. External Evaluation of QSAR Models, in Addition to Cross-Validation: Verification of Predictive Capability on Totally New Chemicals. Molecular informatics. 2014;33(4):311–314. doi: 10.1002/minf.201400030. In this issue. [DOI] [PubMed] [Google Scholar]
- Gramatica P. Principles of QSAR modeling: comments and suggestions from personal experience. International Journal of Quantitative Structure-Property Relationships (IJQSPR) 2020;5(3):61–97. doi: 10.4018/IJQSPR.20200701.oa1. In this issue. [DOI] [Google Scholar]
- Hong H., Chen M., Ng H.W., Tong W. In Silico Methods for Predicting Drug Toxicity. Humana Press; New York, NY.doi: 2016. QSAR models at the US fda/nctr; pp. 431–459. [DOI] [Google Scholar]
- Huang J., Fan X. Why QSAR fails: an empirical evaluation using conventional computational approach. Molecular pharmaceutics. 2011;8(2):600–608. doi: 10.1021/mp100423u. In this issue. [DOI] [PubMed] [Google Scholar]
- Jorgensen W.L., Maxwell D.S., Tirado-Rives J. Development and testing of the OPLS all-atom force field on conformational energetics and properties of organic liquids. Journal of the American Chemical Society. 1996;118(45):11225–11236. In this issue. [Google Scholar]
- Kontoyianni M. Docking and Virtual Screening in Drug Discovery. Methods in molecular biology (Clifton. N.J.) 2017;1647:255–266. doi: 10.1007/978-1-4939-7201-2_18. In this issue. [DOI] [PubMed] [Google Scholar]
- Konwar M., Sarma D. Advances in developing small molecule SARS 3CLpro inhibitors as potential remedy for corona virus infection. Tetrahedron. 2020:131761. doi: 10.1016/j.tet.2020.131761. In this issue. [DOI] [PMC free article] [PubMed] [Google Scholar]
- Lai M.M.C., Perlman S., Anderson J.L. In: Fields Virology. 5th edition. Knipe D.M., Howley P.M., editors. Lippincott Williams & Wilkins; Philadelphia: 2006. Coronaviridae; pp. 1305–1335. In this issue. [Google Scholar]
- Lee C.C., Kuo C.J., Ko T.P., Hsu M.F., Tsui Y.C., Chang S.C., Yang S., Chen S.J., Chen H.C., Hsu M.C., Shih S.R., Liang P.H., Wang A.H. Structural basis of inhibition specificities of 3C and 3C-like proteases by zinc-coordinating and peptidomimetic compounds. The Journal of biological chemistry. 2009;284(12):7646–7655. doi: 10.1074/jbc.M807947200. In this issue. [DOI] [PMC free article] [PubMed] [Google Scholar]
- Linden M., Greiff L., Andersson M., Svensson C., Akerlund A., Bende M., Andersson E., Persson C.G. Nasal cytokines in common cold and allergic rhinitis. Clinical and experimental allergy: journal of the British Society for Allergy and Clinical Immunology. 1995;25(2):166–172. doi: 10.1111/j.1365-2222.1995.tb01022.x. In this issue. [DOI] [PMC free article] [PubMed] [Google Scholar]
- Malik Y.A. Properties of coronavirus and SARS-CoV-2. The Malaysian journal of pathology. 2020;42(1):3–11. In this issue. [PubMed] [Google Scholar]
- Martyna G.J., Klein M.L., Tuckerman M. Nosé-Hoover chains: The canonical ensemble via continuous dynamics. The Journal of chemical physics. 1992;97(4):2635–2643. doi: 10.1063/1.463940. In this issue. [DOI] [Google Scholar]
- Masand V.H., El-Sayed N.N., Mahajan D.T., Rastija V. QSAR analysis for 6-arylpyrazine-2-carboxamides as Trypanosoma brucei inhibitors. SAR and QSAR in environmental research. 2017;28(2):165–177. doi: 10.1080/1062936X.2017.1292407. In this issue. [DOI] [PubMed] [Google Scholar]
- Masand V.H., El-Sayed N.N., Bambole M.U., Quazi S.A. Multiple QSAR models, pharmacophore pattern and molecular docking analysis for anticancer activity of α, β-unsaturated carbonyl-based compounds, oxime and oxime ether analogues. Journal of Molecular Structure. 2018;1157:89–96. doi: 10.1016/j.molstruc.2017.12.045. In this issue. [DOI] [Google Scholar]
- Masand V.H., El-Sayed N.N., Mahajan D.T., Mercader A.G., Alafeefy A.M., Shibi I.G. QSAR modeling for anti-human African trypanosomiasis activity of substituted 2-Phenylimidazopyridines. Journal of Molecular Structure. 2017;1130:pp.711–718. doi: 10.1016/j.molstruc.2016.11.012. In this issue. [DOI] [Google Scholar]
- Masand V.H., Mahajan D.T., Nazeruddin G.M., Hadda T.B., Rastija V., Alfeefy A.M. Effect of information leakage and method of splitting (rational and random) on external predictive ability and behavior of different statistical parameters of QSAR model. Medicinal Chemistry Research. 2015;24(3):1241–1264. doi: 10.1007/s00044-014-1193-8. In this issue. [DOI] [Google Scholar]
- Masand V.H., Mahajan D.T., Maldhure A.K., Rastija V. Quantitative structure–activity relationships (QSARs) and pharmacophore modeling for human African trypanosomiasis (HAT) activity of pyridyl benzamides and 3-(oxazolo [4, 5-b] pyridin-2-yl) anilides. Medicinal chemistry research. 2016;25(10):2324–2334. doi: 10.1007/s00044-016-1664-1. In this issue. [DOI] [Google Scholar]
Associated Data
This section collects any data citations, data availability statements, or supplementary materials included in this article.