

Abstract
The therapeutic efficacy of stem cells transplanted into an ischaemic brain depends primarily on the responses of the neurovascular unit. Here, we report the development and applicability of a functional neurovascular unit on a microfluidic chip as a microphysiological model of ischaemic stroke that recapitulates the function of the blood–brain barrier as well as interactions between therapeutic stem cells and host cells (human brain microvascular endothelial cells, pericytes, astrocytes, microglia and neurons). We used the model to track the infiltration of a number of candidate stem cells and to characterize the expression levels of genes associated with post-stroke pathologies. We observed that each type of stem cell showed unique neurorestorative effects, primarily by supporting endogenous recovery rather than through direct cell replacement, and that the recovery of synaptic activities correlated with the recovery of the structural and functional integrity of the neurovascular unit rather than with the regeneration of neurons.
Ischaemic stroke is caused by an inadequate supply of blood to the brain and leads to deficits in neurologic functions1. The stroke involves a series of spatial and temporal events, such as inflammatory and immune responses, cell death and differentiation, hypoxia, vascular damage, and altered cerebral microenvironment1. Stem cell therapy has been highlighted as an emerging paradigm for stroke treatment, with supports from experimental animal studies as well as clinical pilot studies2. The clinical outcomes of stem cell therapies depend on a variety of factors, including the route, dosage, and timing of administration, but the most critical factor appears to be the type of stem cells2. Each type of stem cells has unique traits and distinct regenerative potential2, and yet there is a lack of reliable stroke model to systematically compare the efficacy across the broad range of candidate cell types and to investigate the underlying mechanism of stem cell therapeutics3. This poses a major challenge in utilizing and advancing stem cell therapies.
The majority of research for developing and examining stem cell therapeutics is based on murine-based animal models and several approaches have shown some enhanced neuroprotective effects in animal studies4. While outcomes from early phase cellular transplant clinical trials look promising, they do not always replicate the results from animal stroke models5. This might be due to the intrinsic differences between animal models and the human disease in terms of anatomy and physiology, the pathophysiological responses to injury, or the injury mechanism6. The animal models also have the inherent limitations in time- and cost-efficiency to be an ideal testbed for characterizing the therapeutic potentials of multiple stem cell types on the entire cascade of pathological events induced by the stroke.
The neurovascular unit (NVU) plays critical roles in the stroke progression as well as the recovery process7. NVU consists of brain microvascular endothelial cells (BMEC) and their neighboring neural cells, i.e. neurons and multiple types of glia cells7. These constituent cells in NVU work in concert with one another and create a tight blood-brain barrier (BBB) that regulates the molecular transport into and out of the brain parenchyma to maintain the homeostasis of the neural microenvironment as well as the brain functions7. NVU not only mediates the drug delivery and infiltration of the transplanted stem cells into the ischaemically damaged brain parenchyma, but also engages in the fate determination of neural stem cells during post-stroke neuroregeneration7.
Due to the clinical significance of BBB in drug delivery to brain parenchyma, there have been continuous efforts to develop in vitro BBB models. Major approaches in the past include BBB models with Transwell, a cone and plate viscometer, and hollow fibers8. More recently there have been some notable advances in constructing functional BBB on a microfluidic chip8–13. However, most of these approaches have limitations to be directly applicable to establishing the complex 3D tissue environment associated with the pathophysiological conditions of ischaemic stroke and the recovery process by transplanted stem cells.
In this study, we developed a stroke microphysiological system to examine the neurorestorative capacity of stem cell therapy. Our stroke model uses human-derived cells and has the in vivo-like 3D microenvironment recapitulating the natural interaction between the therapeutic stem cells and the host cells of the NVU. Our model served as a reliable screening testbed to systematically analyze the neurorestorative behaviors of various stem cell types currently tested in clinics for stroke treatment.
Results
Chip design for the reconstruction of functional BBB.
The key advantage of in vitro model is the capacity of the real-time monitoring of the cell behaviors. In order to efficiently observe the hierarchical cell behaviors during the disease progression and recovery, we applied a widely used design of multi-channel microfluidic chip14 in which different types of cells are positioned side-by-side on the same focal plane of traditional optical microscopes (Fig. 1a). Our microfluidic chip has three channels; the ‘blood-side’ channel through which the bloodstream is simulated, the ‘brain’ channel in which the neural cells form a native 3D structure in a hydrogel matrix, and the ‘cerebrospinal fluid (CSF)-side’ channel which provides an additional access to the neural cells in the ‘brain’ channel (Fig. 1a i & iii). The overall process to prepare the samples is described in Figure 1a ii. For the hydrogel matrix, we used a soluble form of basement membrane purified from Engelbreth-Holm-Swarm (EHS) tumor (Cultrex™, Trevigen) with major components of laminin, collagen IV, entactin, fibronectin, entactin, and heparan sulfate proteoglycans. The basement membrane derived from EHS tumor has an elastic modulus of around 0.5 kPa15, within the range of the physiological stiffness of brain tissues16, and supports the neuronal differentiation of neural progenitor cells (NPC)17 as well as neuronal survival and functions18. In the initial chip design, we had adopted an approach14 where each microfluidic channel was separated by micro-poles to generate the surface tension necessary to confine the liquid hydrogel prepolymer within the designated channel (Supplementary Figure 1). An endothelium was to be formed on the side wall of the hydrogel in the ‘brain’ channel, perpendicular to the x-y plane of the entire structure. However, we found that these micro-poles interfered with the endothelial cells and kept them from forming a continuous and intact endothelium, causing physical defects (Supplementary Figure 1). These defects could be a major pitfall in assessing the actual efficacy of the stem cell therapeutics using our model, because they would serve as an artificially easy shortcut for the stem cells or bioactive substances in the bloodstream to reach the ischaemically damaged brain.
Figure 1 |. Characterization of BBB reconstructed in a microfluidic chip.
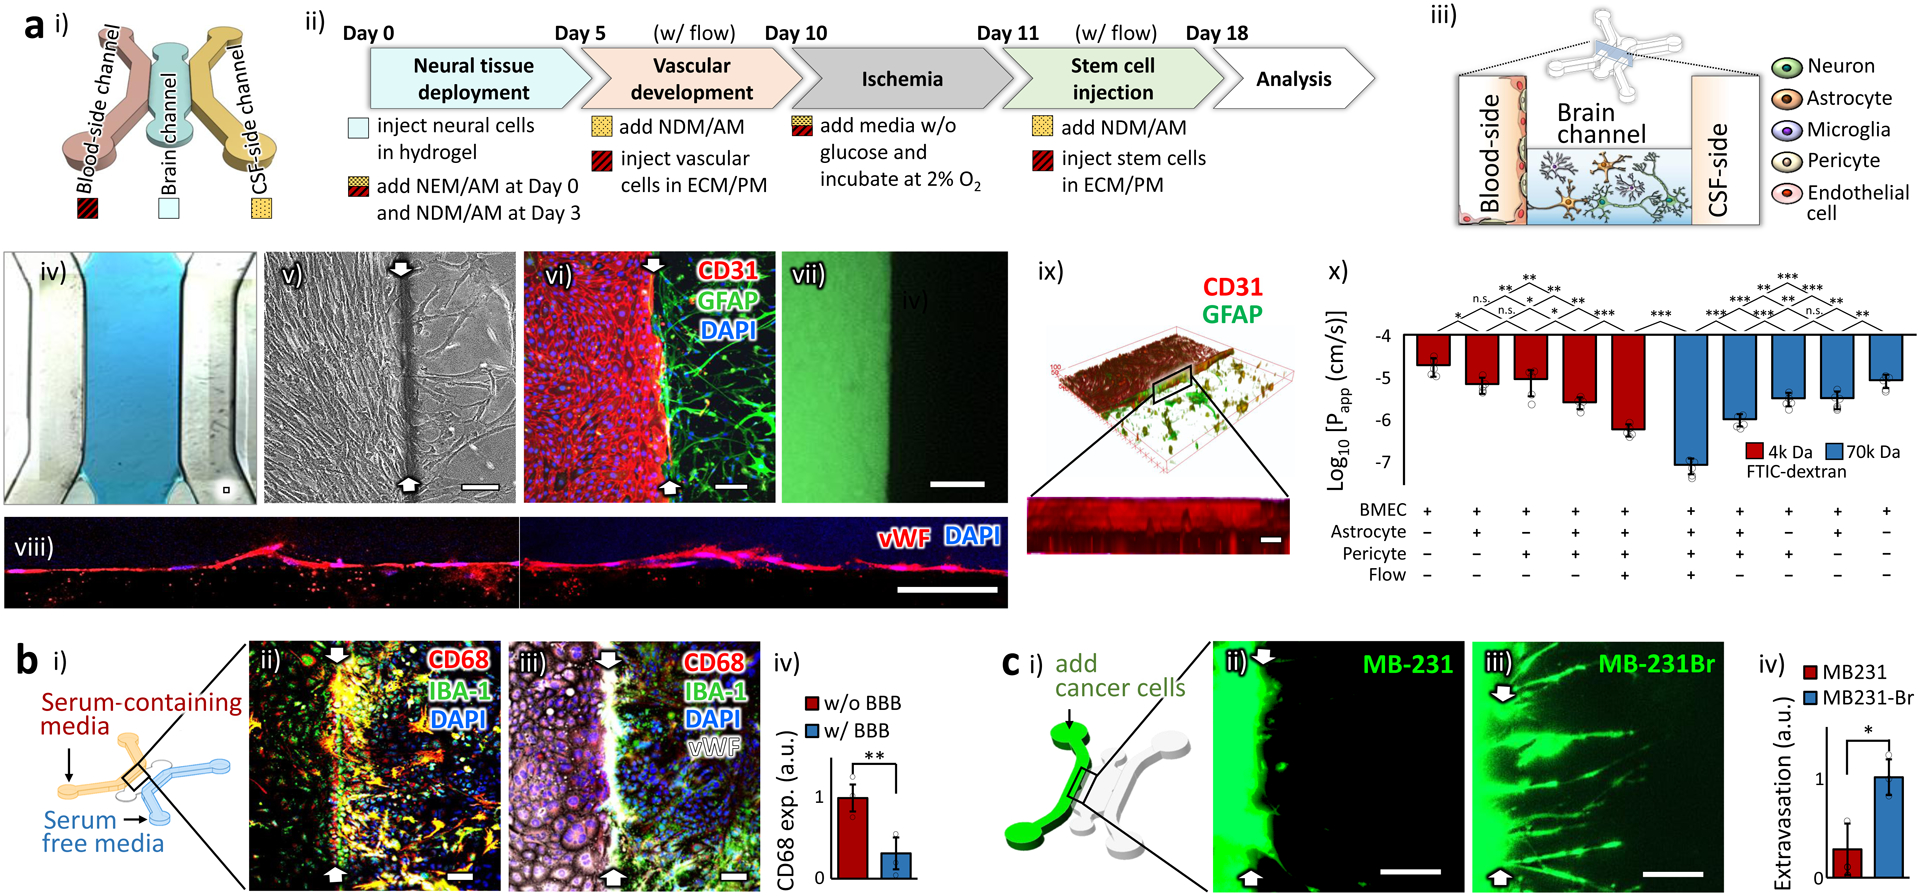
a. Physically intact barrier. (i) The schematic illustration of the chip design. (ii) The optimized protocol. NEM/AM: mixed medium of neural expansion medium and astrocyte medium. NDM/AM: mixed medium of neural differential medium and astrocyte medium. ECM/PM: mixed medium of endothelial cell medium and pericyte medium. Neural cells: neuron, astrocyte and microglia at the expected final ratio of 8:4:1, Vascular cells: BMEC and pericyte at the ratio of 9:1. (iii) The spatial distribution of the NVU constituent cells in the chip. (iv) A bright field image showing the hydrogel (blue) deployed in the ‘brain’ channel. (v-vi) The well-defined boundaries (white arrows) between the ‘blood-side’ (left) and ‘brain’ (right) channels are shown in a phase contrast (v) and a fluorescent (vi) images. Endothelial cells and astrocytes were stained by CD31 and GFAP, respectively. (vii) The formed endothelium prevented free diffusion of the green fluorescent probes (FITC-Dextran, 4k Da) across it. The image was taken one hour after adding the probes. (viii) Single layers of confocal microscopic images of the formed endothelium on the side wall of the hydrogel. The endothelial cells were stained by von Willebrand factor (VWF). (ix) The 3D reconstructed view of the confocal microscopic images showing the uniform endothelium. Endothelial cells and astrocytes were stained with their specific markers, CD31 and GFAP, respectively. (x) Log-transformed value of the apparent permeability coefficients, Papp, of the endothelium in the chips (n=5). Statistical analysis was performed using one-way analysis of variance (ANOVA) with Bonferroni-Holm post hoc test. The actual numbers are presented in Supplementary Table 1. b. Biochemically intact barrier. (i) The schematic illustration of the hybrid culture condition with serum-containing media in the ‘blood-side’ channel and serum-free media in the ‘CSF-side’ channel. (ii) In the sample w/o endothelium (white arrows indicated the hydrogel boundary), microglia (stained as green by IBA-1) upregulated the expression of CD68 (red), a pro-inflammatory microglial marker, and appeared as yellow. (iii) In the sample with the reconstructed endothelium, most of the microglia did not express CD68. (iv) The CD68 expression between the samples w/ and w/o endothelium (n=3). All analyses were made 24 hours after serum was added. Statistical analysis was performed with one-tailed Student’s t-test (p=0.0054). c. Cell-selective barrier. (i) The schematic illustration showing the cancer cell incorporation. The prestained cells of two human breast cancer cell lines, MB-231 and MB-231Br, were injected into the ‘blood-side’ channel. (ii-iii) The fluorescent images for MB-231(ii) and MB-231Br (iii), taken 3 day after the injection. White arrows indicate the hydrogel boundary. (iv) The extent of the extravasation across the BBB was measured (n=3). Statistical analysis was performed with one-tailed Student’s t-test (p=0.010). ‘n’ denotes the number of biological replicates, independent chips, used in each experimental condition. The error bars on the bar graphs show standard deviation (s.d.) from the mean. Dots along the bar graphs represent individual data points. Statistical significance is denoted as ‘n.s.’, ‘*’, ‘**’, or ‘***’ for p>0.05, p<0.05, p<0.01, or p<0.001, respectively. Scale bars: 100 μm.
We thus conceived a new chip design without any micro-poles but still with the real-time monitoring capacity in the same microscopic focal planes. With this design, the height of the middle ‘brain’ channel was lowered to generate the surface tension between the top and the bottom surfaces (Fig. 1a iii & Supplementary Fig. 2) and to stably hold the liquid hydrogel prepolymer in the ‘brain’ channel (Fig. 1a iv). As expected, a well-defined boundary was formed between the ‘blood-side’ and ‘brain’ channels in the chip (Fig. 1a v & vi). The reconstructed endothelium prevented free diffusion of a fluorescent probe (FITC-dextran, 4 k Da) across itself (Fig. 1a vii). The probe size of 4k Da is useful to evaluate the BBB functionality because most pathogens, such as viruses and bacteria, are larger than 4k Da and the native BBB prevents these pathogens from entering the brain8. Confocal microscopic images showed the continuous and physically intact endothelial barrier (Fig. 1a viii & ix) in contrast to the one in the previous chip design with micro-poles (Supplementary Fig. 1). Our chip design is devoid of micrometer-scaled features, eliminating the need for the soft lithography process in chip production, and enables us to utilize a 3D printer (Supplementary Fig. 2).
Before the endothelium formation, there was a small population of astrocytes in the ‘blood-side’ channel migrating from the ‘brain’ channel (0.9 ± 0.3 (mean ± standard deviation (s.d.)) % of the totally incorporated astrocytes, n=3, Supplementary Fig. 3). These migrated astrocytes, together with pericytes, supported BMEC to maintain the normal morphology of a smooth rounded shape throughout the ‘blood-side’ channel (Supplementary Fig. 4), just like the morphology of BMEC when co-cultured with both astrocytes and pericytes in 2D culture19. The astrocytes and pericytes in the ‘blood-side’ channel settled beneath the layer of the endothelial cells at the bottom, as the BMEC connected to each other, maturing to form an endothelium (Supplementary Fig. 3). It might be due to the angiogenic process in which endothelial cell-to-cell junctions strengthen the connection between the neighboring endothelial cells20.
We examined the endothelial tightness under different conditions, depending on the cell composition and the presence of flow, by calculating the apparent permeability coefficients (Fig. 1a x & Supplementary Table 1). In the presence of astrocytes and pericytes, the endothelium became significantly tighter to hinder the diffusion of the probe, FITC-dextran (Fig. 1a x). Further significant reduction in the permeability was observed after the flow of culture media was introduced (Fig. 1a x). This tightening of the endothelium in the presence of flow is in line with the reports of enhanced paracellular connectivity in BBB by proper mechanical stimuli8. The resulting permeability coefficients of our BBB model were ~6´10−7 cm/s and ~ 8´10−8 cm/s for 4k Da and 70k Da FITC-dextran, respectively, comparable to those of other in vitro and in vivo BBB models previously reported21. The reconstructed BBB also showed the expected size-selective permeability as in functional BBB22; the smaller the probe size, the better the diffusion across the BBB (Fig. 1a x). Another standard measure to assess the BBB tightness is Trans-Endothelial Electrical Resistance (TEER) 23. TEER measurement is a simple, label-free and non-invasive method to quantify the barrier integrity. There is a broad range of TEER values reported for microfluidic BBB models, from a few hundred13,24–26 to thousands27,28 of Ω∙cm2, while their permeability coefficients are within a relatively narrow range of around 1×10⁻⁶ cm/s for 4k Da FITC-Dextran. This might be because the TEER values are largely dependent on the method of measurement and experimental procedures29. Alternating currents (AC) are widely used for TEER measurement because direct currents (DC) can damage cells23. And tetrapolar AC TEER measurement, using four electrodes, is more accurate than bipolar AC measurement as it is less influenced by the polarization impedance at the electrode-electrolyte interface30. Due to the small surface area of the BBB in our chip, however, the resistance across the BBB was expected to reach several mega-ohms, beyond a measurable range of tetrapolar AC TEER meters commercially available. We therefore used a bipolar DC measurement and the TEER value of the BBB in our chips was 370 ± 20 (s.d.) Ω∙cm2 under the flow (Supplementary Fig. 5). The TEER value measured in our chip is lower than those reported in some of the microfluidic BBB models27,28, but showed meaningful differences between conditions (Supplementary Fig. 5).
Once we confirmed the physical intactness of the endothelium, we examined the functional characteristics of the reconstructed endothelium as a bio-chemically intact barrier. One of the important functions of the cerebral endothelium in vivo is to isolate the neural cells in the brain parenchyma from any pro-inflammatory substances in the bloodstream7. To maintain the original phenotype of the cells in each channel of our chip, we deployed two different types of media: serum-containing endothelial media in the ‘blood-side’ channel and serum-free glial cell media in the ‘CSF-side’ channel (Fig. 1b i). The reason for this setup is that the endothelial cells require serum to maintain their original phenotype in vitro, whereas the glia cells show pro-inflammatory behaviors in the serum-containing culture medium31. Serum, extracted from the whole blood, is an undefined mixture of proteins, hormones, minerals, growth factors, and lipids. The reconstructed BBB thus needs to prevent the entry of any pro-inflammatory substances from the serum in the ‘blood-side’ channel. In the samples without BBB, the microglia, a resident immune cell type in the brain, showed pro-inflammatory behaviors as expected (Fig. 1b ii) because they were directly exposed to the serum. In contrast, in the samples with the reconstructed BBB, the microglia did not show such pro-inflammatory behaviors (Fig. 1b iii & iv), confirming the BBB in our chip as a bio-chemically intact barrier, similar to the native BBB31.
To be a clinically relevant model for stem cell therapy, the BBB on our chip should also exhibit distinct responses based on the traits of the invading cells. The neurorestorative efficacy of each stem cell type may depend on their capacity to infiltrate across the tight BBB and reach the lesion site, and yet little is known about the native BBB responses to the candidate types of stem cells in therapy. Therefore, as a valid measure to show the cell-selective responsivity of the BBB, we propose to utilize the well-established metastatic behaviors of the two human breast cancer cell lines, MB-231 and its brain metastatic derivative population, MB-231Br. MB-231Br infiltrates specifically across the BBB and exhibits much stronger metastatic tendency than MB-231 in an animal model32. The reconstructed BBB in our stroke model showed the expected cell-specific responses to these two types of invading cancer cells (Fig. 1c), confirming the in vivo-like functionality of our model and verifying its sensitivity to the traits of the invading cells.
Establishing the ischaemia.
After confirming the formation of a functional BBB in our chip, we established an ischaemic condition. There are two major zones of ischaemic injury: the core infarct zone and the ischaemic penumbra, also called as peri-infarct rim33. The core infarct zone is characterized by no blood supply and severe necrosis of neural cells, and is considered irreversibly injured33. In contrast, the ischaemic penumbra, the rim surrounding the irreversibly damaged core, has just enough blood supply for the cells to survive but not enough to communicate and function properly33. This peri-infarct rim has been considered as a therapeutic target for post-stroke recovery34,35. We thus targeted to establish an ischaemic condition recapitulating this peri-infarct zone, sufficiently damaging cells and yet minimizing cell death.
The optimized ischaemic condition in our system was 2% O2 with depletion of serum and glucose for 24 hours, in the absence of flow36. Our ischaemic condition sustained the cell viability (Fig. 2a i – iii), while inducing detectable cytotoxicity (Fig. 2a iv) measured by the amount of the extracellular lactate dehydrogenase (LDH) released through the damaged cell membranes. We also observed that hypoxia-inducible factor-1α (HIF-1α), usually found in the cytoplasm of the cells under normoxic condition (Fig. 2a v & vi), translocated to the nucleus (Fig. 2a vii & viii), as observed in the ischaemic brain in vivo 37. According to the gene expression alteration pattern in our chip (Fig. 2b), the ischaemic insult upregulated the genes in both the apoptotic and the antiapoptotic signaling cascades (Apoptosis group), just as reported in animal ischaemic stroke model38. Oxidation-reduction reaction (Redox group) was also upregulated, implying the cells protected themselves against the elevated intracellular levels of reactive oxygen species in ischaemia39. The upregulation of the neurotrophic and angiogenic factors (Trophic factors group) suggest the attempts of the ischaemically damaged cells to repair and remodel themselves40. The cells also exhibited typical neuroinflammatory responses against ischaemic stroke41 as shown in the upregulated gene expressions of Pro-inflammatory cytokines and Integrin groups. The downregulated expression of extracellular matrix proteins (ECM proteins group), together with the enhanced activities of matrix metalloproteinases (MMP group) and the decreased interaction between the cells and ECM (Cell adhesion group) imply that the ischaemic insult led to the impairment of tissue integrity as well as the subsequent tissue remodeling process. Overall, these gene expression patterns collectively indicate that our ischaemic condition induced inflammation and deterioration in tissue integrity as expected and also accompanied endogenous neuroprotection and tissue remodeling, as reported in many other in vivo stroke models40. More detailed information on individual genes is presented in Supplementary Table 2.
Figure 2 |. Establishing ischaemia.
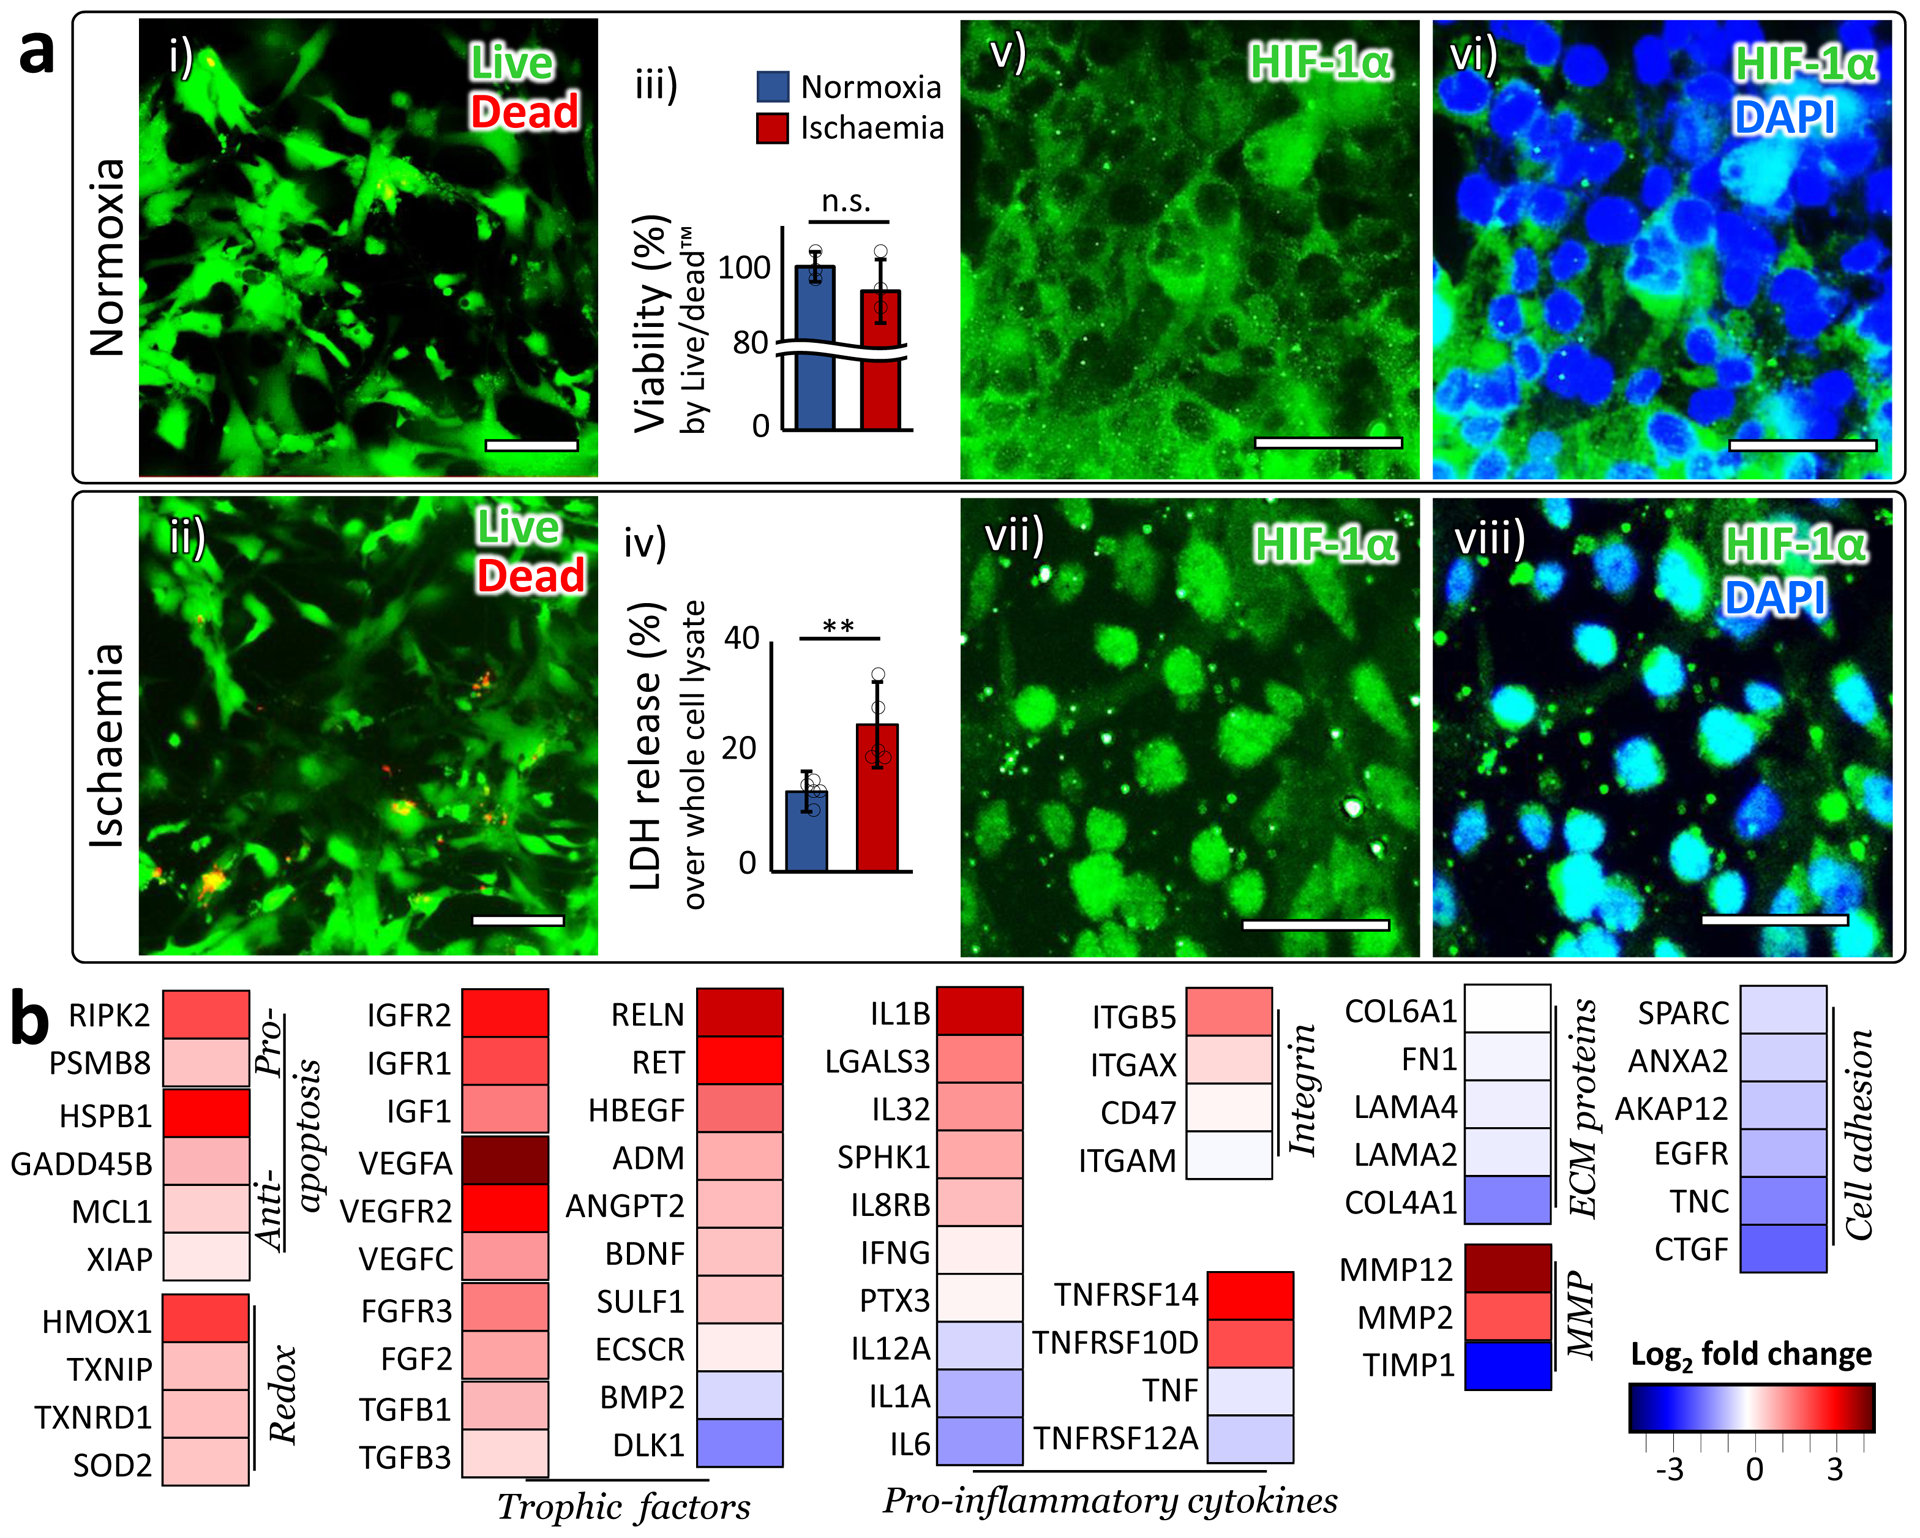
a. (i-ii) Live/dead assay: Live cells were stained as green by calcein AM, while dead cells were stained as red by ethidium homodimer (EthD-1). Scale bars: 100 μm. (iii) Quantified viability measured by Live/dead assay (n=3). Statistical analysis was performed with one-tailed Student’s t-test (p=0.16). (iv) Cytotoxicity measured by extracellular LDH level (n=5). Statistical analysis was performed with one-tailed Student’s t-test (p=0.0087). (v-viii) In normoxia, HIF-1α mainly located in the cytoplasm (v-vi). In our ischaemic condition, HIF-1α accumulated in the nucleus (vii-viii). All images were taken from the ‘brain’ channel. ‘n’ denotes the number of biological replicates, independent chips, used in each experimental condition. The error bars on the bar graphs show s.d. from the mean. Dots along the bar graphs represent individual data points. Statistical significance is denoted as ‘n.s.’ or ‘**’ for p>0.05, 0.001<p<0.01, respectively. b. Gene expression alteration induced by ischaemia. Log2 fold changes are plotted in the heatmap. The genes are clustered into groups according to their functions. More detailed description on the functions of each gene is presented in Supplementary Table 2
Verifying the NVU behaviors.
To verify the functionality of the reconstructed NVU, we examined individual cell behaviors at various levels both under healthy and ischaemic conditions. At gene level, we measured the expression alteration of the genes associated with a series of post-stroke pathological conditions and categorized them based on their functional characteristics. Since most of the genes are not cell-specific and involved in multiple cellular processes, this grouping is solely for the purpose of outlining the overall pattern of the responses across the cell population in our experiments. More detailed information on individual genes is presented in Supplementary Table 2.
NEURONS are the primary component of the central nervous system and play critical roles in neurological functions. Considering the short lifespan and limited expansion capacity of the primary human neurons in vitro, we used the human iPSC (induced pluripotent stem cell)-derived neural progenitor cells (NPC) in our stroke model and optimized the culture conditions of the chip for their neuronal differentiation. The differentiated NPC exhibited the neuronal morphology of a cell body and branches of axons and dendrites (Fig. 3a i), and expressed mature neuron markers such as microtubule-associated protein 2 (MAP-2) and Synapsin I and II (SYN), a family of proteins regulating neurotransmitter release at synapses (Fig. 3a ii). They also maintained proximity with the astrocytes in our chip (Fig. 3a iii). Under ischaemic condition, they showed dendritic beading or fragmentation (Fig. 3a v), a typical morphology of degenerating neurons42, compared to the smooth and clear dendritic morphology observed in normoxia (Fig. 3a i). They were also stained by a neuronal degeneration marker Fluoro-Jade stain (Fig. 3a iv vs. vi), consistent with the reports from in vivo ischaemic stroke models43.
Figure 3 |. Behaviors of neurons, BMEC, and pericytes.
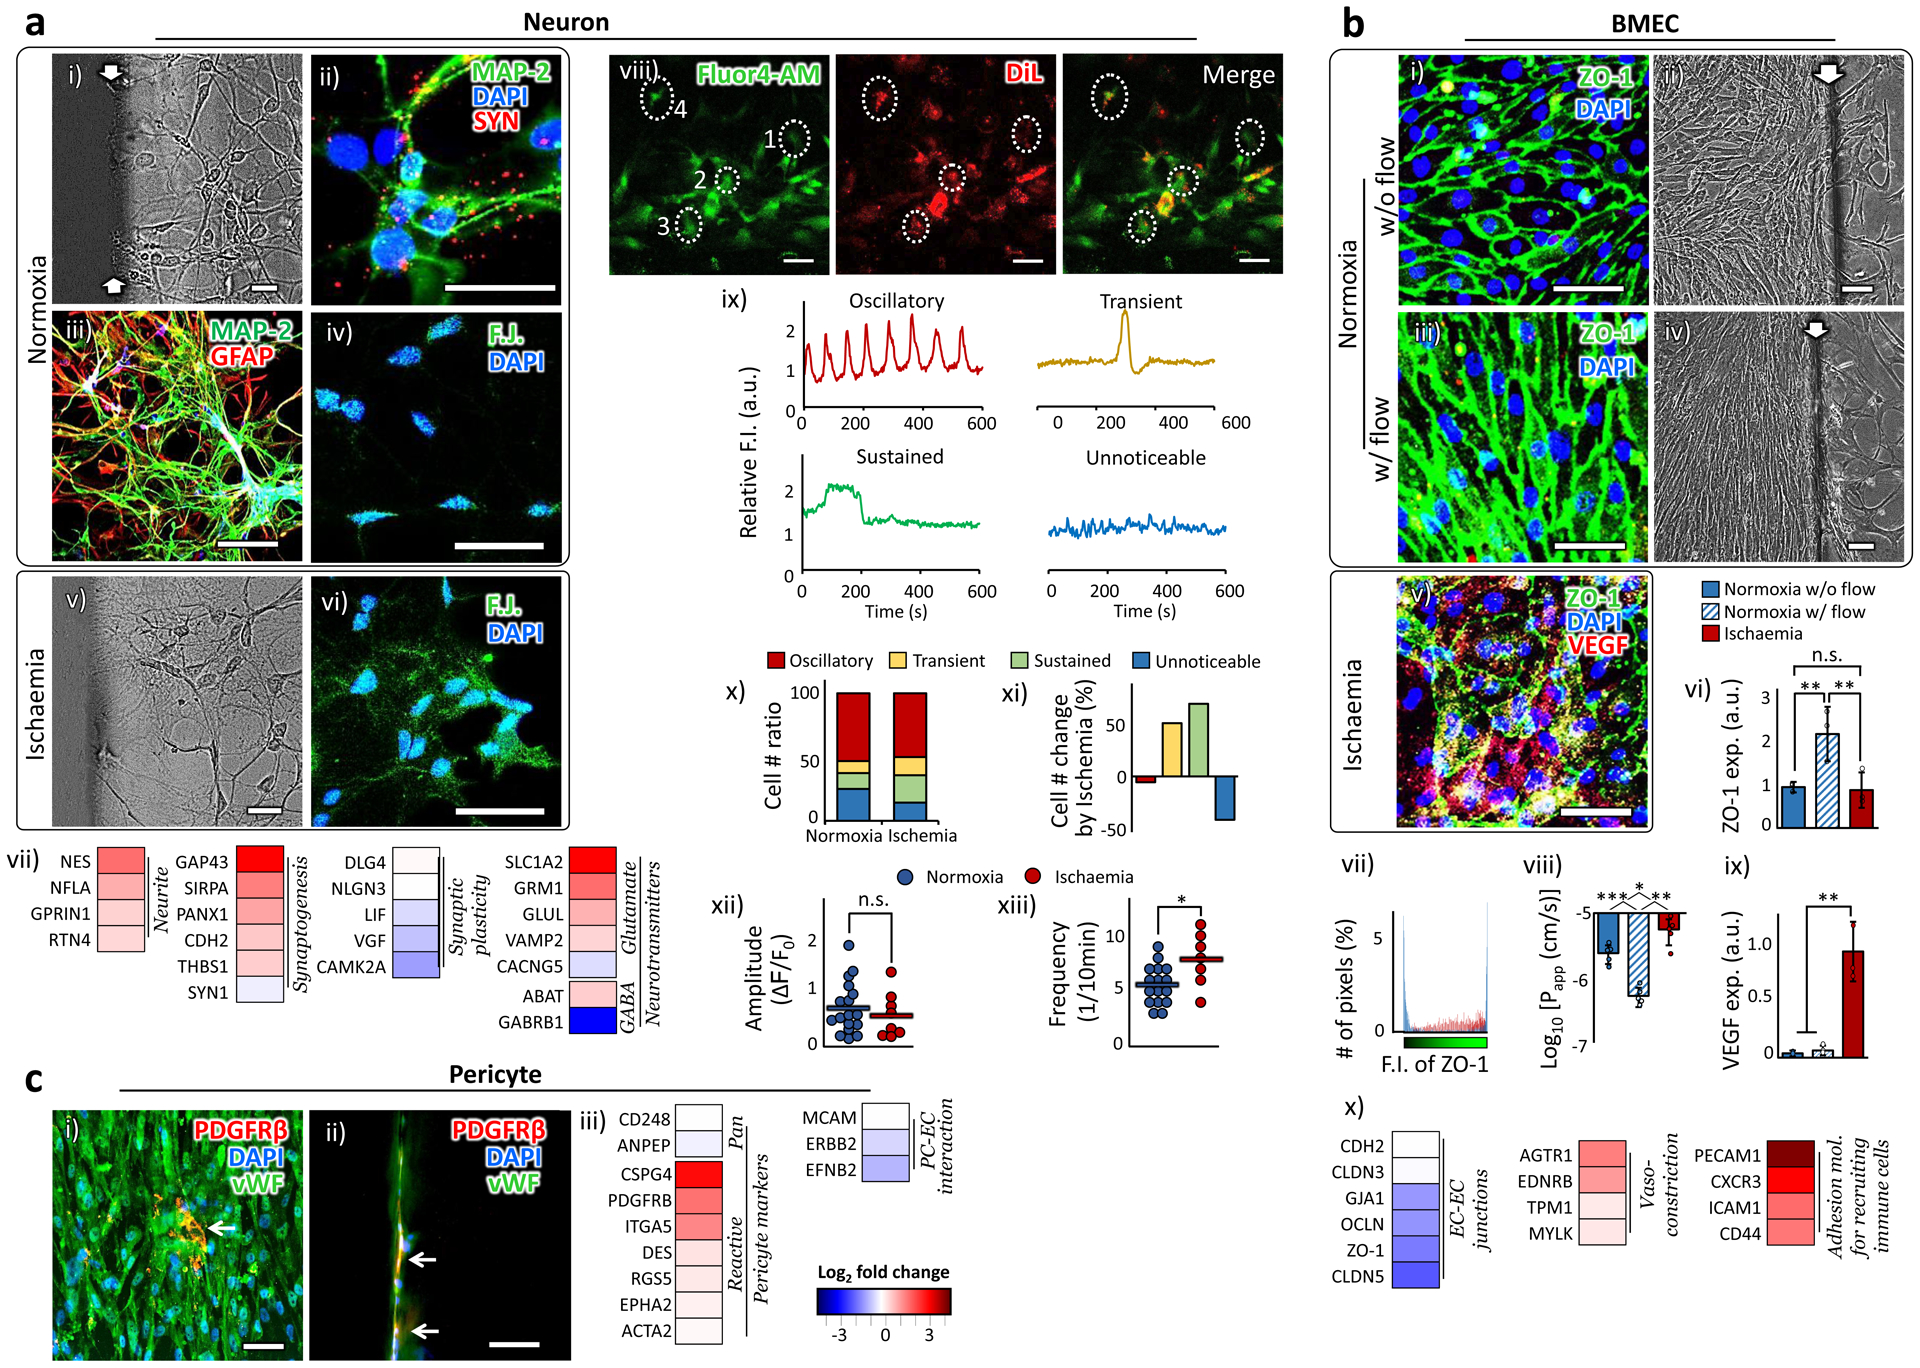
a. Neuron. (i) A phase contrast image of neurons in a normoxic sample. (ii) The neurons derived from human iPSC expressed mature neuronal markers, MAP-2 and Synapsin I and II (SYN). (iii) NVU cellular components were immuno-stained with a neuronal marker, MAP-2, and an astrocyte marker, GFAP. (iv) Fluoro-Jade C, a neuronal degeneration marker, barely stained the neurons in normoxia. (v) A phase contrast image of neurons in a hypoxic sample. (vi) Fluoro-Jade C stained the neurons in hypoxia. (vii) Gene expression alteration by ischaemia. viii-xiii show Spontaneous oscillations of cytosolic calcium ions (Ca2+) in differentiated NPC. (viii-ix) Representative calcium recording images (viii). NPC were prestained with DiL (red). Fluo-4 AM (green) was used to detect cytosolic Ca2+ concentration. The DiL-expressing cells were randomly chosen from four independent samples, two each in normoxia (34 cells) and ischaemia condition (14 cells). The differentiated NPC showed four distinct Ca2+ oscillation patterns for 10 minutes of recording (ix). The marked cells from 1 to 4 in (viii) showed oscillatory, transient, sustained and unnoticeable patterns, respectively. (x-xi) The ratio of cell numbers for each Ca2+ oscillation pattern (x) and the changes in the cell numbers due to ischaemia (xi). (xii-xiii) The amplitude and frequency of the calcium oscillation in the cells showing oscillatory Ca2+ signals. The horizontal bars indicate the mean values and the dots represent individual data points. Statistical analysis was performed using one-tailed Student’s t-test (p=0.25 for xii and p=0.016 for xiii). b. BMEC. (i-iv) Fluorescent (i vs. iii) and phase contrast (ii vs. iv) images show the BMEC morphology with or without flow. (v) The ZO-1 and VEGF expression spread all over the bodies of BMEC in ischaemia. (vi) The overall extent of ZO-1 expression in BMEC increased with the introduction of flow and reduced back in ischaemic condition (n=3). Statistical analysis was performed using one-way ANOVA with Bonferroni-Holm post hoc test (p=0.0033 between w/o and w/ flow in normoxic samples, p=0.0044 between normoxic samples w/ flow and ischaemic samples, and p=0.62 between normoxic samples w/o flow and ischaemic samples). (vii) The spatial distribution of ZO-1 expression in an individual cell is quantified by counting the number of pixels (y-axis) corresponding the fluorescent intensity (x-axis). The ZO-1 expression in the ischaemic cells is dispersed throughout the entire cell body in contrast to the pattern of localized peaks shown in normoxic cells. (viii) The changes of log-transformed Papp by the presence of flow and ischaemic insult (n=5). Statistical analysis was performed using one-way ANOVA with Bonferroni-Holm post hoc test (p=0.00066 between w/o and w/ flow in normoxic samples, p=0.0014 between normoxic samples w/ flow and ischaemic samples, and p=0.022 between normoxic samples w/o flow and ischaemic samples). (ix) BMEC in ischaemia upregulated the VEGF expression (n=3). Statistical analysis was performed using one-way ANOVA with Bonferroni-Holm post hoc test (p=0.050 between normoxic samples w/o and w/ flow, p=0.0048 between normoxic samples w/ flow and ischaemic samples, and p=0.0042 between normoxic samples w/o flow and ischaemic samples). (x) Gene expression alteration by ischaemia. c. Pericyte. (i-ii) A few pericytes are exposed between BMEC (i) and on the side wall of the ‘brain’ channel (ii). White arrows indicate pericytes. More detailed data on pericytes distribution are presented in Fig. S3. (ii) Gene expression alteration by ischaemia. More details on the functions of each gene are presented in Supplementary Table 2. Statistical significance is denoted as ‘*’. White arrows indicate the hydrogel boundary between the ‘blood-side’ and the ‘brain’ channels. ‘n’ denotes the number of biological replicates, independent chips, used in each experimental condition. The error bars on the bar graphs show s.d. from the mean. Dots along the bar graphs represent individual data points. Statistical significance is denoted as ‘n.s.’, ‘*’, ‘**’, or ‘***’ for p>0.05, p<0.05, p<0.01, or p<0.001, respectively. Scale bars: 100 μm.
The gene expression alteration by the ischaemia (Fig. 3a vii) shows that the endogenous repair (Trophic factors group Fig. 2b) led to the upregulation of the gene groups involved in Neurite formation and Synaptogenesis, but it was accompanied by downregulation of genes related to Synaptic plasticity. We also observed the excessive stimulation of an excitatory neurotransmitter, glutamate (Glutamate group), and at the same time the decreased activity of an inhibitory neurotransmitter, Gamma-Aminobutyric acid (GABA) (GABA group; ABAT and GABRB1 are encoded in an enzyme for GABA catabolism44 and in one of the GABA receptors45, respectively). These expression patterns imply the disrupted balance between neuronal excitation and inhibition in the ischaemic condition, potentially leading to the excitotoxicity typically observed in ischaemic stroke46.
We further examined how the ischaemic condition was reflected in the cytosolic calcium (Ca2+) oscillation pattern in the differentiated NPC in our chip. The cytosolic Ca2+ imaging provides an indirect but accurate measure of the action potential generation in individual neurons 47, and represents various neuronal functions ranging from synaptic activity to cell-cell communication, adhesion, neurodegeneration and apoptosis48. The cytosolic Ca2+ images show that the differentiated NPC exhibited the typical four patterns of cytosolic Ca2+ signals47: oscillatory (repeated brief increase in free Ca2+), transient (brief elevation due to Ca2+ influx through membrane calcium channels), sustained (sustained increase in Ca2+ level by both external and internal stores), or unnoticeable signals (Fig. 3a viii & ix). The ischaemic insult decreased the ratio of cells showing the unnoticeable Ca2+ signals, while increasing the ratio of cells showing both transient and sustained signals (Fig. 3a x & xi). The accumulated Ca2+ level in the cytoplasm is thought to lead to neuronal death in animal stroke models46. Analysis on the oscillatory signal alteration by ischaemia reveals insignificant changes in the amplitude but significant increase in frequency of the oscillation (Fig. 3a xii & xiii), indicating the increased Ca2+ influx into the cells49. The excessive influx of Ca2+, together with the disrupted balance between neuronal excitation and inhibition (Neurotransmitters group in Fig. 3a vii), show excitotoxic neurodegeneration50 in our ischaemic samples.
BRAIN MICROVASCULAR ENDOTHELIAL CELLS (BMEC) are the primary cellular component of the cerebral vasculature, BBB. Human primary BMEC were used throughout this study. BMEC have a high mitochondrial density, lack of fenestrations, low pinocytic activity, and high density of adherent and tight junctions compared to the endothelial cells found in other tissues29,51. The tight junctions determine the paracellular tightness of the endothelial cells and the permeability across BBB8. Zonula occludens-1 (ZO-1) is a dominant junctional adaptor protein, regulating other junctional components, cell-cell tension, angiogenesis, and BBB formation52. The flow through ‘blood-side’ channel increased the expression of ZO-1 and caused the shape of the cell body to elongate along the direction of the simulated bloodstream (Fig. 3b i–iv). The upregulated ZO-1 expression in the samples with flow led to the upregulated expression of other junctional proteins, vascular endothelial (VE)-cadherin and Claudin-5 (Supplementary Fig. 6). The ZO-1 expression of the ischaemic samples significantly decreased compared to the samples in normoxia with the flow, but was statistically comparable to the normoxic samples without the flow (Fig. 3b v & vi). Importantly, the expression of ZO-1, mainly localized on the cell membrane under normoxia conditions (Fig. 3b iii & vii), spread throughout the cell body under ischaemic conditions (Fig. 3b v & vii). This dispersed spatial distribution of ZO-1 in the ischaemic samples led to the increased permeability of fluorescence probe (4k Da FITC-dextran, Fig. 3b viii), representing the reduced paracellular tightness53 under ischaemia. These results suggest that the paracellular tightness among the endothelial cells is affected more significantly by the extent of tight junction localization on the cell membrane, rather than the overall level of their expression. The BMEC in the ischaemic samples significantly increased the expression of the vascular endothelial growth factor (VEGF), one of the angiogenic factors (Fig. 3b v & ix), suggesting the post-stroke vascular reorganization took place in our model, as observed in an animal stroke model54. At the gene level (Fig. 3b x), the ischaemic insult decreased the endothelial paracellular connectivity (EC-EC junctions group), but upregulated the genes involved in Vasoconstriction and Adhesion molecules for recruiting immune cells, as observed in animal stroke models55,56.
BMEC behaviors have been well documented in various experimental conditions. In a mono-culture of human BMEC, the shear stress induced by the flow did not significantly affect the expression of the tight junction proteins or their morphology57. On the other hand, the flow condition in a mono-culture of bovine BMEC led to the upregulation of tight junction proteins and the morphological alignment along the flow direction58. In another in vitro work19, rat BMEC required the appropriate interactions with both the astrocytes and the pericytes to show their original pattern of tight junction localization around the cell membrane, as we observed in our model (Supplementary Fig. 4). Taken together, these results suggest that in order for human BMEC to exhibit in vivo-like behaviors, they need some of the key components of the original BBB microenvironment: the mechanical stimuli by the blood flow and the heterocellular network in NVU. Our stroke model provides both of these essential microenvironment features, allowing for in vivo-like behaviors of human BMEC.
PERICYTES are mural cells of the microvasculature, and regulate BBB permeability, angiogenesis, clearance, cerebral blood flow, neuroinflammation and stem cell activity59. We used human primary brain vascular pericytes throughout this study. Figure 3c i & ii show that the pericytes in our chip expressed platelet derived growth factor receptor beta (PDGFRβ), one of the pericyte specific makers60, and positioned themselves between the mature endothelium and the side wall of the ‘brain’ channel. More detailed data on pericytes distribution are presented in Supplementary Figure 3. The pericytes were activated in response to the ischaemic injury (Pericyte markers groups in Fig. 3c iii), contributing to vascular inflammation59. The interaction of pericytes with endothelial cells, crucial for the vascular stability under normal condition61, was downregulated (PC-EC interaction group).
ASTROCYTES are the dominant glial cell type in the brain and play many mediating roles in the heterocellular interactions in NVU62. We used human primary astrocytes throughout this study. One of their roles is to sense neuronal metabolic activities and coordinate vasodilation and vasoconstriction to match the blood flow accordingly62. Astrocytes carry out these intermediary roles through direct contact-based interactions with the endothelial cells62. In our chip, oxygen and nutrients are provided only through the ‘blood-side’ and ‘CSF-side’ channels so that the astrocytes in the ‘brain’ channel would have to migrate and extend their endfoot toward the formed endothelial layer at the boundary to access the nutrients, thus forming a physical contact with it. We indirectly confirmed this physical contact through the immunofluorescence staining of water channel proteins encoded by Aquaporin-4 (AQP4), the most abundant water channels in the brain63. The water channels in astrocytes are localized around astrocytic endfoot in direct contact with the blood vessel under normal conditions64 (Fig. 4a i & ii). This polarized location reflects their mediating role in gaseous exchange including O2, CO2, and NO65. In inflammatory conditions like ischaemia, the immunoreactivity of AQP4 in astrocytes bleeds away from endfoot (Fig. 4a iii & iv), implying the disruption of the mediating role of AQP464. In addition, the astrocytes in the ischaemic samples showed the reactive astrogliosis66, characterized by abnormal hypertrophy (Fig. 4a v–vii), massive proliferation, and upregulated Glial Fibrillary Acidic Protein (GFAP) expression levels (Fig. 4a viii). Astrocytes failed to show these behaviors in the traditional 2D culture conditions (Supplementary Fig. 7). The gene expression pattern (Fig. 4a ix) reveals a heterogeneous population of astrocytes mixed with both A1 (inflammation-induced) and A2 (ischaemia-induced) phenotypes (Astrocyte reactive markers groups), as reported in in vivo stroke models67. The activated astrocytes in turn decreased their trophic support for the neurons in our ischaemic stroke model (AC-neuron interaction group), consistent with the reports from other stroke models66.
Figure 4 |. Behaviors of astrocyte and microglia.
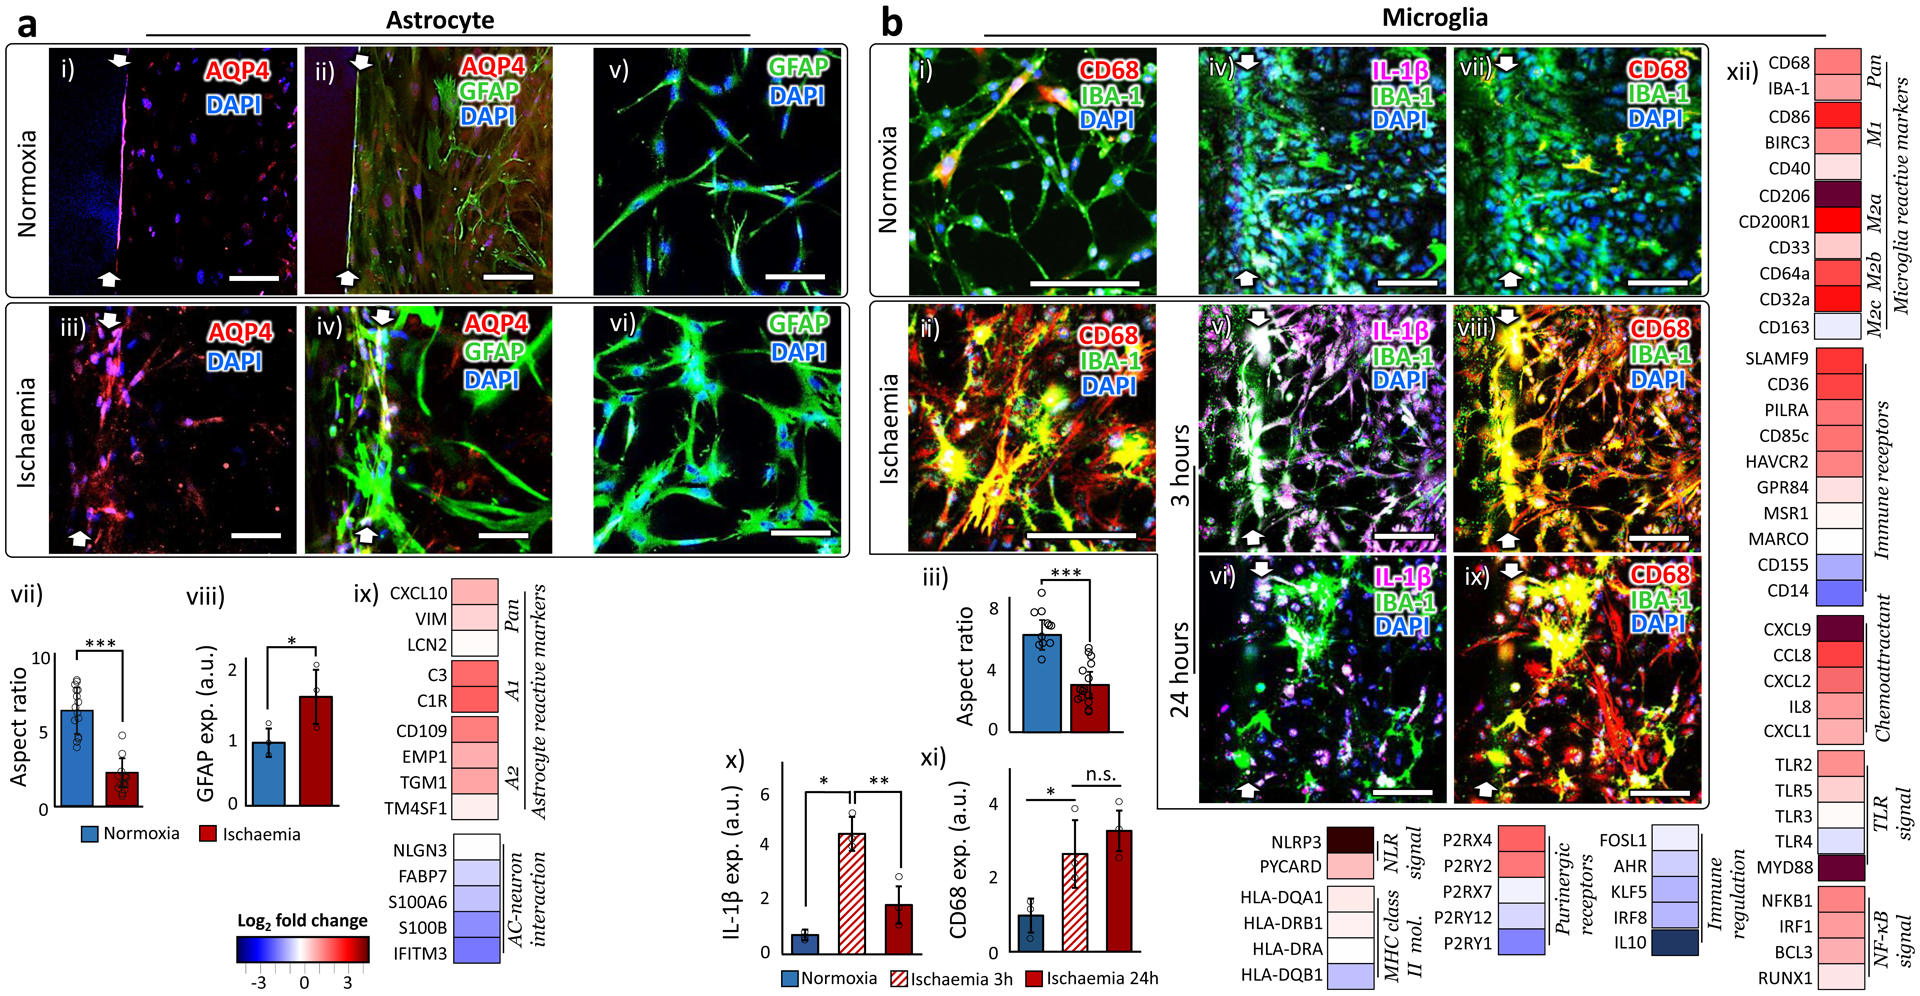
a. Astrocyte. (i-iv) AQP4 in the normoxic astrocytes are localized along the formed endothelium on the side wall of the hydrogel (i-ii), while AQP4 in the ischaemic astrocytes spread over the cell bodies (iii-iv). (v-vi) GFAP expression of astrocytes in normoxic (v) and ischaemic condition (vi). (vii) The ratio between the longest and shortest axes of astrocytic cell bodies in normoxic and ischaemic samples. 15 cells from independent 3 chips were analyzed. Statistical significance was determined with one-tailed Student’s t-test (p < 0.001). (viii) Quantified GFAP expression levels of astrocytes in normoxic and ischaemic samples (n=3). Statistical significance was determined with one-tailed Student’s t-test (p=0.030). (ix) Gene expression alteration by ischaemia. c. Microglia. (i-ii) Microglia (stained by IBA-1) in ischaemia upregulated the expression of CD68. (iii) The ratio between the longest and shortest axes of microglial cell bodies in normoxic and ischaemic samples. 15 cells from independent 3 chips were analyzed. Statistical significance was determined with one-tailed Student’s t-test (p<0.001). (iv-ix) Microglial expression of IL-1 β and CD68 in normoxic and ischaemic (for 3 and 24 hours) samples. (x) Microglia upregulate the expression of IL-1β only during the first a few hours of the ischaemic onset (n=3). Statistical significance was determined using one-way analysis of variance (ANOVA) with Bonferroni-Holm post hoc test (p=0.0019 between samples of normoxia and ischaemia for 3 hours, p=0.019 between ischaemic samples for 3 and 24 hours, and p=0.11 between samples of normoxia and ischaemia for 24 hours). (xi) CD68 is expressed in microglia for the whole duration of the ischaemic condition (n=3). Statistical significance was determined using one-way analysis of variance (ANOVA) with Bonferroni-Holm post hoc test (p=0.048 between samples of normoxia and ischaemia for 3 hours, p=0.43 between ischaemic samples for 3 and 24 hours, and p=0.012 between samples of normoxia and ischaemia for 24 hours). xii) Gene expression alteration by ischaemia. More details on the functions of each gene are presented in Supplementary Table 2. White arrows indicate the hydrogel boundary between the ‘blood-side’ and the ‘brain’ channels. ‘n’ denotes the number of biological replicates, independent chips, used in each experimental condition. The error bars on the bar graphs show s.d. from the mean. Dots along the bar graphs represent individual data points. Statistical significance is denoted as ‘n.s.’, ‘*’, ‘**’, or ‘***’ for p>0.05, p<0.05, p<0.01, or p<0.001, respectively. Scale bars: 100 μm.
MICROGLIA are the resident macrophages and the only immune cell type in the brain68. Due to the issues of reliable batch-to-batch reproducibility with human primary microglia, we used a transformed human microglial cell line (HMC3, ATCC). Microglia in the brain show immediate pro-inflammatory responses to any injury or infection68. Once activated, their pro-inflammatory morphology changes are signified by the retraction and thickening of the processes, and the hypertrophy of the cell body68, which was reproduced in our ischaemic samples (Fig. 4b i–iii). They also promptly secrete interleukin-1β (IL-1β), one of the pro-inflammatory (M1) phenotype markers, within a few hours of the inflammation onset69–71. This upregulation of IL-1β, though, is only temporary and not sustained69–71. On the other hand, the expression of the cluster of differentiation 68 (CD68) and ionized calcium-binding adapter molecule 1 (IBA-1) is upregulated during M1 phase and persists throughout the anti-inflammatory (M2) phase thereafter69–71. We observed these in vivo-like temporal patterns of the IL-1β and CD68 immunoreactivity in our stroke model (Fig. 4b iv–xi). In contrast, the traditional 2D culture conditions failed to induce these behavior changes in microglia (Supplementary Fig. 8). The gene expression pattern of the microglia reactive markers group in Figure 4b xii indicate that the ischaemic onset led to the upregulation of both pro- (M1 phenotype) and anti-inflammatory (M2a and M2b phenotypes) microglial markers, as observed in in vivo studies72. Both M2a and M2b are involved in phagocytosis and produce anti-inflammatory cytokines, although their activation signal pathways are distinct from each other73. In contrast, M2c phenotype, usually regarded as a marker for the deactivating stage73, barely appeared in the 24-hour time frame after the ischaemic onset in our stroke model, consistent with the report 74 that M2c macrophages appeared only after the downregulation of the inflammation. Many other Immune receptors and Chemoattractants also showed upregulated expression level. The genes engaging both the innate and the adaptive immune responses were generally upregulated in our ischaemic condition (groups from TLR (toll-like receptors) signal to MHC (major histocompatibility complex) class II mol.), as previously reported75. The gene expression of the purinergic receptors, involved in both immune cell regulation76 and neurogenesis77, appeared rather inconsistent (Purinergic receptors group), although it was also clear that the overall immune responses were not well-regulated right after ischaemia (Immune regulation). These gene expression alterations indicate that the ischaemic insult triggered a broad spectrum of immune responses, from exacerbating the ischaemic injury to helping repair, as observed in other ischaemic stroke models72. Additional images of the NVU cells are presented in Supplementary Figure 9.
Characterizing the neurorestorative potential of stem cells.
Substantial amount of studies has supported the neurorestorative potential of stem cells for stroke treatment, but there have also been a few reports contradicting some of these observations2,78. This could be partially because the experiments were all conducted under different conditions and/or focusing on different aspects of the complicated recovery processes. Being an in vitro system, our stroke model allows for the identical experimental conditions across large number of samples and over repetitions. It thus serves as an effective testbed to systematically examine the neurorestorative capacity of clinically relevant stem cells. The stem cells examined in our stroke model include human induced pluripotent stem cell derived neural progenitor cells (hNPC), human embryonic stem cell derived neural stem cells (hNSC), human hematopoietic stem cells (hHSC), bone marrow derived mesenchymal stromal/stem cells (hBMSC), adipose derived mesenchymal stromal/stem cells (hAMSC), and endothelial cell progenitor cells (hEPC). We also examined the effect of reperfusion treatment only, without stem cells, by re-introducing oxygen and glucose after ischaemic insult.
The neuro-restoration after ischaemic stroke entails an expansive series of processes from neural cell regeneration and immune suppression, to restoration of vascular structures, and to recovery of heterocellular interactions in NVU40. We selected 123 relevant genes involved in each of these aspects based on the Human Neurogenesis Polymerase Chain Reaction (PCR) array (Qiagen) as well as our own experimental data on the ischaemic responses in our chip (Fig. 5a i). The details on the relevant functions of the selected genes and the corresponding references are presented in Supplementary Table 2 & 3. Figure 5a i & ii show the gene expression alteration by stem cells and the related Gene Ontology (GO) terms based on the STRING database of protein-protein association networks79 (available at https://string-db.org/). The first three GO terms in Figure 5a ii represent general functions (System development (GO:0048731), Biological regulation (GO:0065007) and Response to stimulus (GO:0050896)) and are common to most of the genes chosen for our study. The overall gene expression of the chosen set was generally upregulated by the incorporation of all types of stem cells as well as the reperfusion only (Fig. 5a iii & iv). When we considered the genes with over 4-fold changes in expression, hNPC and hNSC were mostly associated with strongly upregulated genes, while the opposite was true for hBMSC (Fig. 5a iv). hEPC turned up almost equal numbers of strongly up- and down-regulated genes (Fig. 5a iv).
Figure 5 |. Characterization of the neurorestorative potential of stem cells.
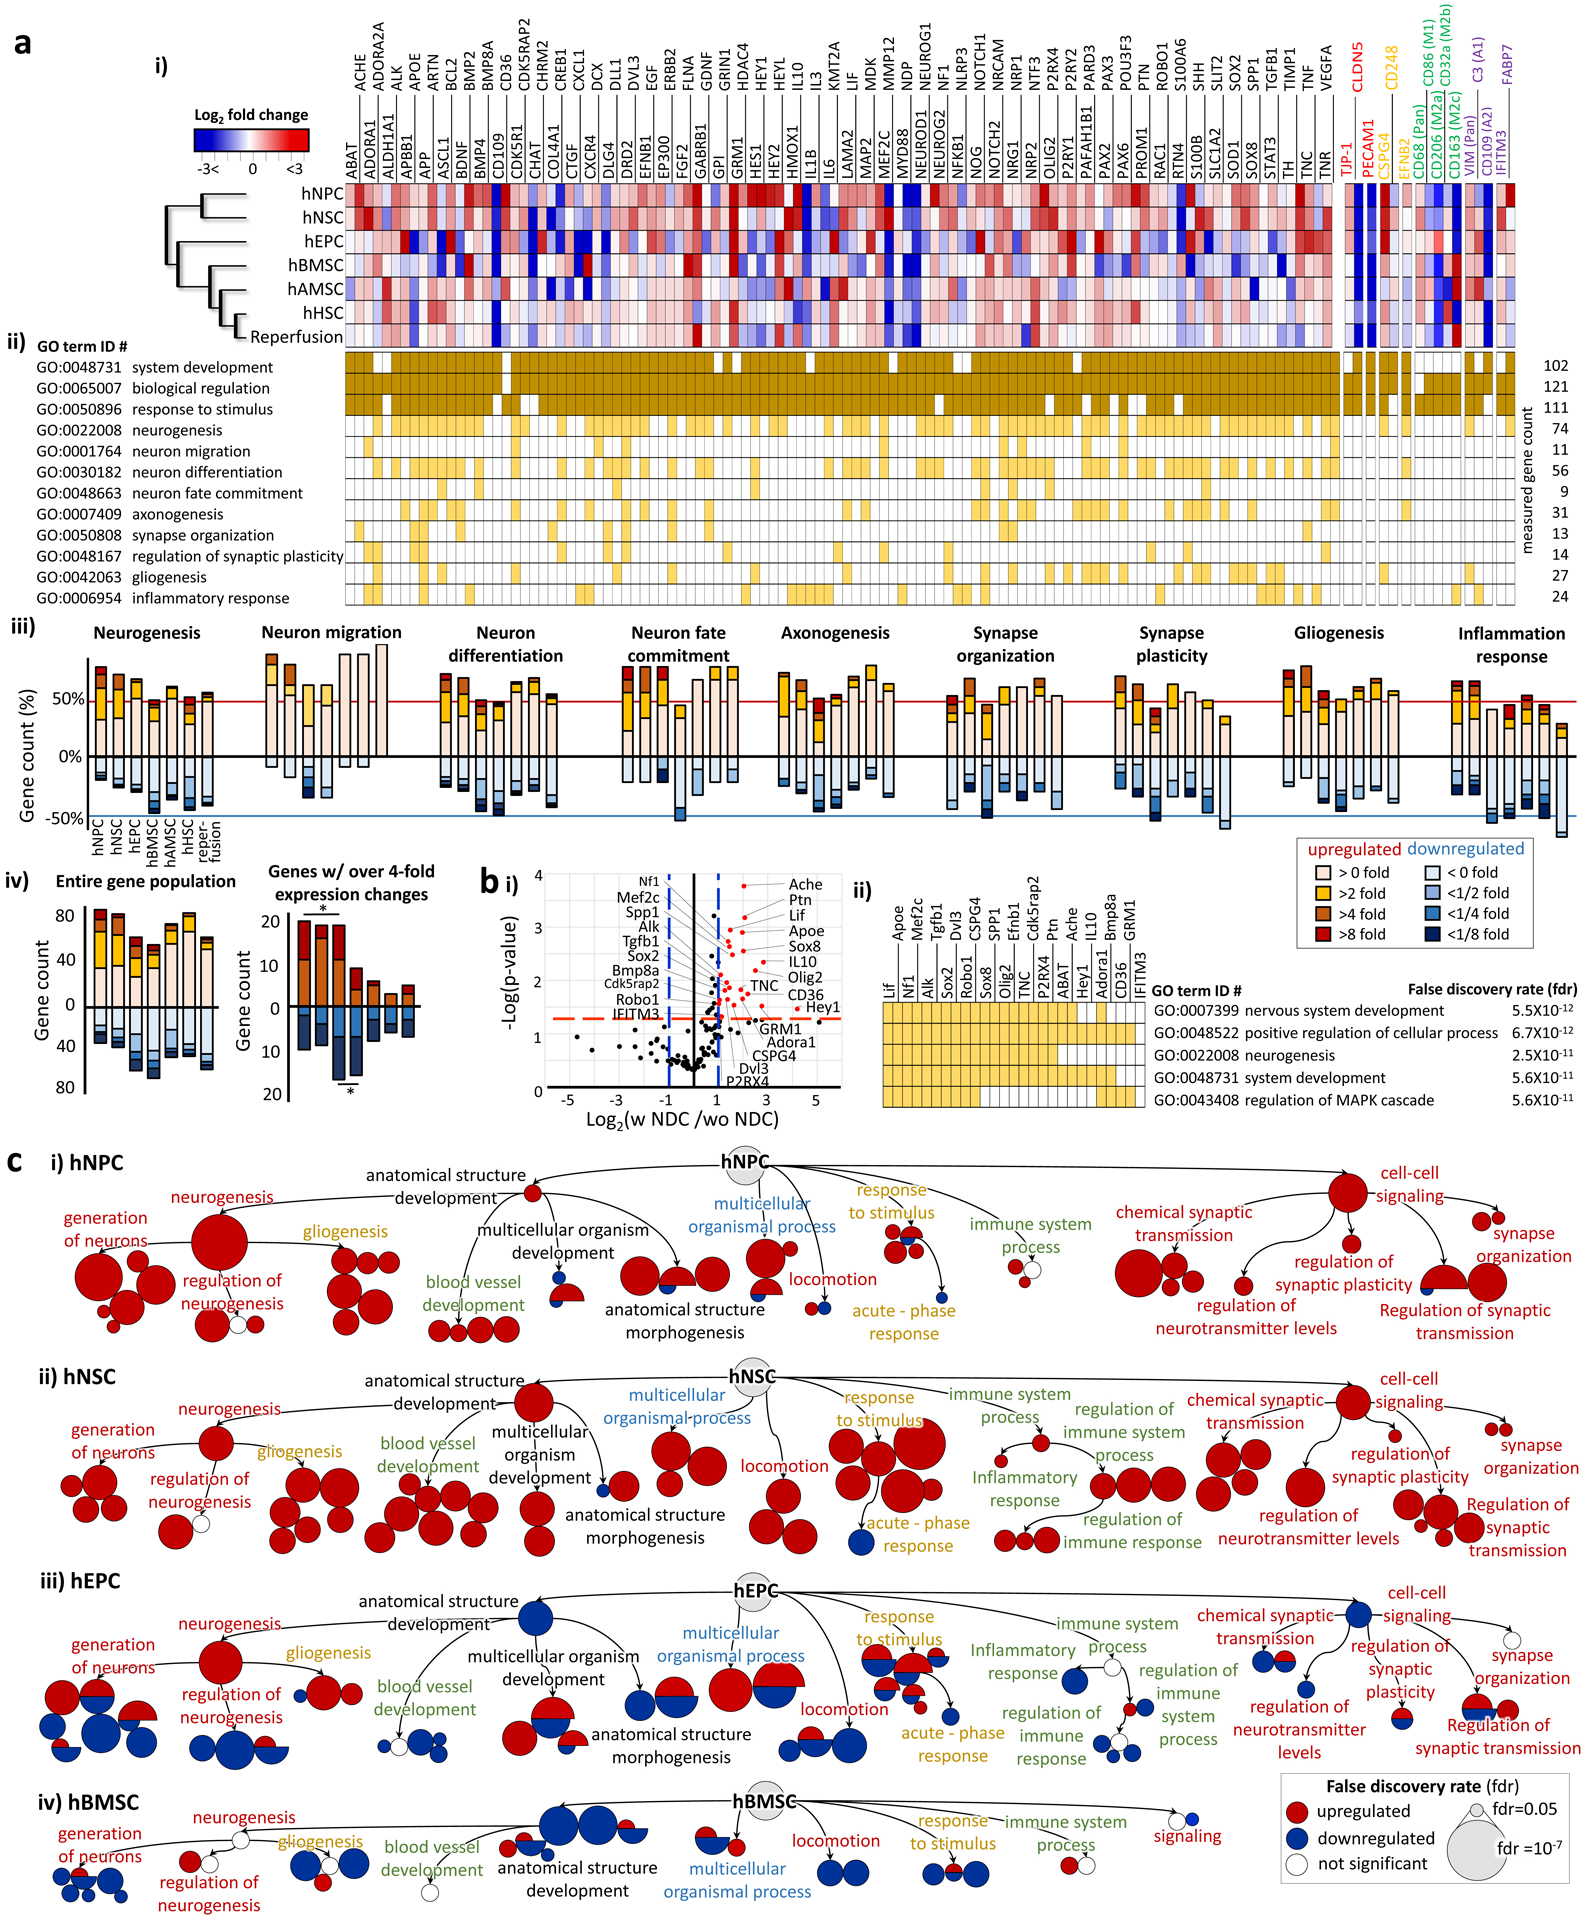
a. (i) A heat map for the gene expression alteration 7 days after incorporating stem cells in ischaemic samples. More detailed functions of each gene are described in Supplementary Table 2 & 3. The gene names written in red, yellow, green and purple are the phenotype markers of endothelial cells, pericytes, microglia and astrocytes, respectively. A magnified heatmap is presented in Supplementary Figure 10. hNPC: human neural progenitor cell, hNSC: human neural stem cell, hEPC: human endothelial progenitor cell, hBMSC: human bone marrow-derived mesenchymal stem cell, hAMC: human adipose-derived mesenchymal stem cell, hHSC: human hematopoietic stem cell. (ii) GO terms associated with each gene is highlighted in dark or light yellow. (iii) The graphs show the percentage of genes associated with each GO term according to their expression fold changes (Increase for red and decrease for blue). (iv) The graphs show the gene count of the entire population of genes according to their expression fold changes. The genes with over 4-fold expression changes are shown in the right. Statistical significance in the up/down regulated gene counts is denoted as ‘*’. b. (i) The graph identifies the genes (red) expressed differentially by the stem cell types with the neuronal differentiation capacity (NDC). The cut-off thresholds are the p-value of 0.05 (red dash line) and more than 2-fold expression changes (blue dash line). (ii) The five most significant GO terms emerged from the GO enrichment analysis of the genes identified in (i). GO terms associated with each gene are highlighted in yellow. C. The GO term enrichment networks, built only with the genes with more than 4-fold expression changes, show the dominant restorative pathways for each stem cell type. The clustered circles around the GO-term labeled circle indicate its significant subtrees in GO hierarchy. The size of a circle is inversely proportional to the false discovery rate (lower right box). The detailed GO terms are shown in Supplementary Figure 11.
The stem cell incorporation as well as reperfusion generally invoked positive influence on the generation of the cells in the nervous system (Neurogenesis; GO term ID #: 002208), although the extent of this influence varied across stem cell types (Fig. 5a iii). In addition, all groups enhanced the expression of genes involved in Neuron migration (GO:0001764), Neuron differentiation (GO:0030182), Neuron fate commitment (GO: 0042055), Axonogenesis (GO:0007409), and Gliogenesis (GO:0042063), although hBMSC also showed inhibiting influence on Neuron differentiation and Neuron fate commitment. Notably, the reperfusion upregulated the expression of all the genes involved in neuronal migration, even though the extent was weak (Fig. 5a iii). As for the synapse responses, similar pattern is revealed in Synapse organization (GO:0007410) and Regulation of synapse plasticity (GO:00450808), with dominantly positive influence from all experimental group, except for the fact that hEPC and reperfusion exhibited equally strong enhancing and inhibiting effects.
In the post-stroke recovery process, it is also important to suppress the inflammation initiated by the ischaemia40. The hNPC and hNSC most strongly upregulated inflammation-related genes (Inflammation response, GO: 0006954). While hAMSC also slightly upregulated, hAMSC, hBMSC, hHSC and perfusion slightly suppressed the genes in Inflammation response group. To examine more specific inflammatory responses, we measured the expression of glial phenotype markers (colored letters in Fig. 5a i; a magnified heatmap is presented in Supplementary Fig. 10) and examined the influence of the translated stem cells on their inflammatory behaviors. As for the effects on BMEC (red letters in Fig. 5a i and Supplementary Fig. 10), hNPC, hNSC and hEPC upregulated the expression of the tight junction protein 1 (TJP1), but the expression of the Claudin 5 (CLDN5) was downregulated in all groups, despite the fact that TJP1 and CLDN5 interact closely to form BBB52. The expression of Platelet And Endothelial Cell Adhesion Molecule 1 (PECAM1), one of the endothelial adhesion molecules responsible for immune cell recruiting after brain injury56, was all effectively downregulated. As for the effects on pericytes (yellow letters in Fig. 5a i and Supplementary Fig. 10), only hAMSC suppressed the expression of a reactive pericyte marker, Chondroitin Sulfate Proteoglycan 4 (CSPG4). The expression of CD248, involved in the role of pericytes in mediating angiogenesis80, was upregulated by hNSC and hAMSC only, and generally suppressed by the rest. Regarding the influence on the microglial activities (green letters in Fig. 5a i and Supplementary Fig. 10), all groups failed to suppress the expression of a microglial reactive marker, CD68, usually upregulated throughout the whole inflammatory phase69–71. In contrast, CD 86, a proinflammatory M1 phenotype marker was suppressed by all groups, except for hAMSC and hHSC. hHSC enhanced the expression of CD206, an anti-inflammatory M2a phenotype marker, while hEPC and hBMSC promoted the expression of CD32a, an anti-inflammatory M2b phenotype marker. hBMSC, hAMSC and reperfusion upregulated the expression of CD163, a microglia-deactivating phenotype marker. As for the effects on astrocytes (purple letters in Fig. 5a i and Supplementary Fig. 10), there was no group suppressing the expression of VIM, a pan reactive astrocyte marker. hNPC was the only one that suppressed the expression of C3, an A1(inflammation) reactive astrocyte marker. In all groups, the expression of CD109, a A2 (ischaemia) reactive astrocyte marker, was downregulated. Taken together, the expression pattern of these astrocyte reactive markers suggests that 7 days after the ischaemic insult there was little influence from the ischaemia itself, and yet the astrocytes still retained their inflammatory behaviors. The expression of Interferon Induced Transmembrane Protein 3 (IFITM3), involved in a neurotrophic support of astrocytes, was upregulated in all groups, while the expression of Fatty Acid Binding Protein 7 (FABP7), another gene with similar function, was upregulated only by hNPC, hEPC, and hBMSC. The complexity in the overall gene expression pattern suggests that all six types of stem cells as well as reperfusion have their own pathways to suppress the neuroinflammation induced by the ischaemia.
When the gene expression pattern was hierarchically clustered (Agglomerative hierarchical clustering based on Euclidian distances, XLSTAT program, Addinsoft), hNPC and hNSC, with more restricted fate commitment to neural cells, stood out as a group separate from the rest (the dendrogram in Fig. 5a i). The differential expression analysis between the two groups (Fig. 5b i, group with neural differential capacity (NDC) vs. group without NDC) identified 27 genes. We performed the GO enrichment analysis on the identified genes based on the STRING database79 and found that the stem cells with NDC were beneficial in Neurogenesis (GO:0022008) and other closely related GO terms (Fig. 5b ii). The stem cells with NDC also had positive effects on regulating the signal cascade of Mitogen-Activated Protein Kinase (MAPK) (GO:0043408), an important regulator of ischaemic and hemorrhagic cerebral vascular disease81.
To better distinguish the neurorestorative characteristics of each type of the stem cells, we performed the GO enrichment analysis focusing on the genes with over four-fold expression changes after stem cell incorporation to identify the dominant therapeutic pathways for each stem cell type (Fig. 5c). The detailed GO terms are shown in Supplementary Figure 11. Each GO term, represented by a circle, is placed according to the functional hierarchy, with sub-trees grouped together under the parent GO term circle. The size of a circle indicates the significance of the stem cell influence on the given GO term. Positive influence/upregulation is denoted in color red while the negative influence/downregulation is denoted in blue. hNPC showed the greatest potential for Neurogenesis (GO:0022008), especially regarding the Generation of neurons (GO:0048699) (Fig. 5c i), though it had stimulating effects on other restorative functions as well. The influence hNSC is more evenly spread out across diverse aspects, such as forming and maturing tissue structures (Anatomical structure development, GO:0048856) and developing multicellular organism (Multicellular organism development, GO:0007275) (Fig. 5c ii). hNSC also showed strong capacity in developing blood vessel (GO:0001568), a fundamental environment for restoring NVU function, as well as promoting the movement of cells (Locomotion, GO:0040011), an important feature for reorganizing the ischaemically damaged structure (Fig. 5c ii). Other relative advantages of hNSC included enhanced adaptation to environmental changes (Response to stimulus, GO:0050896), and better regulation of immune responses (Regulation of immune system process and immune response, GO:0002682 and GO:0050776, respectively) (Fig. 5c ii). Notably, hNSC strongly suppressed the acute inflammatory responses (Acute-phase response, GO:0006953) (Fig. 5c ii). hNSC was also least associated with the Pathways in cancer (hsa05200 in Supplementary Fig. 11) based on the Kyoto Encyclopedia of Genes and Genomes (KEGG) database82. Across the whole range of the GO terms, hEPC exhibited the tendency of simultaneous promotion and inhibition (Fig. 5c iii), while hBMSC consistently inhibited most of them (Fig. 5c iv).
Compared to the top three influential stem cell types (hNPC, hNSC, and hEPC), the rest of the experimental groups (hBMSC, hAMSC, hHSC, and reperfusion therapy) induced relatively smaller changes in gene expression. We thus performed the GO enrichment analysis on the genes with over two-fold expression changes for these groups (Supplementary Fig. 12). Unlike the distinct characteristics emerged from the previous analysis for the three most influential stem cell types (Fig. 5c and Supplementary Fig. S11), these groups exhibited relatively inconsistent influences over the GO terms grouped together for related functions (Supplementary Fig. 12). A few consistent trends spotted were Neurogenesis promotion by hHSC and Vasculature development (GO:0001944) inhibition by hAMSC and reperfusion.
We further examined the synaptic activities as an important and reliable parameter to estimate the extent of the post-stroke recovery83 (Supplementary Fig. 13). Based on the GO enrichment analysis on the genes with at least 4-fold or 2-fold expression changes, we compared the significance of the GO terms related with the synapse and neurotransmitter, and examined how much each stem cell type promoted the synaptic activities. This analysis also revealed a streak of strong positive effects of hNSC on many aspects of the neurorestoration at synapse level: Synapse Organization (GO:0050808) and Synaptic Transmission (GO:0007268), as well as the regulation of the transmission pathways of the relevant neurotransmitters such as Glutamate (GO:0035249), Acetylcholine (GO:0007271), and GABA (GO:003228). Given the molecular and functional complexity of the synapses and the importance of their coordination in neurological functions 84, hNSC stand out as the highly promising therapeutic agent among all stem cells evaluated in our system.
Tracking the therapeutic stem cells.
Although the exact mechanism underlying the neurorestorative effects of the therapeutic stem cells for stroke is still unknown40, there are accumulating evidences that the therapeutic effects of stem cell therapies are mediated by indirect mechanisms, such as releasing trophic factors and immune regulatory cytokines, promoting endogenous stem cell migration, and enhancing endogenous neural plasticity and function recovery3. However, albeit rarely, there also have been reports that the transplanted stem cells directly replace the host cells, reconstituting the damaged neural circuitry40,85. The primary factor attracting the stem cells toward the infarcted brain parenchyma seems to be the inflammatory responses of NVU86, such as the upregulation of cytokines, Cell adhesion molecule (CAM), and MMP, which is observed in our NVU model as well.
With our stroke model, we were able to track the therapeutic stem cells and assess the extent of the direct cell replacement. We examined each of the major indicators of the cell replacement: the extent of adhesion to the BBB, the number of surviving cells, the extent of infiltration into the ‘brain’ channel and differentiation into various neural cell types in NVU. We first prepared green fluorescent protein (GFP)-expressing stem cells using lentiviral factors. The transfection efficiency for this process is presented in Supplementary Figure 14. The number of stem cells initially adhering on the BBB was less than 5 % of the total cell number in the chip in most cases (Fig. 6a i & 6b i and Supplementary Fig. 15). After seven days of stem cell injection, the cell viability counts for those attached to the BBB were in general either decreased (hNPC, hNSC, and hHSC) or only slightly increased (hBMSC and hAMSC) (Fig. 6a i & 6b ii and Supplementary Fig. 15). hEPC, in contrast, vigorously proliferated and infiltrated into the ‘brain’ channel (Fig. 6a i and 6b ii & iii). At the same time point, seven days after transplantation, all of these therapeutic stem cells barely expressed their stem cell markers (Fig. 6a ii) that they originally expressed in 2D cultures (Supplementary Fig. 16). This does not mean they completed differentiation by that time because only very limited number of the cells were mature enough to express the markers of their predicted lineages (Fig. 6a iii & 6b iv). Only hNPC and hNSC showed detectable neural differentiation and even those were less than 0.01% of the total cell number in the chip. The extremely limited stem cell differentiation suggests that the direct cell replacement is not a major mechanism underlying the neurorestorative effects of stem cell therapy, adding to the recent growing evidences against it3.
Figure 6 |. Tracking of the therapeutic stem cells.
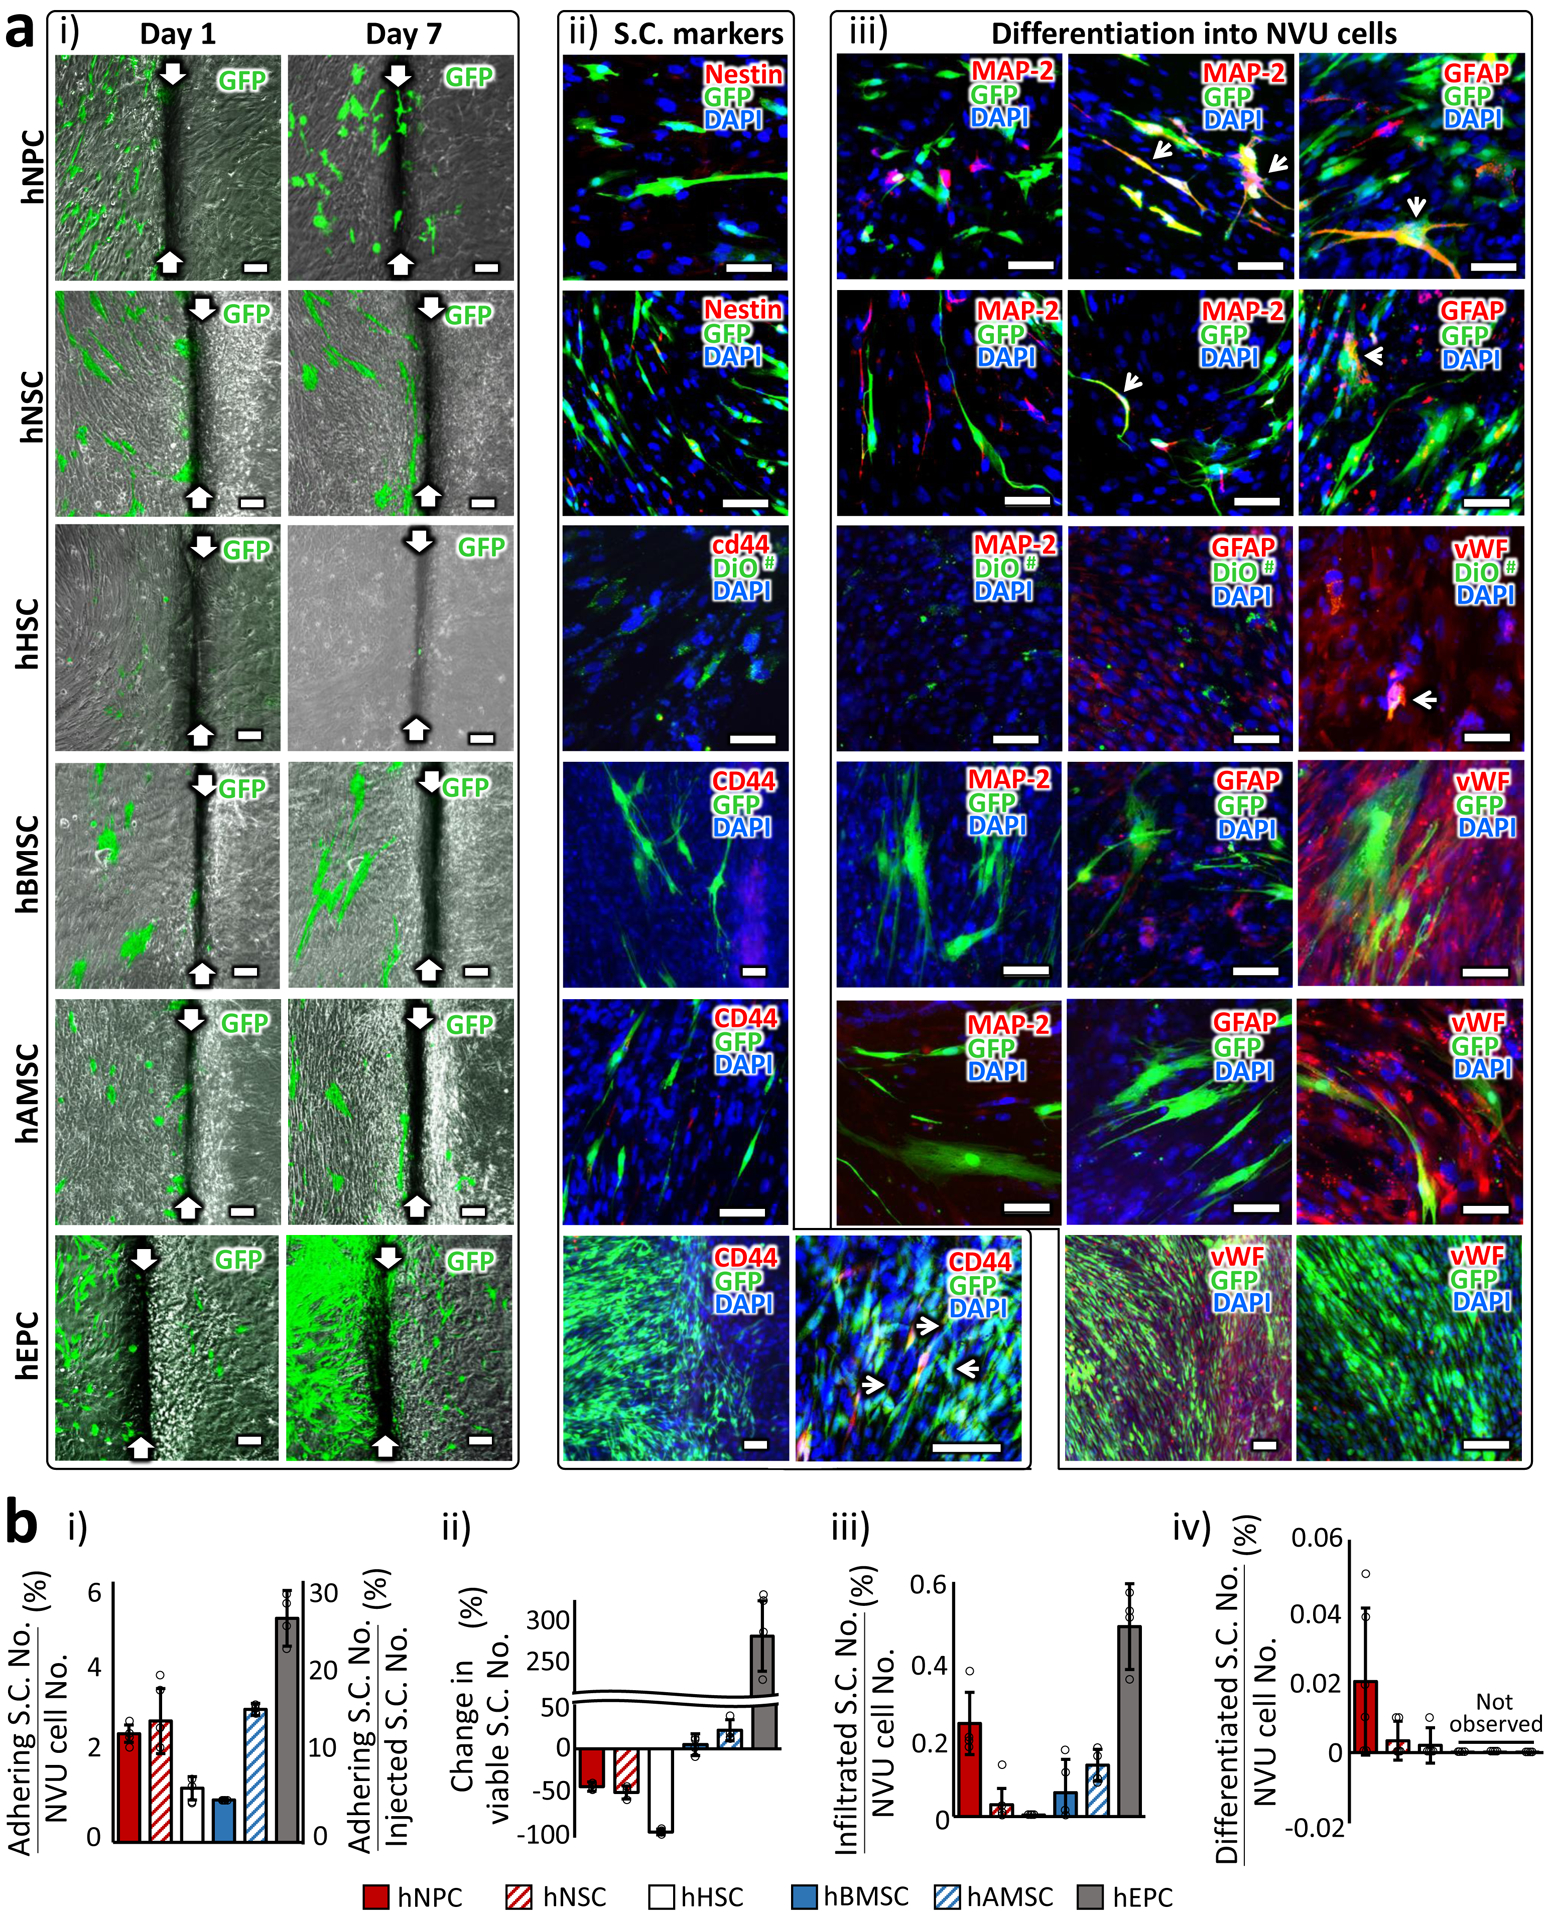
a. (i) Images of GFP-expressing stem cells in 1 day and 7 days after transplantation. White arrows indicate the boundary between the ‘blood-side’ (left) and ‘CSF-side’ (right) channels. (ii) Expression of stem cell (S.C.) markers 7 days after transplantation. Cells co-expressing GFP and S.C. marker are indicated with white arrows. The cells expressing S.C. markers were selectively chosen for imaging since they were very scarce. (iii) Expression of lineage markers (MAP-2: Neuron, GFAP: Astrocyte and vWF: endothelial cell) that each S.C. type could differentiate into. Cells co-expressing GFP and lineage marker are indicated with white arrows. The cells expressing differentiation markers were selectively chosen for imaging. # Due to the limited number of GFP-expressing hHSC, we incorporated pre-stained cells with a cell membrane-labeling dye, DiO. Scale bars: 100 μm. b. (i) The percentage of the stem cell number adhering on the chip with respect to the total cell number (5×10⁴ cells; vertical axis on the left) and with respect to the number of injected stem cells (1×10⁴ cells; vertical axis on the right) in the chip. Measured one day after injection. (ii) The changes in the viable S.C. numbers compared between 1 day and 7 days after transplantation. (iii) The percentage of the stem cell numbers infiltrated across the BBB with respect to the total cell number in the chip. Measured 7 days after injection. (iv) The percentage of the stem cell numbers differentiated into the NVU constituent cell types with respect to the total cell number in the chip. Measured 7 days after injection. The NVU cell number in the chip was assumed to stay throughout the incubation period. More than 3 images were obtained from 3 chips for each experimental condition. The error bars on the bar graphs show s.d. from the mean. Dots along the bar graphs represent individual data points.
DISCUSSION
In this work, we presented a microphysiological stroke model to systematically evaluate the efficacy of stem cell therapy. Our data revealed three key aspects of NVU microenvironments required for in vivo-like behaviors of the constituent cells: the formation of intact BBB, the heterocellular network, and the proper mechanical stimuli by blood flow (Fig. 1). The brain-like microenvironment ensures the cells in our model to retain their native behaviors and to show clinically relevant responses to an ischaemic insult (Fig. 2, 3 & 4). Our model served as an efficient screening testbed to examine the neurorestorative potential of the stem cells used in pre-clinical trials. We systematically analyzed how each type of stem cells influenced the gene activities during the complicated disease progression and recovery processes (Fig. 5). We also utilized our stroke model to track the stem cell behaviors therapeutic in the ischaemically damaged NVU (Fig. 6).
Our microfluidic chip design well suited the need of establishing a functional BBB and at the same time enabled the real-time monitoring of the therapeutic stem cells moving across the BBB. Similar chip designs have been proposed to build a functional BBB: positioning cells side-by-side by using micro-poles (AIM Biotech)87 or a flow-guiding structure (PhaseGuide ™ technology, Mimetas)11. The design of such a chip is useful for observing the behavior of drugs or cells passing through the BBB in a 3D environment. Another mainstream in BBB chip design is to vertically stack hierarchical tissue structures between porous membranes13,24,27,88. The chips with this design are also commercially available (Emulate, Inc.), and have been utilized to reconstruct functional BBB88–90. A 3D NVU structure to examine the metabolic consequences of BBB inflammation was reconstructed based on this design 88. The advantage of this chip design is that the BBB is formed on a 2D membrane so that the dynamics of the endothelium can be monitored in the same focal plane of optical microscopes. This design poses challenges to visualize the heterocellular interactions across vertical layers, necessitating confocal imaging. Moreover, the cellular interactions are inevitably interfered by the porous membranes. What differentiates our design is the absence of physical structures between two neighboring channels, which allows for the cellular interactions free from any potential interference due to physical structures. We acknowledge, however, a couple of limitations of our chip design. First, the new design involves different heights and thus reduces the possible contact surface for the cells in the neighboring channels to interact with. Second, the use of a generic hydrogel whose components are not fully defined made it difficult to characterize the dynamics in the extra cellular matrix, especially the basement membrane in BBB that actively participates in BBB regulation91. Third, our current model uses PDMS (poly-dimethyl siloxane) and thus retains the PDMS-inherent pitfalls, such as cytotoxicity, non-specific adsorption of bioactive molecules, and gas passage92,93. As an alternative, microfluidic chips prepared with plastic injection molding has been proposed to overcome these limitations of PDMS, as well as for large-scale production purposes94. Our chip design without microstructures should be compatible with the injection molding and the combined methodology would be ideal for industrial-scale mass production.
Our stroke model delineated the neurorestorative behaviors of each candidate stem cell type for stroke treatment (Fig. 5). The benefits of hNPC and hNSC, the stem cells with the capacity to differentiate into neural cells, consistently stood out in many aspects related with the post-stroke recovery processes. Our iPSC-derived hNPC (Millipore, Cat. No.: SCC035) were tested by the manufacturer to ensure more than 80% of their progeny to differentiate into neuronal cells. The hNSC used in this work were initially isolated from fetal cortical brain tissue at 13.5 weeks gestation (M031 clone) and classified as neural stem cells due to their ability to self-renew and produce progeny cells differentiating into neural cells95. Based on our GO analysis, hNPC showed the strongest capacity in generating neurons (GO:0048699) and hNSC exhibited compelling positive effects on the overall structural and functional integrity in NVU. Notably, the recovery of NVU functionality, such as gliogenesis (GO:0050767), blood vessel development (GO:001944) and immune system process (GO:0002376), was also linked with the enhanced synaptic activities, both mediated by hNSC. Given the importance of the synaptic activities in rewiring neuronal network and neurological functions, this result suggests that restoring the overall NVU functionality may be more critical for stroke treatment than replenishing neurons themselves. It is important to take into account the limitations of our approach as well when interpreting these results. First, our efficacy evaluation focused only on the gene level, as represented by GO functional analysis, and did not cover the entire range of interactions across different levels associated with post-stroke recovery. The transcriptomics was also performed on the whole cell population, which has limitations in showing cell- or tissue-specific changes. And there is always the risk of overinterpretation of the GO analysis results. Second, the contribution from the peripheral immune cells crossing the BBB was not addressed in our model and they could also play important roles in the post-ischaemic inflammation96. And since we incorporated neurons differentiated from neural progenitor cells rather than mature neurons, our chip could contain subsets of neurons with heterogeneous maturity. Third, since the flow in our chip was bidirectional, generated by a rocking shaker, the endothelial cells would activate different signal pathways of mechanotransduction compared to the unidirectional blood flow in vivo97–99.
The results from tracking the stem cells (Fig. 6) suggest that the therapeutic effects of the stem cells arise mainly through the indirect mechanism of supporting the endogenous recovery, rather than direct cell replacement. At the time of gene expression alteration analysis, the number of stem cells left in our samples was mostly less than 1% of the whole cell population. The presence of such a small population itself could not possibly be the major driving force to induce the observed magnitude-fold changes in the gene expression for the whole cell population. This implies that the presence of the remaining stem cells themselves have had a minor influence on efficacy evaluation. Similar observations were reported in both animal models and clinics that the transplanted stem cells barely reached the ischaemic region, but still induced significant therapeutic effects100. Based on these observations and implications, the pre-clinical evaluation of the candidate stem cells for cell therapy would be more effective and relevant if focusing on their capacity of restoring the damaged NVU both structurally and functionally, rather than tracing the fate of the transplanted stem cells themselves in vivo.
Many of the previous studies have presented conflicting results, not only on the neurorestorative potential of each stem cell type in varying conditions, but also on the mechanism by which stem cells exert their therapeutic effects78. The possible reason for these controversies could be the fact that the efficacy evaluation was focused only on a few aspects, lacking comprehensive analysis on the overall recovery process. Another reason could be the comorbidities often accompanying stroke, such as hypertension, high cholesterol, and diabetes, that complicate the disease progression and treatment. As such, stem cell therapy would be most effective with personalized approach based on the comprehensive health condition of individual patients. We expect that in vitro stroke models, like the one presented in this study, would serve as an ideal testbed to develop personalized stem cell therapies, by utilizing patient-derived cells and simulating the unique pathophysiological condition of individual patients. The personalized stroke model could in turn serve as an efficient testbed to screen many different candidate stem cells and identify the optimal stem cell regimen for the given patient. Multiomics approach, presented in some of the recent studies101, could further expand our understanding of the post-stroke neurorestoration process and our in vitro stroke model is readily applicable for that purpose as well.
Taken together, our approach recapitulated the NVU behaviors in the normal and ischaemic conditions in vitro and enabled efficient and systematic evaluation of the stem cell therapy, overcoming the limitations of both the animal models and the currently available in vitro models. The findings from this study, especially the characterization of the neurorestorative potential of various stem cells, can steer the direction of the stem cell therapeutics in research as well as in clinics. Our approach presented in this work is also immediately applicable to a wide range of other diseases associated with the vasculature, opening up new possibilities in the field of precision medicine.
METHODS
Cell culture
NVU constituent cells.
Human primary astrocytes (ScienCell, Cat. No.: 1800) were cultured on T75 pre-coated flask with 2% poly-L-lysine solution (Sigma) in an astrocyte medium (AM) (ScienCell, Cat. No.: 1801). Transformed human microglial cell line (HMC3, ATCC, Cat. No.: CRL-3304) was maintained in Eagle’s Minimum Essential Medium (EMEM, ATCC) containing 10% fetal bovine serum (FBS) and 1% penicillin/streptomycin. Human induced pluripotent stem cell (hiPSC)-derived neural progenitor cells (hNPCs) (Millipore, Cat. No.: SCC035) were maintained on T75 pre-coated flask with 1% Matrigel (BD Matrigel Matrix High Concentration) in NEM. Human primary brain microvascular endothelial cells (BMEC) (ScienCell, Cat. No.: 1000) were cultured on T75 pre-coated flask with 2% collagen solution (Sigma) in an endothelial cell medium (ECM) (ScienCell, Cat. No.: 1001). Human brain vascular pericytes (ScienCell, Cat. No.: 1200) were grown on T75 pre-coated flask with 2% poly-L-lysine solution (Sigma) in a pericyte medium (PM) (ScienCell, Cat. No.: 1201). T75 Flasks coated with Matrigel and those coated with poly-L-lysine solution were prepared through incubation at 37 °C for 1 h and overnight, respectively. T75 flasks coated with collagen were prepared through incubation at 4 °C overnight.
Stem cells.
Human endothelial progenitor cells (hEPC) were purchased from Celprogen (San Pedro, Cat. No.: 37089-01) and were expanded on T75 flasks pre-coated with the extracellular matrix for hEPC expansion (Celprogen, Cat. No.: E36053-05-T75) in complete hEPC growth medium (Celprogen, Cat. No.: M36053-05ES). Human bone marrow-derived mesenchymal stem cells (hBMSC, Gibco, Cat. No.: A15652) and human adipose-derived mesenchymal stem cells (hAMSC, Gibco, Cat. No.: PCS-500-011) were maintained in a mesenchymal stem cell medium (MSCM) (ScienCell, Cat. No.: 7501). Human neural stem cells (hNSC, NR1), initially isolated from fetal cortical brain tissue at 13.5 weeks gestation (M031 clone) and derived from the embryonic stem cell line H9, were cultured in the same condition as the hiPSC-derived NSC. Human hematopoietic stem cells (hHSC) were purchased from ATCC (Cat. No.: PCS-800-012) and used directly for experiments without subculturing. Medium was changed every 2–3 days. Cells were passaged when the confluency reached approximately 80%. 0.25% trypsin-EDTA (disodium ethylenediaminetetraacetic acid) was used to passage transformed microglia, hBMSC, and hAMSC. 0.05% trypsin-EDTA was used to split astrocytes, BMEC, pericyte, hEPC, and hNSC. hNPC was passaged using StemPro™ Accutase™ Cell Dissociation Reagent (Gibco, Cat. No.: A1110501).
Microfluidic chip design and fabrication
The master mold of microfluidic chips was fabricated using a stereolithography 3D printer (Supplementary Figure 2, Titan HD, Kudo3D Inc.). Our master mold could be prepared by most stereolithography 3D printers and resins commercially available, just as many other types of microfluidic chips were constructed using 3D printers102. The printed molds were extensively washed with 99% isopropyl alcohol to remove unreacted monomers and curing agents, and incubated on a hotplate at 50°C in a UV light chamber (wavelength: 365nm and 405nm, output: 48 W) overnight. This washing process was repeated for at least 3 days before used for chip production. The surface of the molds then was spray-coated with silicone mold release (CRC, cat. No.: 03300) and PDMS (Sylgard 182, Dow Corning) was poured on it. After heat curing at 65 °C for approximately 5 h, the solidified PDMS replica was peeled off from the mold. Holes (1.5 mm in diameter) were made at both ends of each channel in the PDMS replica using a biopsy punch. The PDMS replica was then bonded to precleaned microscope glass slides (Fisher Scientific) through plasma treatment (Harrick Plasma, Cat. No.: PDC-32G). Microfluidic chips were UV-treated overnight for sterilization before cell seeding.
Reconstruction of a functional NVU in the chip
(The simplified workflow for the sample preparation is described in Figure 1a ii.)
Reconstruction of neural tissue.
To construct neural tissue on our microfluidic chips, human iPSC-derived NPCs, astrocytes, and microglia were embedded in a basement membrane extract (BME) hydrogel (Cultrex™ reduced growth factor basement membrane matrix type R1, Trevigen, Cat. No.: 3433-001-R1) and then injected into the ‘brain’ channel of the chips. hNPCs were suspended in a neural expansion medium (NEM, Millipore, Cat. No.: SCM004) supplemented with 2 mM glutamine and 0.02 μg/mL fibroblast growth factors (FGF)-2. To obtain astrocytes and microglia in their resting state, they were sustained in AM without serum and astrocyte-conditioned medium (ACM, ScienCell, Cat. No.: 1811), respectively, for one day before the injection. The density of the suspension for each cell type was ~ 8 × 10⁶ cells/mL. We prepared cell mixture by mixing hNPCs, astrocytes and microglia at the ratio of 8:4:1 (n/n/n) and then with BME Type R1 hydrogel prepolymer (gel: cell = 4: 1 (v/v)). According to the vendor, more than 80% of the hiPSC-derived NPC commit to mature neurons, making the final cell ratio for neurons, astrocytes and microglia fall in the range of 5–6: 4–5: 1 (n:n:n), similar to the naïve brain 103. The gel-cell mixture was injected into the ‘brain’ channel of a chip placed on a cold pack. The total number of the incorporated neural cells in the ‘brain’ channel was around 4 × 10⁴. After injection, chips were transferred to rectangular 4-well cell culture plates (Thermo Scientific, Cat. No.: 267061) and incubated at 37 °C in a cell culture incubator for 30 minutes for gelation. After gelation, the serum-free mixed medium of NEM, serum-free AM and ACM (8:4:1, v/v/v), referred to as NEM/AM in Figure 1a ii, was injected into both the ‘blood-side’ and the ‘CSF-side’ channels and then changed every day. From day 3 after the injection, NEM was replaced with a neural differentiation medium (NDM) (Millipore, Cat. No.: SCM111), referred to as NDM/AM in Figure 1a ii. The culture medium was changed every other day for the next 2 days until BBB reconstruction.
BBB reconstruction.
BMEC and human pericytes were suspended in ECM and PM respectively at the density of ~ 1 × 10⁶ cells/ml. BMEC and pericytes were mixed at 9:1 (n/n) ratio based on literature 61,104 and 10 μL of the cell suspension was injected into the ‘blood-side’ channel of a chip after the neural cells were co-cultured for 4 days in the ‘brain’ channel. The total cell number in the ‘blood-side’ channel was around 1 × 10⁴. We tilted the chip a little bit for BMEC and pericytes to adhere to the side wall of the hydrogel in the ‘brain’ channel and incubated it for 3 hours. Then we removed old medium and injected fresh mixed medium (ECM: PM = 9:1 (v/v), final serum content of 4.7% (v/v), referred to as ECM/PM in Figure 1a ii) into the ‘blood-side’ channel to remove any unattached cells and debris. We changed the mixed medium of ECM and PM in the ‘blood-side’ channel and the mixed medium of NDM, AM and ACM in the ‘CSF-side’ channel every other day. Chips were cultured for 3 more days for BBB formation.
Shear stress on the BBB.
To apply the shear stress of flow in the physiological range as in the brain microvasculature (0.01 – 10 dyne/cm2) 105, we generated a pulsatile bidirectional flow by placing the samples on a rocking see-saw shaker (Mimetas, OrganoFlow® L,). We adopted the flow condition of a previous work 11 in which a functional BBB was established. We modulated the design parameters of our model based on the equation below:
, where τ = shear stress (dyne/cm2), Q = flow rate (cc/s), μ = viscosity of culture medium, b = channel width, and h = channel height. Based on the Poiseuille’s law,
, where ΔP = ρ · L · sin θ (pressure difference between the inlet and outlet), θ = tilt angle of a shaker, L = channel length, ρ = liquid density. The mean shear stress during a given time period is proportional to the following parameters:
In the previous works 11,106 with the experimental setup with h = 220 μm, b = 400 μm, θ = 7°(OrganoPlate, Mimetas), and the tilting frequency of 16 minutes, the maximum shear stress was estimated as 1.7 dyne/cm2 based on a numerical model implemented with Python software. Our setup (h = 400 μm, b = 1 mm, θ = 4°, and the tilting frequency of 1 minute) was expected to generate 3.4 dyne/cm2 of the maximum shear stress at a higher frequency.
Induction of in vitro ischaemic condition
To induce ischaemia, the chips were placed in the incubation chamber of an EVOS fl auto imaging system with 2% O2 and 5% CO2 for 24 hours 36. Before the chips were incubated in the hypoxic chamber, the culture media was replaced with serum- and glucose-free DMEM (Gibco, Cat. No.: 11966025) that had been flushed with nitrogen gas for one minute before use. There was no flow during the ischaemic period. The samples in a normoxic condition were cultured an incubator with 5% CO2 and atmospheric O2 concentration (~20%).
Functional characterization of the reconstructed BBB
Evaluation of BBB as a physically intact barrier.
To evaluate the physical intactness of the formed BBB in a microfluidic chip, we injected a FITC-conjugated dextran (70 kDa and 4 kDa) to the ‘blood-side’ channel and monitored their diffusion across it. We took fluorescence images (at 488 nm) at different time points in one hour after the probe injection and the fluorescence intensities were measured with ImageJ (NIH). The permeability coefficients were calculated by the equation107–111 below.
A = the surface area of the membrane, C0 = initial concentration on the donor side, = the transport rate.
Vbrain= hydrogel volume in the ‘brain’ channel, = mean fluorescence intensity in the ‘brain’ channel,
= mean fluorescence intensity in the ‘blood-side’ channel, Io= initial fluorescence intensity
This equation assumes that flux across the imaging boundary is negligible, and transendothelial flux is constant108. In our chip these assumptions were safely met for the time intervals (Δt) shorter than 15 minutes; i.e. there were no significant difference between Papp calculated with 5, 10 and 15 minutes of Δt (n = 5, p-value > 0.05). Δt was set to 10 minutes. We calculated the Papp of the BBB () based on the Papp of the whole barrier ()and the endothelium itself () using the following equation.
Evaluation of BBB as a bio-chemically intact barrier.
We examined whether the formed endothelium could isolate the neural cells in the ‘brain’ channel from the serum in the ‘blood-side’ channel. First, we added the serum-containing medium of ECM and PM (9:1, v/v) containing 10% FBS into the ‘blood-side’ channel. After incubation for 24 h, we studied microglia behavior by immunostaining them with its reactive marker, ionized calcium-binding adapter molecule 1 (IBA-1), and its activation marker, differentiation 68 (CD68).
Evaluation of BBB as a cell-selective barrier to invading cells.
We examined whether the reconstructed BBB could show distinct responses to different types of invading cells; two types of human breast cancer cell lines were tested for this purpose: MB-231 and its brain metastatic derivative population, MB-231Br. The MB-231Br was provided by Dr. Joan Massagué at Memorial Sloan Kettering Cancer Center. The cells were prestained with Vybrant™ DiO (3,3′-Dioctadecyloxacarbocyanine perchlorate) cell-labeling solution (Invitrogen, Cat. No.: V22886). For prestaining, cells were incubated with staining medium (5 μL labelling solution per 1 mL culture medium) for 20 min in a cell culture incubator and washed with sterile PBS (Phosphate-buffered saline, pH = 7.4) for 3 times. And 10 μL of the cells were injected into the ‘blood-side’ channel at 1 × 10⁶ cells/mL density. We tilted the chip a little bit so that the cells could pile up on the hydrogel border. Images were taken 3 days after the cancer cell injection using an EVOS fl auto imaging system (Life Technologies).
Other methods for cell analyses
Cell viability and cytotoxicity.
Cell viabilities and cytotoxicity were measured using Live/Dead™ Viability kit (ThermoFisher Scientific, Cat. No.: L3224) and LDH-Cytox Assay™ kit (BioLegend, Cat. No.: 426401), respectively. Cell viability was calculated as the number of viable cells divided by the total number of cells. The relative cytotoxicity of the ischaemia was calculated based on the optical densities (OD) read at a wavelength of 490 nm as follows:
Neuronal degeneration staining.
Neuronal degeneration induced by ischaemia was studied using Fluoro-Jade C (FJC) Staining Kit according to the manufacture’s protocol (Biosensis, biosensis® Ready-to-Dilute (RTD) TM Fluoro-Jade® C Staining Kit, Cat. No.: TR-100-FJ) with some modifications. To make sure staining solutions diffuse well into the hydrogel in the middle channel of the chips where neurons were growing, incubation time of staining solutions on the protocol were tripled in our experiments. After staining, samples were washed at least three times with PBS. For each wash, the incubation time was 5 – 10 min. Images were obtained with EVOS fl microscope (Life Technologies).
Immunocytochemistry.
For fixation of cells in a NVU chip, 50 – 60 μL of 4% paraformaldehyde (PFA) was added as droplets onto the inlet of each channel and kept in the channels for at least 30 min. The fixed hydrogel matrix was gently washed by adding 30 – 40 μL of PBS drops onto the inlet of each channel. This washing was repeated at least 5 times. Then, the cells in the NVU chip were permeabilized in 0.1% Triton X-100 in PBS for 10 – 15 min. The permeabilized cells were washed with PBS for 5 times and then blocked with 5% normal donkey serum in PBST (0.05 % Tween 20 in PBS) for 40 min to 1 hr. The blocked cells were incubated with primary antibodies (30 – 40 μL per channel) at least overnight at 4°C. The dilution ratio of primary antibodies was as follows: sheep polyclonal anti-human CD31/PECAM-1 (R&D Systems, Cat. No.: AF806, 1:20), rabbit polyclonal anti-human GFAP (Sigma, Cat. No.: G9269, 1:100), chicken polyclonal anti-human GFAP (Synaptic Systems, Cat. No.: 173006, 1:500), rabbit polyclonal anti-human AQP4 (Novus Biologicals, Cat. No.: NBP1-87679, 1:2000), mouse monoclonal anti-human ZO-1 (Invitrogen, Cat. No.: 339100, 1:100), rabbit polyclonal anti-human von Willebrand Factor (vWF, Sigma, Cat. No.: F3520, 1:200), mouse monoclonal anti-human vWF (Sigma, Cat. No.: AMAB90931, 1:500), mouse monoclonal anti-human podoplanin (PDPN) (E-1) (Santa Cruz Biotechnology, Cat. No.: SC376695, 1:100), rabbit polyclonal anti-human Synapsin 1/2 (Synaptic System, Cat. No.: 106003, 1:1,000), chicken polyclonal anti-human MAP2 (Abcam, Cat. No.: ab5392, 1:10,000), goat polyclonal anti-human IBA-1 (Abcam, Cat. No.: ab5076, 1:200), rabbit polyclonal anti-human IL-1β (Abcam, Cat. No.: ab9722, 1:100), mouse monoclonal anti-human CD68 (Bio-Rad, Cat. No.: MAC5709, 1:100), rabbit monoclonal anti-human CD44 (Invitrogen, Cat. No.: 19H8L4, 1: 500), mouse monoclonal anti-human CD34 (Life technology, Cat. No.: BI-3C5, 1:250), mouse monoclonal anti-human Nestin (ThermoFisher, Cat. No.: MA1-5840, 1: 250), rabbit monoclonal anti-human PDGFR β (Cell Signaling, Cat. No.: 3169, 1:100), and mouse monoclonal anti-human HIF-1 α (Abcam, Cat. No.: ab6066, 1:200). To prevent dryness during the primary antibody incubation, the plates containing the chips were humidified with distilled water. Incubated samples were washed with blocking solution for 5 times, and then various secondary antibodies (Jackson ImmunoResearch Laboratories) including DyLight405 anti-rabbit, Alexa Fluor 488 anti-chicken, mouse, or rabbit, Alexa Fluor 594 anti-mouse, rabbit, or sheep, and Alexa Fluor 647 anti-mouse, rabbit, or sheep were added to samples at a dilution of 1:500 at room temperature for at least 2 h. The immunostained slides were mounted with ProLong Diamond antifade reagent (ThermoFisher) and cured for 24 h. To prevent collapsing of the fixed hydrogel structure, all buffers including PFA, PBS, and blocking solutions were not fully removed from the outlet reservoir throughout the whole procedure of ICC.
3D images of BBB.
Fluorescent images of immunostained-BBB structures were acquired at 10´ and 20´ magnifications with a Zeiss LSM 880 confocal microscope. The NVU chip was scanned at different focal planes ranging from Z = 0 to 100 μm with 8 – 10 μm intervals. For 3D reconstruction of images, the 3D Viewer in Plugins of ImageJ was used.
Calcium imaging and analysis.
To record the cytosolic calcium oscillation in the neurons differentiated from iPSC-derived NPC, we pre-stained the iPSC-derived NPC with DiL (1,1’-Dioctadecyl-3,3,3’,3’-Tetramethylindocarbocyanine Perchlorate, Molecular probes, Cat. No.: D282) before incorporating with other cells in our chip, as described in the process of Reconstruction of brain tissue and BBB. One hour prior to calcium imaging, we added 5 μM Fluo-4 AM (Thermo Fisher Scientific, Cat. No.: F14201) to the inlets of the chips. We observed spontaneous calcium oscillations in DiL labeled cells using a confocal microscope (Carl Zeiss, LSM 710, Göttingen, Germany) under 37 °C and 5 % CO2. Calcium signaling was recorded in time-lapse video recording mode at a speed of 2 sec/frame for 10 minutes. The recorded images were analyzed using ImageJ software with Time Series Analyzer V3 plugin. Calcium dynamics in each DiL labeled cell was traced with ROI (Region of Interest) analysis, and the parameters of calcium oscillation in each cell, such as frequency and amplitude (ΔF/F0) were calculated using a custom-made script written in IDL (Interactive digital language). Extracellular background signal was subtracted from the traced calcium signals, which in turn were normalized to the intracellular basal line (F0).
Real-time quantitative PCR.
We evaluated the gene expression pattern of the entire cell population in our chip. More than six chips from each experimental condition were used to extract RNA for analysis. Cells from different batches were used to ensure cell numbers sufficient to prepare multiple chips simultaneously. The culture medium in both of the side channels was removed and replaced with fresh PBS. The process was repeated twice with 5 min incubation in between. After removal of PBS, 50 uL of RLT buffer plus lysis buffer (Qiagen, Cat. No.: 1053393) was injected into both of the side channels and incubated for 5 min. Thorough pipetting was needed in order to harvest all types of cells in the chip, especially those in the ‘brain’ channel. Total RNA was then extracted using RNeasy Mini Kit according to the manufacture’s protocol (Qiagen, Cat. No.: 74104). RNA quality and concentration were determined by Agilent 210 Bioanalyzer. The RNA amount obtained from each chip was as follows for each experimental condition: a chip with 10 days under normoxia generated about 250 ng; the same condition followed by 24 hours of ischaemia generated about 130 ng; a chip with 18 days under normoxia, used as the control group in neurorestorative efficacy evaluation, about 400 ng; a chip with reperfusion only, about 200 ng; a chip with therapeutic stem cells, about 350 ng to 750 ng depending on the stem cell type. Total RNA was reverse transcribed to cDNA using a high-capacity cDNA reverse transcription kit (Applied Biosystems, Cat. No.: 4368814). Real-time qPCR was performed in a StepOnePlus real-time PCR system (Applied Biosystems) using SsoAdvanced Universal SYBR Green Supermix (Bio-Rad, Cat. No.: 1725272A) to quantify the expression levels of the genes of interest. qPCR amplification was achieved with 40 cycles of 30 s at 95 °C, 15 s at 95 °C, and 50 s at 65 °C. We distinguished the signal from noise using StepOnePlus real-time PCR software and further checked manually to ensure the obtained Ct values had indeed come from real signals. Customized qPCR plates were designed and fabricated by Sciencell. Neurogenesis qPCR plates were purchased from Qiagen. We first chose 12 genes with well-known ischaemic behaviors and confirmed the reproducibility of their expression by triplicate. And we measured the expression of the final 123 genes with more than six independent chips for each experimental condition.
Evaluation of the neurorestorative potential of stem cells
We examined the neurorestorative potential of various types of stem cells. 24 hours after the ischaemic insult, the serum- and glucose-free DMEM medium was replaced with NDM/AM (the mixed medium of NDM, serum-free AM, and ACM at the ratio of 8:4:1 (v/v/v)) in the ‘CSF-side’ channel. Then the stem cells were collected at 5 × 10⁶ cells/mL density in ECM/PM (the mixed medium of serum-containing ECM and PM at the ratio of 9:1 (v/v)) and injected 104 cells into the ‘blood-side’ channel. This setting represented the intra-vascular route for stem cell transplantation, the most widely used route for stem cell therapy 112. The stem cells were incubated for 3 hours to allow for cell adhesion. And floating cells were gently washed away with fresh ECM/PM. Medium in both of the side channels was changed every day for 7 more days before further analysis.
Tracking stem cells
In order to track stem cell behaviors in the chip, we used the lentivirus vector carrying GFP to transfect stem cells hNPC, hNSC (NR1), hAMSC, hBMSC, and hEPC. We used pre-staining method for hHSC because the virus transfection efficiency of hHSC was not sufficient. We purchased ready-to-use GFP lentiviral particles from GenTarget Inc (San Diego, CA, USA) and used them according to the manufacture’s protocol with some modification. More specifically, cells were cultured in a 48-well plate until the confluency reached 50% to 75%. Cell culture medium was removed before transduction and 0.25 mL of fresh medium and 15 μL of virus solution were added to each well. Cells were cultured in a cell culture incubator for 2 – 3 days without medium change in between to achieve desirable transduction efficiency. hHSC was prestained with Vybrant™ DiO cell-labeling solution (Invitrogen, Cat. No.: V22886). hHSCs at 1 × 10⁶ cells/mL were incubated with staining medium (10 μL labelling solution per 1 mL culture medium) in a 96-well plate for 20 min in a cell culture incubator and washed with sterile PBS (Phosphate-buffered saline, pH = 7.4) for 3 times for use. After injecting each stem cell into the ‘blood-side’ channel of a chip following ischaemic insult, images were taken every other day for up to 7 days to track stem cell infiltration. At the end of the 7 days, stem cells were immunostained for stemness markers (Nestin for hNPC and hNSC, CD44 for hBMSC and hAMSC, and CD34 for hEPC and hHSC) and differentiation markers (MAP2 for neurogenesis, GFAP for gliogenesis, and von Willebrand Factor for vasculogenesis). The extravasation extent of both cancer and stem cells was quantified by image scoring (ImageJ, NIH).
Statistical analyses
Every independent experiment was repeated at least three times, and the results were presented as the mean ± s.d. For the quantitative analysis of fluorescence images, we obtained at least three images from different samples and used an image analysis software, ImageJ (NIH), to quantitatively analyze the aspects of interest. Statistical significance was evaluated using one-sided Student’s t-Test for two group comparisons and one way ANOVA with Bonferroni-Holm post hoc test for multiple group comparison (Daniel’s XL Toolbox). P-values less than 0.05 were considered significant.
Reporting Summary.
Further information on research design is available in the Nature Research Reporting Summary linked to this article.
Supplementary Material
Acknowledgements
We are grateful to Dr. Hyejean Suh for editing the manuscript. We thank Tom Klein, and Joseph and Sharon Saunders for their generous support. WL was supported by NIH National Center for Advancing Translational Science Clinical and Translational Science Award at the Stanford Child Health Research Institute (UL1 TR001085) and NIH National Cancer Institute career development award (K25CA201545).
Footnotes
Competing interests
The authors declare no competing interests.
Data availability
The main data supporting the results in this study are available within the paper and its Supplementary Information. The raw and analysed datasets generated during the study are too large to be publicly shared, yet they are available for research purposes from the corresponding author on reasonable request.
References
- 1.Wang Y & Cai Y Obtaining human ischemic stroke gene expression biomarkers from animal models: A cross-species validation study. Sci. Rep 6, 29693–29702 (2016). [DOI] [PMC free article] [PubMed] [Google Scholar]
- 2.Stonesifer C et al. Stem cell therapy for abrogating stroke-induced neuroinflammation and relevant secondary cell death mechanisms. Progress in Neurobiology 158, 94–131 (2017). [DOI] [PMC free article] [PubMed] [Google Scholar]
- 3.Wechsler LR, Bates D, Stroemer P, Andrews-Zwilling YS & Aizman I Cell therapy for chronic stroke. Stroke 49, 1066–1074 (2018). [DOI] [PubMed] [Google Scholar]
- 4.McGonigle P & Ruggeri B Animal models of human disease: challenges in enabling translation. Biochem. Pharmacol 87, 162–171 (2014). [DOI] [PubMed] [Google Scholar]
- 5.Savitz SI et al. Stem cells as an emerging paradigm in stroke 3: enhancing the development of clinical trials. Stroke 45, 634–639 (2014). [DOI] [PMC free article] [PubMed] [Google Scholar]
- 6.Woodruff TM et al. Pathophysiology, treatment, and animal and cellular models of human ischemic stroke. Mol. Neurodegener 6, 11–29 (2011). [DOI] [PMC free article] [PubMed] [Google Scholar]
- 7.Del Zoppo G The neurovascular unit in the setting of stroke. J. Intern. Med 267, 156–171 (2010). [DOI] [PMC free article] [PubMed] [Google Scholar]
- 8.Sivandzade F & Cucullo L In-vitro blood–brain barrier modeling: a review of modern and fast-advancing technologies. J. Cereb. Blood Flow Metab 38, 1667–1681 (2018). [DOI] [PMC free article] [PubMed] [Google Scholar]
- 9.Prabhakarpandian B et al. SyM-BBB: a microfluidic blood brain barrier model. Lab on a Chip 13, 1093–1101 (2013). [DOI] [PMC free article] [PubMed] [Google Scholar]
- 10.Herland A et al. Distinct contributions of astrocytes and pericytes to neuroinflammation identified in a 3D human blood-brain barrier on a chip. PLoS One 11, e0150360 (2016). [DOI] [PMC free article] [PubMed] [Google Scholar]
- 11.Wevers NR et al. A perfused human blood–brain barrier on-a-chip for high-throughput assessment of barrier function and antibody transport. Fluids and Barriers of the CNS 15, 23 (2018). [DOI] [PMC free article] [PubMed] [Google Scholar]
- 12.Grifno GN et al. Tissue-engineered blood-brain barrier models via directed differentiation of human induced pluripotent stem cells. Sci. Rep 9, 1–13 (2019). [DOI] [PMC free article] [PubMed] [Google Scholar]
- 13.Ahn SI et al. Microengineered human blood–brain barrier platform for understanding nanoparticle transport mechanisms. Nature communications 11, 1–12 (2020). [DOI] [PMC free article] [PubMed] [Google Scholar]
- 14.Kim S, Lee H, Chung M & Jeon NL Engineering of functional, perfusable 3D microvascular networks on a chip. Lab on a Chip 13, 1489–1500 (2013). [DOI] [PubMed] [Google Scholar]
- 15.Soofi SS, Last JA, Liliensiek SJ, Nealey PF & Murphy CJ The elastic modulus of Matrigel™ as determined by atomic force microscopy. J. Struct. Biol 167, 216–219 (2009). [DOI] [PMC free article] [PubMed] [Google Scholar]
- 16.Budday S et al. Mechanical characterization of human brain tissue. Acta Biomater 48, 319–340 (2017). [DOI] [PubMed] [Google Scholar]
- 17.Uemura M et al. Matrigel supports survival and neuronal differentiation of grafted embryonic stem cell‐derived neural precursor cells. J. Neurosci. Res 88, 542–551 (2010). [DOI] [PubMed] [Google Scholar]
- 18.Yu Z et al. Neuroglobin promotes neurogenesis through Wnt signaling pathway. Cell Death Dis 9, 945–956 (2018). [DOI] [PMC free article] [PubMed] [Google Scholar]
- 19.Nakagawa S et al. A new blood–brain barrier model using primary rat brain endothelial cells, pericytes and astrocytes. Neurochem. Int 54, 253–263 (2009). [DOI] [PubMed] [Google Scholar]
- 20.Dejana E Endothelial cell–cell junctions: happy together. Nature reviews Molecular cell biology 5, 261–270 (2004). [DOI] [PubMed] [Google Scholar]
- 21.Lee CS & Leong KW Advances in microphysiological blood-brain barrier (BBB) models towards drug delivery. Curr. Opin. Biotechnol 66, 78–87 (2020). [DOI] [PMC free article] [PubMed] [Google Scholar]
- 22.Mayhan WG & Heistad DD Permeability of blood-brain barrier to various sized molecules. American Journal of Physiology-Heart and Circulatory Physiology 248, H712–H718 (1985). [DOI] [PubMed] [Google Scholar]
- 23.Srinivasan B et al. TEER measurement techniques for in vitro barrier model systems. Journal of laboratory automation 20, 107–126 (2015). [DOI] [PMC free article] [PubMed] [Google Scholar]
- 24.Booth R & Kim H Characterization of a microfluidic in vitro model of the blood-brain barrier (μBBB). Lab on a Chip 12, 1784–1792 (2012). [DOI] [PubMed] [Google Scholar]
- 25.Papademetriou I, Vedula E, Charest J & Porter T Effect of flow on targeting and penetration of angiopep-decorated nanoparticles in a microfluidic model blood-brain barrier. PLoS One 13, e0205158 (2018). [DOI] [PMC free article] [PubMed] [Google Scholar]
- 26.Walter FR et al. A versatile lab-on-a-chip tool for modeling biological barriers. Sensors and Actuators B: Chemical 222, 1209–1219 (2016). [Google Scholar]
- 27.Brown JA et al. Recreating blood-brain barrier physiology and structure on chip: A novel neurovascular microfluidic bioreactor. Biomicrofluidics 9, 054124 (2015). [DOI] [PMC free article] [PubMed] [Google Scholar]
- 28.Wang YI, Abaci HE & Shuler ML Microfluidic blood–brain barrier model provides in vivo-like barrier properties for drug permeability screening. Biotechnol. Bioeng 114, 184–194 (2017). [DOI] [PMC free article] [PubMed] [Google Scholar]
- 29.Helms HC et al. In vitro models of the blood–brain barrier: an overview of commonly used brain endothelial cell culture models and guidelines for their use. J. Cereb. Blood Flow Metab 36, 862–890 (2016). [DOI] [PMC free article] [PubMed] [Google Scholar]
- 30.Yeste J et al. Geometric correction factor for transepithelial electrical resistance measurements in transwell and microfluidic cell cultures. Journal of Physics D: Applied Physics 49, 375401 (2016). [Google Scholar]
- 31.Foo LC et al. Development of a method for the purification and culture of rodent astrocytes. Neuron 71, 799–811 (2011). [DOI] [PMC free article] [PubMed] [Google Scholar]
- 32.Bos PD et al. Genes that mediate breast cancer metastasis to the brain. Nature 459, 1005–1009 (2009). [DOI] [PMC free article] [PubMed] [Google Scholar]
- 33.Hakim AM Ischemic penumbra: the therapeutic window. Neurology 51, S44–S46 (1998). [DOI] [PubMed] [Google Scholar]
- 34.Heiss W-D et al. Progressive derangement of periinfarct viable tissue in ischemic stroke. J. Cereb. Blood Flow Metab 12, 193–203 (1992). [DOI] [PubMed] [Google Scholar]
- 35.Stankowski JN & Gupta R Therapeutic Targets for Neuroprotection in Acute Ischemic Stroke: Lost in Translation? Antioxidants & redox signaling 14, 1841–1851 (2011). [DOI] [PMC free article] [PubMed] [Google Scholar]
- 36.Yang L, Shah KK & Abbruscato TJ An in vitro model of ischemic stroke. Astrocytes, 451–466 (2012). [DOI] [PubMed] [Google Scholar]
- 37.Shi H Hypoxia inducible factor 1 as a therapeutic target in ischemic stroke. Curr. Med. Chem 16, 4593–4600 (2009). [DOI] [PMC free article] [PubMed] [Google Scholar]
- 38.Mattson MP, Culmsee C & Yu ZF Apoptotic and antiapoptotic mechanisms in stroke. Cell Tissue Res 301, 173–187 (2000). [DOI] [PubMed] [Google Scholar]
- 39.Bereczki J, Balla J & Bereczki D Heme Oxygenase-1: Clinical Relevance in Ischemic Stroke. Curr. Pharm. Des 24, 2229–2235 (2018). [DOI] [PMC free article] [PubMed] [Google Scholar]
- 40.Boshuizen MC & Steinberg GK Stem Cell–Based Immunomodulation After Stroke: Effects on Brain Repair Processes. Stroke 49, 1563–1570 (2018). [DOI] [PMC free article] [PubMed] [Google Scholar]
- 41.Jin R, Yang G & Li G Inflammatory mechanisms in ischemic stroke: role of inflammatory cells. J. Leukoc. Biol 87, 779–789 (2010). [DOI] [PMC free article] [PubMed] [Google Scholar]
- 42.Park JS, Bateman MC & Goldberg MP Rapid alterations in dendrite morphology during sublethal hypoxia or glutamate receptor activation. Neurobiol. Dis 3, 215–227 (1996). [DOI] [PubMed] [Google Scholar]
- 43.Schmued LC, Albertson C & Slikker W Jr Fluoro-Jade: a novel fluorochrome for the sensitive and reliable histochemical localization of neuronal degeneration. Brain Res 751, 37–46 (1997). [DOI] [PubMed] [Google Scholar]
- 44.Besse A et al. Personalized medicine approach confirms a milder case of ABAT deficiency. Mol. Brain 9, 93 (2016). [DOI] [PMC free article] [PubMed] [Google Scholar]
- 45.Okaty BW, Miller MN, Sugino K, Hempel CM & Nelson SB Transcriptional and electrophysiological maturation of neocortical fast-spiking GABAergic interneurons. J. Neurosci 29, 7040–7052 (2009). [DOI] [PMC free article] [PubMed] [Google Scholar]
- 46.Lai TW, Zhang S & Wang YT Excitotoxicity and stroke: identifying novel targets for neuroprotection. Prog. Neurobiol 115, 157–188 (2014). [DOI] [PubMed] [Google Scholar]
- 47.Cameron M et al. Calcium imaging of AM dyes following prolonged incubation in acute neuronal tissue. PLoS One 11, e0155468 (2016). [DOI] [PMC free article] [PubMed] [Google Scholar]
- 48.Marambaud P, Dreses-Werringloer U & Vingtdeux V Calcium signaling in neurodegeneration. Mol. Neurodegener 4, 20 (2009). [DOI] [PMC free article] [PubMed] [Google Scholar]
- 49.Sneyd J et al. On the dynamical structure of calcium oscillations. Proceedings of the National Academy of Sciences 114, 1456–1461 (2017). [DOI] [PMC free article] [PubMed] [Google Scholar]
- 50.Arundine M & Tymianski M Molecular mechanisms of calcium-dependent neurodegeneration in excitotoxicity. Cell Calcium 34, 325–337 (2003). [DOI] [PubMed] [Google Scholar]
- 51.Weksler B et al. Blood-brain barrier-specific properties of a human adult brain endothelial cell line. The FASEB journal 19, 1872–1874 (2005). [DOI] [PubMed] [Google Scholar]
- 52.Tornavaca O et al. ZO-1 controls endothelial adherens junctions, cell–cell tension, angiogenesis, and barrier formation. J. Cell Biol 208, 821–838 (2015). [DOI] [PMC free article] [PubMed] [Google Scholar]
- 53.Mathiu O, ávan der Meer AD, JungáKim H, ávan der Helm MW & den Berg A Measuring direct current trans-epithelial electrical resistance in organ-on-a-chip microsystems. Lab on a Chip 15, 745–752 (2015). [DOI] [PubMed] [Google Scholar]
- 54.Talwar T & Srivastava MVP Role of vascular endothelial growth factor and other growth factors in post-stroke recovery. Annals of Indian Academy of Neurology 17, 1–6 (2014). [DOI] [PMC free article] [PubMed] [Google Scholar]
- 55.Sandoval KE & Witt KA Blood-brain barrier tight junction permeability and ischemic stroke. Neurobiol. Dis 32, 200–219 (2008). [DOI] [PubMed] [Google Scholar]
- 56.Carlos T, Clark R, Franicola‐Higgins D, Schiding J & Kochanek P Expression of endothelial adhesion molecules and recruitment of neutrophils after traumatic brain injury in rats. J. Leukoc. Biol 61, 279–285 (1997). [DOI] [PubMed] [Google Scholar]
- 57.DeStefano JG, Xu ZS, Williams AJ, Yimam N & Searson PC Effect of shear stress on iPSC-derived human brain microvascular endothelial cells (dhBMECs). Fluids and Barriers of the CNS 14, 20–34 (2017). [DOI] [PMC free article] [PubMed] [Google Scholar]
- 58.Colgan OC et al. Regulation of bovine brain microvascular endothelial tight junction assembly and barrier function by laminar shear stress. American Journal of Physiology-Heart and Circulatory Physiology 292, 3190–3197 (2007). [DOI] [PubMed] [Google Scholar]
- 59.Sweeney MD, Ayyadurai S & Zlokovic BV Pericytes of the neurovascular unit: key functions and signaling pathways. Nat. Neurosci 19, 771–783 (2016). [DOI] [PMC free article] [PubMed] [Google Scholar]
- 60.Winkler EA, Bell RD & Zlokovic BV Pericyte-specific expression of PDGF beta receptor in mouse models with normal and deficient PDGF beta receptor signaling. Mol. Neurodegener 5, 32 (2010). [DOI] [PMC free article] [PubMed] [Google Scholar]
- 61.Sá-Pereira I, Brites D & Brito MA Neurovascular unit: a focus on pericytes. Mol. Neurobiol 45, 327–347 (2012). [DOI] [PubMed] [Google Scholar]
- 62.Abbott NJ, Rönnbäck L & Hansson E Astrocyte–endothelial interactions at the blood–brain barrier. Nature Reviews Neuroscience 7, 41–53 (2006). [DOI] [PubMed] [Google Scholar]
- 63.Papadopoulos MC & Verkman AS Aquaporin-4 and brain edema. Pediatr. Nephrol 22, 778–784 (2007). [DOI] [PMC free article] [PubMed] [Google Scholar]
- 64.Liddelow SA et al. Neurotoxic reactive astrocytes are induced by activated microglia. Nature 541, 481–487 (2017). [DOI] [PMC free article] [PubMed] [Google Scholar]
- 65.Kimelberg HK & Nedergaard M Functions of astrocytes and their potential as therapeutic targets. Neurotherapeutics 7, 338–353 (2010). [DOI] [PMC free article] [PubMed] [Google Scholar]
- 66.Sofroniew MV & Vinters HV Astrocytes: biology and pathology. Acta Neuropathol 119, 7–35 (2010). [DOI] [PMC free article] [PubMed] [Google Scholar]
- 67.Liddelow SA & Barres BA Reactive astrocytes: production, function, and therapeutic potential. Immunity 46, 957–967 (2017). [DOI] [PubMed] [Google Scholar]
- 68.Guruswamy R & ElAli A Complex roles of microglial cells in ischemic stroke pathobiology: new insights and future directions. Int. J. Mol. Sci 18, 496–511 (2017). [DOI] [PMC free article] [PubMed] [Google Scholar]
- 69.Taib T et al. Neuroinflammation, myelin and behavior: temporal patterns following mild traumatic brain injury in mice. PLoS One 12, e0184811 (2017). [DOI] [PMC free article] [PubMed] [Google Scholar]
- 70.Matt SM, Lawson MA & Johnson RW Aging and peripheral lipopolysaccharide can modulate epigenetic regulators and decrease IL-1β promoter DNA methylation in microglia. Neurobiol. Aging 47, 1–9 (2016). [DOI] [PMC free article] [PubMed] [Google Scholar]
- 71.Jalland CM et al. Neil3 induced neurogenesis protects against prion disease during the clinical phase. Sci. Rep 6, 37844–37852 (2016). [DOI] [PMC free article] [PubMed] [Google Scholar]
- 72.Patel AR, Ritzel R, McCullough LD & Liu F Microglia and ischemic stroke: a double-edged sword. Int. J. Physiol. Pathophysiol. Pharmacol 5, 73–90 (2013). [PMC free article] [PubMed] [Google Scholar]
- 73.Walker DG & Lue L-F Immune phenotypes of microglia in human neurodegenerative disease: challenges to detecting microglial polarization in human brains. Alzheimers Res. Ther 7, 56–64 (2015). [DOI] [PMC free article] [PubMed] [Google Scholar]
- 74.Mantovani A et al. The chemokine system in diverse forms of macrophage activation and polarization. Trends Immunol 25, 677–686 (2004). [DOI] [PubMed] [Google Scholar]
- 75.Picascia A, Grimaldi V, Iannone C, Soricelli A & Napoli C Innate and adaptive immune response in stroke: focus on epigenetic regulation. J. Neuroimmunol 289, 111–120 (2015). [DOI] [PubMed] [Google Scholar]
- 76.Junger WG Immune cell regulation by autocrine purinergic signalling. Nature Reviews Immunology 11, 201–212 (2011). [DOI] [PMC free article] [PubMed] [Google Scholar]
- 77.Oliveira A, Illes P & Ulrich H Purinergic receptors in embryonic and adult neurogenesis. Neuropharmacology 104, 272–281 (2016). [DOI] [PubMed] [Google Scholar]
- 78.Marei HEM Potential of stem cell-based therapy for ischemic stroke. Front. Neurol 9, 34–40 (2018). [DOI] [PMC free article] [PubMed] [Google Scholar]
- 79.Szklarczyk D et al. Protein-protein association networks with increased coverage, supporting functional discovery in genome-wide experimental datasets. Nucleic Acids Res 47, D607–D613 (2019). [DOI] [PMC free article] [PubMed] [Google Scholar]
- 80.Naylor AJ et al. A differential role for CD248 (Endosialin) in PDGF-mediated skeletal muscle angiogenesis. PLoS One 9, e107146 (2014). [DOI] [PMC free article] [PubMed] [Google Scholar]
- 81.Sun J & Nan G The mitogen-activated protein kinase (MAPK) signaling pathway as a discovery target in stroke. J. Mol. Neurosci 59, 90–98 (2016). [DOI] [PubMed] [Google Scholar]
- 82.Kanehisa M, Sato Y, Furumichi M, Morishima K & Tanabe M New approach for understanding genome variations in KEGG. Nucleic Acids Res 47, D590–D595 (2019). [DOI] [PMC free article] [PubMed] [Google Scholar]
- 83.Soofi SS, Last JA, Liliensiek SJ, Nealey PF & Murphy CJ The elastic modulus of Matrigel™ as determined by atomic force microscopy. J. Struct. Biol 167, 216–219 (2009). [DOI] [PMC free article] [PubMed] [Google Scholar]
- 84.Pereda AE Electrical synapses and their functional interactions with chemical synapses. Nature Reviews Neuroscience 15, 250–263 (2014). [DOI] [PMC free article] [PubMed] [Google Scholar]
- 85.Janowski M, Wagner D-C & Boltze J Stem cell–based tissue replacement after stroke: factual necessity or notorious fiction? Stroke 46, 2354–2363 (2015). [DOI] [PMC free article] [PubMed] [Google Scholar]
- 86.Ohab JJ & Carmichael ST Poststroke neurogenesis: emerging principles of migration and localization of immature neurons. The Neuroscientist 14, 369 (2008). [DOI] [PubMed] [Google Scholar]
- 87.Campisi M et al. 3D self-organized microvascular model of the human blood-brain barrier with endothelial cells, pericytes and astrocytes. Biomaterials 180, 117–129 (2018). [DOI] [PMC free article] [PubMed] [Google Scholar]
- 88.Brown JA et al. Metabolic consequences of inflammatory disruption of the blood-brain barrier in an organ-on-chip model of the human neurovascular unit. J. Neuroinflammation 13, 1–17 (2016). [DOI] [PMC free article] [PubMed] [Google Scholar]
- 89.Sances S et al. Human iPSC-derived endothelial cells and microengineered organ-chip enhance neuronal development. Stem cell reports 10, 1222–1236 (2018). [DOI] [PMC free article] [PubMed] [Google Scholar]
- 90.Vatine GD et al. Human iPSC-derived blood-brain barrier chips enable disease modeling and personalized medicine applications. Cell stem cell 24, 995–1005 (2019). [DOI] [PubMed] [Google Scholar]
- 91.Xu L, Nirwane A & Yao Y Basement membrane and blood–brain barrier. Stroke Vasc. Neurol 4, 78–82 (2019). [DOI] [PMC free article] [PubMed] [Google Scholar]
- 92.Eddington DT, Puccinelli JP & Beebe DJ Thermal aging and reduced hydrophobic recovery of polydimethylsiloxane. Sensors and Actuators B: Chemical 114, 170–172 (2006). [Google Scholar]
- 93.Halldorsson S, Lucumi E, Gómez-Sjöberg R & Fleming RM Advantages and challenges of microfluidic cell culture in polydimethylsiloxane devices. Biosens. Bioelectron 63, 218–231 (2015). [DOI] [PubMed] [Google Scholar]
- 94.Ma X et al. Injection molding and characterization of PMMA-based microfluidic devices. Microsystem Technologies 26, 1317–1324 (2020). [Google Scholar]
- 95.Daadi MM, Maag A-L & Steinberg GK Adherent self-renewable human embryonic stem cell-derived neural stem cell line: functional engraftment in experimental stroke model. PLoS One 3, e1644 (2008). [DOI] [PMC free article] [PubMed] [Google Scholar]
- 96.Offner H, Vandenbark A & Hurn PD Effect of experimental stroke on peripheral immunity: CNS ischemia induces profound immunosuppression. Neuroscience 158, 1098–1111 (2009). [DOI] [PMC free article] [PubMed] [Google Scholar]
- 97.Ajami NE et al. Systems biology analysis of longitudinal functional response of endothelial cells to shear stress. Proceedings of the National Academy of Sciences 114, 10990–10995 (2017). [DOI] [PMC free article] [PubMed] [Google Scholar]
- 98.Wang C, Baker BM, Chen CS & Schwartz MA Endothelial cell sensing of flow direction. Arterioscler. Thromb. Vasc. Biol 33, 2130–2136 (2013). [DOI] [PMC free article] [PubMed] [Google Scholar]
- 99.Wang YI & Shuler ML UniChip enables long-term recirculating unidirectional perfusion with gravity-driven flow for microphysiological systems. Lab on a Chip 18, 2563–2574 (2018). [DOI] [PMC free article] [PubMed] [Google Scholar]
- 100.Rikhtegar R et al. Stem cell‐based cell therapy for neuroprotection in stroke: A review. J. Cell. Biochem 120, 8849–8862 (2019). [DOI] [PubMed] [Google Scholar]
- 101.Huertas-Vazquez A, Leon-Mimila P & Wang J Relevance of multi-omics studies in cardiovascular diseases. Frontiers in cardiovascular medicine 6, 91 (2019). [DOI] [PMC free article] [PubMed] [Google Scholar]
- 102.Mi S, Du Z, Xu Y & Sun W The crossing and integration between microfluidic technology and 3D printing for organ-on-chips. Journal of Materials Chemistry B 6, 6191–6206 (2018). [DOI] [PubMed] [Google Scholar]
- 103.von Bartheld CS, Bahney J & Herculano‐Houzel S The search for true numbers of neurons and glial cells in the human brain: A review of 150 years of cell counting. J. Comp. Neurol 524, 3865–3895 (2016). [DOI] [PMC free article] [PubMed] [Google Scholar]
- 104.Dore-Duffy P et al. Pericyte migration from the vascular wall in response to traumatic brain injury. Microvascular research 60, 55–69 (2000). [DOI] [PubMed] [Google Scholar]
- 105.Luissint A-C, Artus C, Glacial F, Ganeshamoorthy K & Couraud P-O Tight junctions at the blood brain barrier: physiological architecture and disease-associated dysregulation. Fluids and Barriers of the CNS 9, 23 (2012). [DOI] [PMC free article] [PubMed] [Google Scholar]
- 106.Vormann MK et al. Nephrotoxicity and kidney transport assessment on 3D perfused proximal tubules. The AAPS journal 20, 90 (2018). [DOI] [PubMed] [Google Scholar]
- 107.Curry F, Huxley V & Adamson R Permeability of single capillaries to intermediate-sized colored solutes. American Journal of Physiology-Heart and Circulatory Physiology 245, H495–H505 (1983). [DOI] [PubMed] [Google Scholar]
- 108.Haase K, Gillrie MR, Hajal C & Kamm RD Pericytes Contribute to Dysfunction in a Human 3D Model of Placental Microvasculature through VEGF‐Ang‐Tie2 Signaling. Advanced Science 6, 1900878 (2019). [DOI] [PMC free article] [PubMed] [Google Scholar]
- 109.Shin Y et al. Blood–Brain Barrier Dysfunction in a 3D In Vitro Model of Alzheimer’s Disease. Advanced Science 6, 1900962 (2019). [DOI] [PMC free article] [PubMed] [Google Scholar]
- 110.Lee SWL et al. Modeling Nanocarrier Transport across a 3D In Vitro Human Blood‐Brain–Barrier Microvasculature. Advanced Healthcare Materials 9, e1901486 (2020). [DOI] [PMC free article] [PubMed] [Google Scholar]
- 111.Boussommier-Calleja A et al. The effects of monocytes on tumor cell extravasation in a 3D vascularized microfluidic model. Biomaterials 198, 180–193 (2019). [DOI] [PMC free article] [PubMed] [Google Scholar]
- 112.Rodríguez-Frutos B et al. Stem cell therapy and administration routes after stroke. Translational stroke research 7, 378–387 (2016). [DOI] [PubMed] [Google Scholar]
Associated Data
This section collects any data citations, data availability statements, or supplementary materials included in this article.
Supplementary Materials
Data Availability Statement
The main data supporting the results in this study are available within the paper and its Supplementary Information. The raw and analysed datasets generated during the study are too large to be publicly shared, yet they are available for research purposes from the corresponding author on reasonable request.