

Abstract
Obstructive sleep apnea is associated with insulin resistance, lipid dysregulation, and hepatic steatosis and fibrosis in nonalcoholic fatty liver disease (NAFLD). We have previously shown that hepatocyte HIF-1 (hypoxia-inducible factor-1) mediates the development of liver fibrosis in a mouse model of NAFLD. We hypothesized that intermittent hypoxia (IH) modeling obstructive sleep apnea would worsen hepatic steatosis and fibrosis in murine NAFLD, via HIF-1. Mice with hepatocyte-specific deletion of Hif1a (Hif1a−/−hep) and wild-type (Hif1aF/F) controls were fed a high trans-fat diet to induce NAFLD with steatohepatitis. Half from each group were exposed to IH, and the other half were exposed to intermittent air. A glucose tolerance test was performed just prior to the end of the experiment. Mitochondrial efficiency was assessed in fresh liver tissue at the time of death. The hepatic malondialdehyde concentration and proinflammatory cytokine levels were assessed, and genes of collagen and fatty acid metabolism were examined. Hif1a−/−hep mice gained less weight than wild-type Hif1a mice (−2.3 g, P = 0.029). There was also a genotype-independent effect of IH on body weight, with less weight gain in mice exposed to IH (P = 0.003). Fasting glucose, homeostatic model assessment for insulin resistance, and glucose tolerance test results were all improved in Hif1a−/−hep mice. Liver collagen was increased in mice exposed to IH (P = 0.033) and was reduced in Hif1a−/−hep mice (P < 0.001), without any significant exposure/genotype interaction being demonstrated. Liver TNF-α and IL-1β were significantly increased in mice exposed to IH and were decreased in Hif1a−/−hep mice. We conclude that HIF-1 signaling worsens the metabolic profile and hastens NAFLD progression and that IH may worsen liver fibrosis. These effects are plausibly mediated by hepatic inflammatory stress.
Keywords: obstructive sleep apnea, lipid metabolism, hepatic fibrosis, hyperglycemia, HIF-1
Clinical Relevance
Obstructive sleep apnea appears in several studies to be associated with clinical worsening of nonalcoholic fatty liver disease. The goal of the present study was to determine whether the hypoxia of obstructive sleep apnea leads to worsened liver fibrosis and other poor outcomes in nonalcoholic fatty liver disease and whether these changes occur via hepatocyte HIF-1 (hypoxia-inducible factor-1). We have shown that intermittent hypoxia enhances liver fibrosis but that the changes appear to be independent of HIF-1.
Obstructive sleep apnea (OSA) is a common sleep disorder, affecting as much as 9–38% of the adult population based on recent data (1). The main manifestation of OSA is upper airway collapse, which leads to complete (apnea) or partial (hypopnea) cessation of flow during sleep (2). This upper airway collapse causes recurrent intermittent arterial hypoxia, which is likely associated with intermittent oxyhemoglobin desaturations in peripheral tissues (3), arousals from sleep, and marked intrathoracic pressure swings. In the last decade, several studies have demonstrated that recurrent intermittent hypoxia (IH) is associated with systemic inflammation and oxidative stress in peripheral tissues (4–6). Accordingly, OSA is associated with adverse cardiovascular and metabolic disease states like hypertension, heart failure, insulin resistance, and metabolic derangement (7–10).
Nonalcoholic fatty liver disease (NAFLD) is the hepatic manifestation of metabolic syndrome (11). Approximately 30% of the U.S. population are thought to have NAFLD, and ∼5% have nonalcoholic steatohepatitis (NASH) (12). NASH is characterized by hepatic steatosis, lobular inflammation, and ballooning with or without perisinusoidal fibrosis (13). Multiple reports have indicated that OSA severity plays a role in NAFLD development and progression, independent of the body mass index (14). Various models of NAFLD in rodents have been used to understand the pathogenesis and progression of this disease. Mice fed a high–trans-fat diet have been shown to develop obesity and severe NASH (15). We have shown that this diet increases hepatic triglyceride content and other histologic features of NASH, including profound fibrosis. We have also shown that the development of liver fibrosis in this model is dependent on hepatocyte expression of HIF-1α (hypoxia-inducible factor-1α) (16). We therefore hypothesized that IH as a model of OSA would result in activation of HIF-1 in the liver that would contribute to the development of severe fibrosis.
To test this hypothesis, we designed a 2 × 2 experiment in which wild-type (Hif1aF/F) or hepatocyte-specific Hif1a–knockout (Hif1a−/−hep) mice were placed on a high–trans-fat diet to induce NASH, were exposed to either IH or intermittent air (IA) to determine whether IH impacts liver fibrosis and other liver and metabolic outcomes in a mouse model and whether any observed differences are HIF-1 dependent. Concurrently, we performed a second experiment in which a stabilized antisense oligonucleotide (ASO) targeting HIF-1α (Hif1a-ASO), a scrambled, noncoding ASO (Scr-ASO), or saline was injected intraperitoneally into wild-type C57BL/6J mice while they were fed a high–trans-fat diet and exposed to IH to determine whether the IH-mediated effects on liver fibrosis could be abrogated by targeting HIF-1α mRNA.
Methods
Mice
Mice were bred as we have previously described (16) to have a deletion of the Hif1a gene in hepatocytes, which was achieved by using a Cre recombinase system in which Cre recombinase is expressed under the control of an albumin promoter. Hif 1aF/FAlb-Cre+/+ mice (Hif1a−/−hep mice) and Hif 1aF/FAlb-Cre−/− mice (Hif1aF/F mice) were used for this experiment. Male mice from each genotype (n = 6–12/group, aged 8–10 wk) were fed a high–trans-fat diet (40% fat, 18% of which was trans fat; 22% fructose; 2% cholesterol; Research Diets, Inc.) to induce NASH. Animals were exposed to light from 7 a.m. until 7 p.m. daily, housed at 2–4 mice per cage, and had food intake and weight recorded twice weekly. At the time of death, serum, liver, and epididymal fat were collected. Animal studies were approved by the Institutional Animal Care and Use Committee of the University of California San Diego.
Experimental Protocol and Hypoxia Exposure
Mice were continued on the high–trans-fat diet for 26 weeks. At Week 20, half the mice from each genotype were exposed to either IH or IA. A programmable device allowed adjustment of the gas content in the cages to fluctuate between a fraction of inspired oxygen (Fi O2) of 0.21 and an Fi O2 of 0.06 once per minute for 12 h/d during the light phase. IA exposure worked similarly so as to control for the continuous flow of gas into the cages, but air (Fi O2 of 0.21) was supplied continuously. Hypoxia or air exposures continued for the final 6 weeks of the experiment.
Glucose Tolerance Tests
Eight days before animals were killed, intraperitoneal glucose tolerance tests (GTTs) were performed. Mice were fasted for 5 hours, beginning at 7:30 a.m. A basal glucose level was obtained by using the tail scratch technique at Time 0 with a handheld glucometer (ACCU-CHEK Nano, Roche), and the mice were injected intraperitoneally with 1 g/kg glucose. Blood glucose was checked at 10, 20, 30, 60, 90, and 120 minutes after glucose injection. GTT results were analyzed by subtracting fasting glucose levels and calculating the area under the curve (AUC) for each mouse.
Evaluation of HIF-1α–targeted ASOs
In a second experiment, male wild-type C57BL/6J mice (The Jackson Laboratory), aged 8 weeks (n = 12), were begun on a high–trans-fat diet as described above to induce NASH. At Week 20, the mice were all exposed to IH as described above. The mice were divided into three groups. Group 1 was injected intraperitoneally with Hif1a-ASO (30 mg/kg in 100 μl of PBS; GenScript Biotech) twice a week for the final 6 weeks of the experiment (i.e., during the entire duration of IH exposure). Group 2 was injected with Scr-ASO of similar molecular weight (30 mg/kg in 100 μl of PBS), and group 3 was injected with 100 μl of PBS alone. The design of the targeted ASO was as described by Shin and colleagues (17) and has been shown to improve the metabolic profile in mice with diet-induced obesity. Briefly, the ASO is a 20-mer oligonucleotide with the sequence GTGCAGTATTGTAGCCAGGC and a 2'-O-(2-methoxyethyl) modification in bases 1–5 and 16–20 to increase nuclease resistance and mRNA affinity. Mice were killed at 26 weeks as described above.
Liver and Serum Assays
Fresh liver tissue samples were collected in 10% buffered formalin and then dehydrated with 70% ethyl alcohol after 24 hours and embedded in paraffin. Liver tissue was sectioned into 5-μm slices for staining. Hematoxylin and eosin (H&E) stains, Masson’s trichrome stain, and Sirius red stains were used to characterize NASH and liver fibrosis. Sirius red staining was quantified from eight images from each mouse sample in a blinded manner, and the values were averaged. Collagen was quantified by using a hydroxyproline assay (QuickZyme Biosciences). Collagen content was determined from this assay by assuming a hydroxyproline content of 13.5% (18), and samples were normalized for liver weight. Whole-liver tissue was homogenized, the triglyceride content was determined (Cayman Chemical Co.), and liver malondialdehyde (MDA), a marker of lipid peroxidation, was assessed (MilliporeSigma). TNF-α, IL-6, and IL-1β levels were quantified in liver tissue homogenates by using an ELISA (Invitrogen). Serum insulin levels were also assessed by using an ELISA (MilliporeSigma), and the homeostatic model assessment for insulin resistance (HOMA-IR) index was calculated by using the product of serum insulin (U/L) and glucose (mg/dl) divided by 405.
Immunofluorescence and Assessment of Mitochondrial Function
Immunofluorescence for HIF-1α protein was performed on frozen liver specimens embedded in O.C.T. compound. Forty-micrometer sections were mounted on slides, fixed, and permeabilized. Immunofluorescence was done with a primary antibody against HIF-1α (1:100, Novus Biologicals), and a conjugated goat antimouse secondary antibody (Life Technologies). On the basis of our earlier experiments, in which RNA sequencing suggesting significant gene expression changes in whole-liver tissue in pathways relevant to oxidative phosphorylation and mitochondrial function in Hif1a−/−hep mice (unpublished results), we also examined mitochondrial efficiency in the present experiment. Mitochondrial function was assessed in fresh permeabilized liver tissue slices from the same anatomic location (∼5-mg blotted weight) suspended in biopsy preservation solution (BIOPS) respiratory buffer (110mM d-sucrose, 20mM HEPES, 10mM KH2PO4, 20mM taurine, 60mM lactobionic acid, 3mM MgCl2, and 0.5mM EGTA) by quantitating oxygen consumption rates polarographically in a sealed, high-resolution respirometer (Oroboros Oxygraph-2k, Oroboros Instruments) normalized to tissue weight. Samples were placed in 2 ml of mitochondrial respiration medium (MiR05) respiratory media (0.5mM EGTA, 3mM MgCl2, 60mM lactobionic acid, 20mM taurine, 10mM KH2PO4, 20mM HEPES, 110mM d-sucrose, and 1 g/L BSA, adjusted to a pH of 7.1), and the O2 in the media was never fully depleted ([O2] was maintained at 250–500 μM). Oxygen consumption kinetics using carbohydrates (malate and pyruvate) as substrates were measured under state I through state IV conditions (i.e., a substrate–uncoupler– inhibitor titration protocol): after the addition of malate and pyruvate, ADP was added incrementally, then succinate was added, and then carbonyl cyanide m-chlorophenyl hydrazone, a mitochondrial uncoupler, was added to determine the maximal uncoupled respiration for measurement of electron transport system capacity. State III oxygen consumption was determined after the addition of ADP (20nM), and state IV oxygen consumption was determined after the addition of succinate (5mM). Measurements of oxygen consumption were each performed in duplicate liver samples. Sample data were discarded if we observed a >10% increase in oxygen consumption after the addition of carbonyl cyanide m-chlorophenyl hydrazone. The respiratory control ratio (RCR) was calculated as the ratio of state III to state IV oxygen consumption. The assessment of the mitochondrial RCR was similar to that described by Ioja and colleagues (19).
RT-PCR
RNA was isolated from liver tissue by using an RNeasy Mini Kit (Qiagen) according to the supplied protocol. cDNA was synthesized by using an Advantage RT for PCR kit (Clontech Laboratories, Inc.). RT-PCR was performed with primers and TaqMan probes from Life Technologies. The target mRNA level was normalized to 18S mRNA by using the following formula: target/18S = 2Ct(18S)–Ct(target).
Statistical Analysis
For the main experiment described above, statistical comparisons between groups of mice for data resulting in single-point measurements were performed by using factorial (two-way) ANOVA. Independent variables were the genotype (Hif1a−/−hep vs. Hif1aF/F) and exposure (IH vs. IA), and the effects of each independent variable and the interactive effect were compared for each outcome of interest. For comparing initial the body weight to the body weight at the time of IH/IA exposure, a two-tailed Student’s t test was used to describe the genotype effect. For gene expression, comparisons were made in each group relative to IA-exposed Hif1aF/F mice by using one-way ANOVA. For the secondary experiment involving ASO administration, statistical comparisons between groups of mice were made with one-way ANOVA. For all statistical comparisons, a P value of <0.05 was the threshold used for statistical significance. Data are reported as the mean ± SEM unless otherwise noted. Analysis was unadjusted for multiple comparisons. Prism 8 software (GraphPad) was used for all analyses.
Results
Metabolic Characteristics
The metabolic profile of Hif1a−/−hep mice was generally better than that of Hif1aF/F mice, whereas IH exposure had no significant impact on metabolic parameters relative to IA, and there were no interactive effects between the genotype and hypoxic exposure (Figure 1). Hif1a−/−hep and Hif1aF/F mice were initially well matched for weight (26.2 ± 0.7 g vs. 25.9 ± 0.4 g, respectively; P = 0.704; Table 1). Hif1a−/−hep mice had gained less weight by the time of IH initiation than the Hif1aF/F mice (11.7 g vs. 14.0 g; P = 0.029). Between the start of IH/IA exposure and the time of death, mice in the IA group had gained a modest amount of weight and mice in IH group had lost weight; that is, there was a HIF-1–independent effect of IH on weight (P = 0.465 for genotype effect, P = 0.003 for exposure effect, and P = 0.928 for interactive effect). Hif1a−/−hep mice had lower fasting glucose (P = 0.001 for genotype effect, P = 0.506 for exposure effect; Figure 1A). Neither IH nor the HIF-1α status impacted fasting insulin levels (P = 0.199 for genotype effect and P = 0.112 for exposure effect), but the HOMA-IR index was reduced in Hif1a−/−hep mice relative to Hif1aF/F mice (P = 0.047 for genotype effect, P = 0.071 for exposure effect, and P = 0.186 for interaction), which was driven by a reduction in fasting glucose. Hif1a−/−hep mice also had an improved GTT AUC relative to Hif1aF/F mice (P = 0.016 for genotype effect and P = 0.889 for exposure effect; Figure 1B). IH reduced liver weight at the time of death (P = 0.017, Figure 1C), but there was no genotype effect (P = 0.610). When expressed as a percentage of total body weight, liver weight was not impacted by IH. Hif1a−/−hep mice had less epididymal fat, a major storage site for visceral white adipose tissue in mice, than Hif1aF/F mice (P = 0.010), even when epididymal fat was expressed as a percentage of total body weight, whereas there was again no effect of exposure (P = 0.587).
Figure 1.
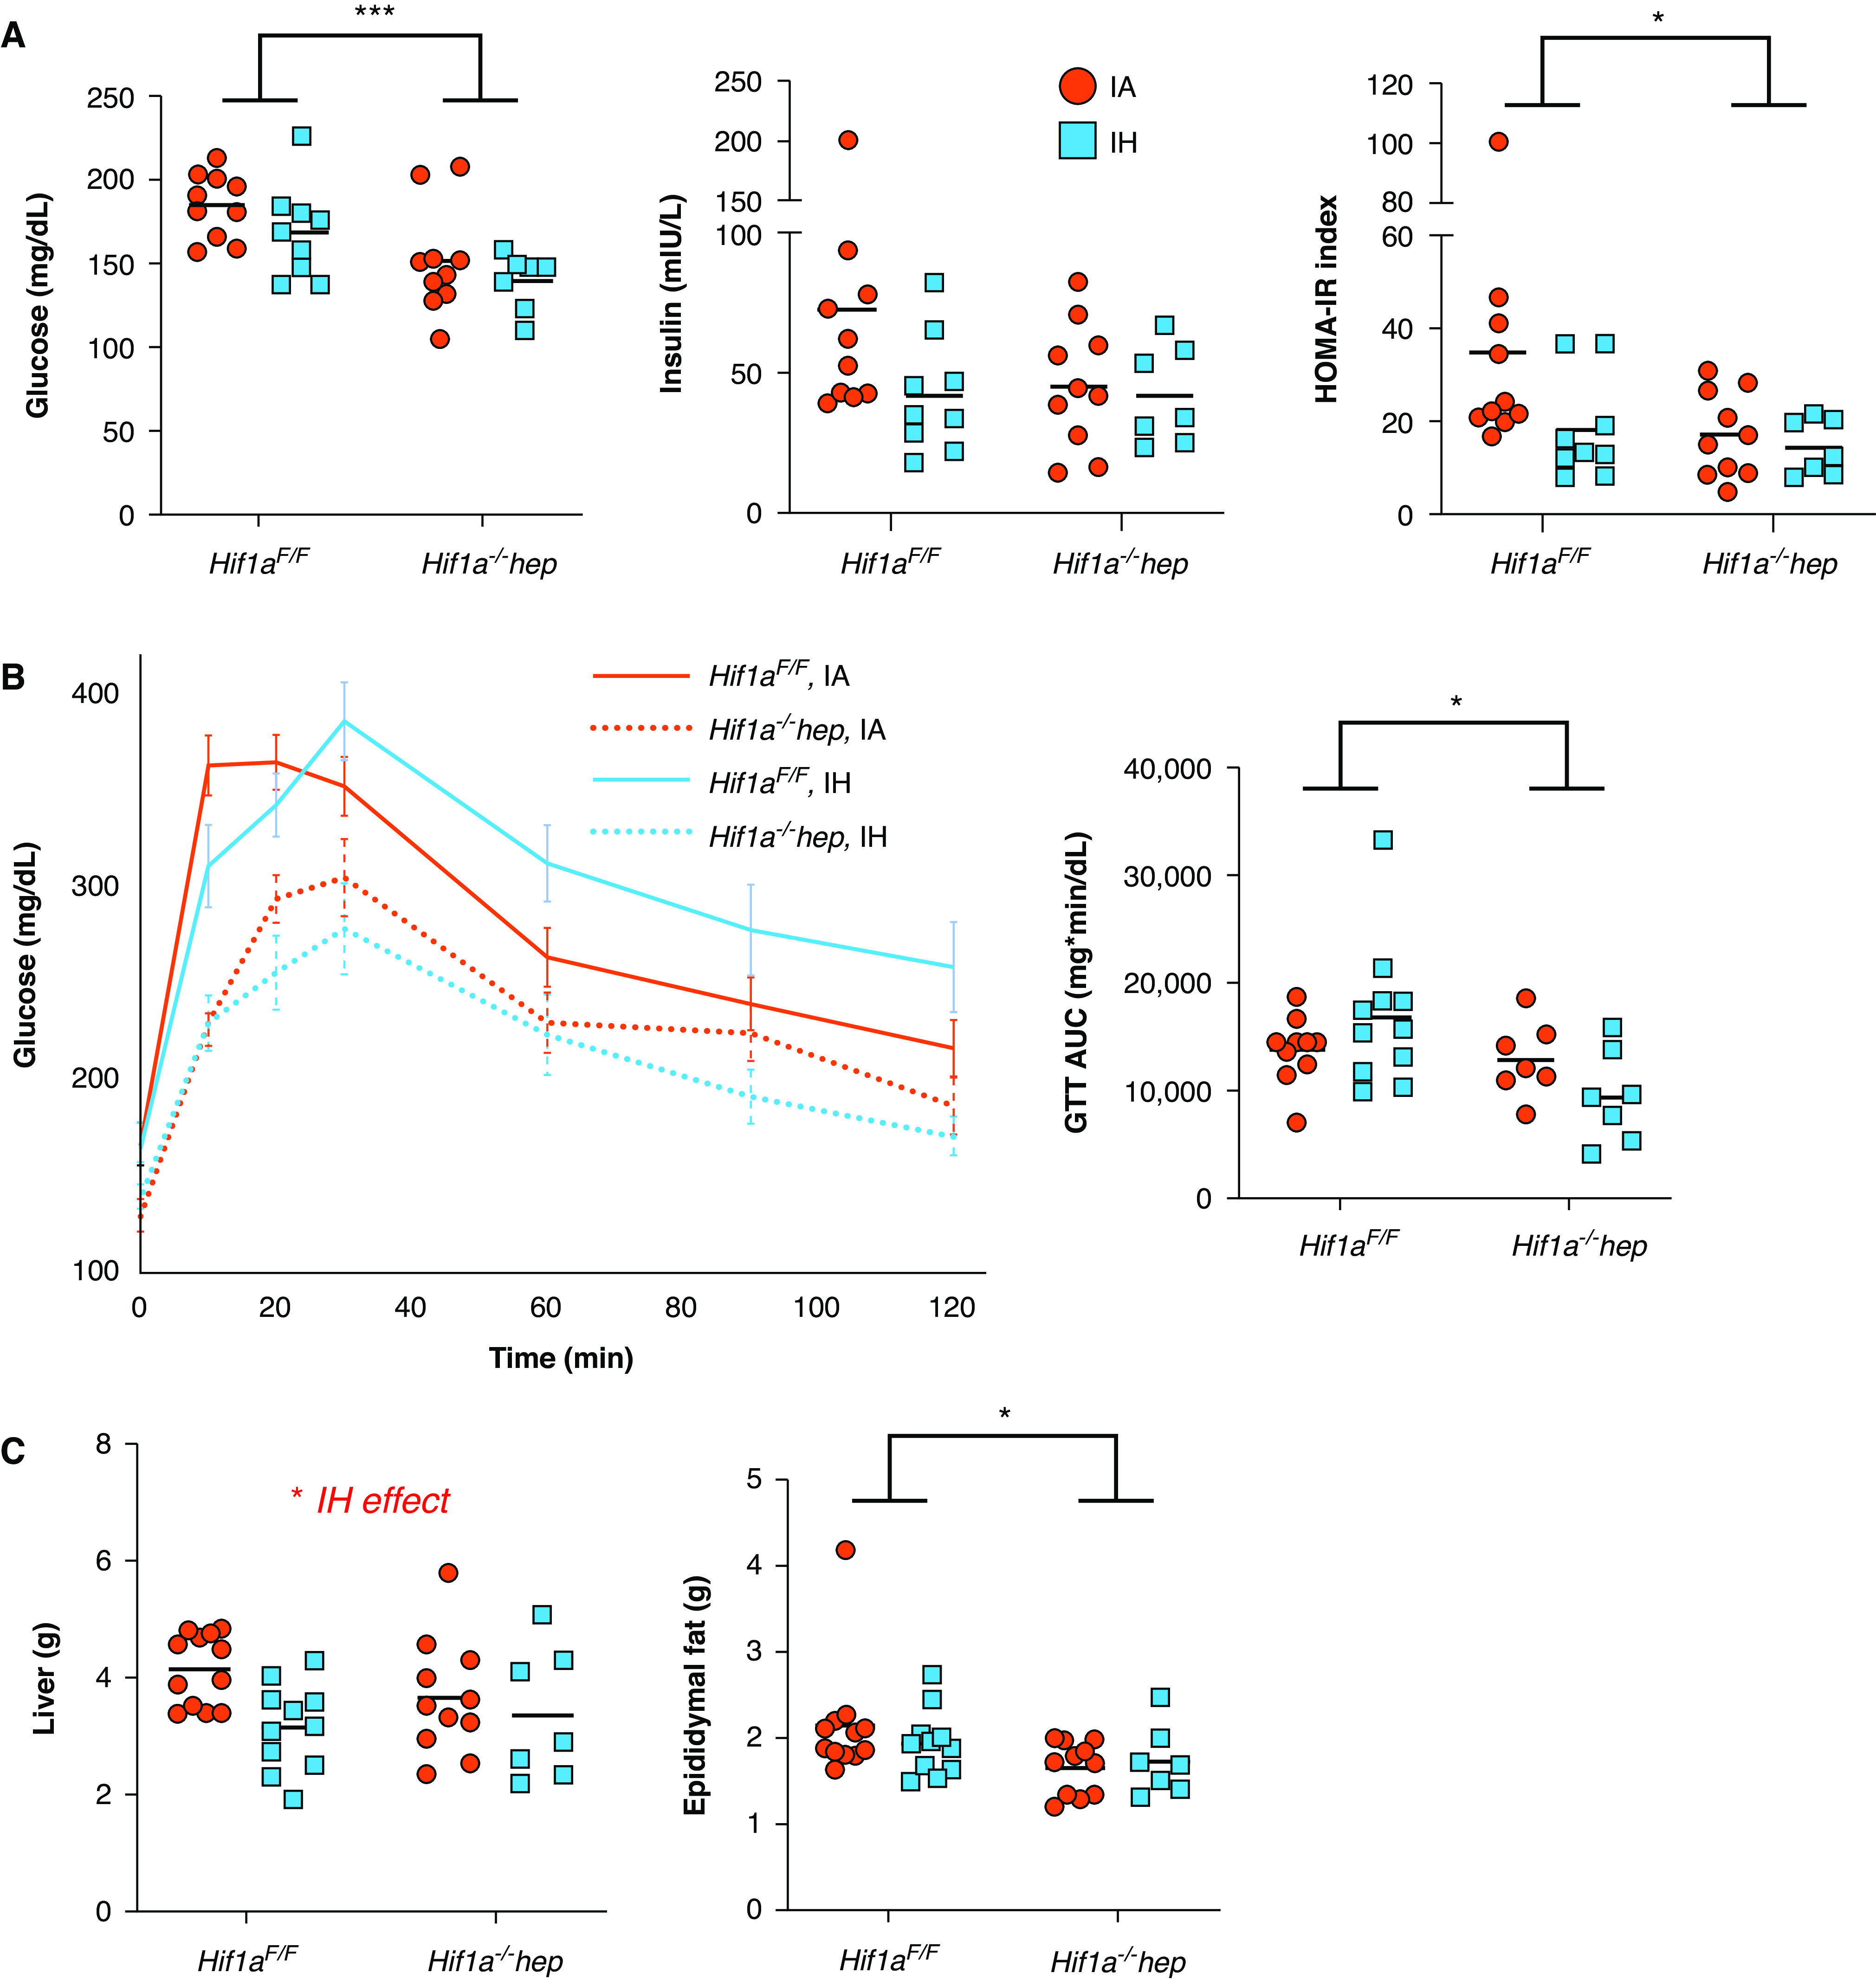
Metabolic characteristics. (A) Hepatocyte-specific Hif1a (hypoxia-inducible factor-1α)–knockout (Hif1a−/−hep) mice had reduced fasting glucose relative to wild-type (Hif1aF/F) mice (P = 0.001), but intermittent hypoxia (IH) had no impact. Insulin levels were not different between groups, but the HOMA-IR index was reduced in Hif1a−/−hep mice (P = 0.047). (B) Glucose tolerance test (GTT) results in all groups. Hif1a−/−hep conferred a protective effect on glucose handling during GTTs (P = 0.016) that was not impacted by IH. (C) Liver weight at the time of death was lower in the IH group (P = 0.017), although liver weight as a percentage of body weight was not different. Hif1a−/−hep mice had less epididymal fat than Hif1aF/F mice (P = 0.010), although no effect of IH was observed, despite overall differences in body weight due to hypoxia exposure. Epididymal fat weight differences between genotypes persisted when epididymal fat was expressed as a percentage of overall body weight (5.3% ± 0.2% in Hif1aF/F mice overall vs. 4.6% ± 0.1% in Hif1a−/−hep mice overall; P = 0.034 for genotype effect determined by using two-way ANOVA). *P < 0.05 and ***P < 0.005 for comparisons made by using two-way ANOVA. When the P value was <0.05 for exposure comparisons made by using two-way ANOVA, this is noted above the figure. AUC = area under the curve; HOMA-IR = homeostatic model assessment for insulin resistance; IA = intermittent air.
Table 1.
Mouse Weights over Experiment Duration
| Hif1aF/F (n = 23) | Hif1a−/−hep (n = 18) | P | |||
|---|---|---|---|---|---|
| Initial weight, g | 25.9 ± 0.4 | 26.2 ± 0.5 | 0.704 | ||
| Weight at exposure onset (Week 20), g | 40.0 ± 0.5 | 37.9 ± 0.8 | 0.037 | ||
| IA (n = 12) | IH (n = 11) | IA (n = 11) | IH (n = 7) | P | |
| Weight at death (Week 26), g | 40.7 ± 0.7 | 38.7 ± 0.8 | 37.7 ± 0.9 | 36.2 ± 1.7 | 0.003 (exposure) |
| 0.465 (genotype) | |||||
| 0.928 (interaction) | |||||
Definition of abbreviations: Hif1a = hypoxia-inducible factor-1α; Hif1aF/F = wild-type; Hif1a−/−hep = hepatocyte-specific Hif1a knockout; IA = intermittent air; IH = intermittent hypoxia.
HIF-1 Response to Hif1a−/−hep and IH
To verify the Hif1a−/−hep genotype, as well as to determine the effect of IH on HIF-1α, the expression of two target genes of HIF-1 was quantitated by using RT-PCR in a subset of mice from each group (n = 6/group). In Hif1aF/F mice, Vegf expression and Slc2a1 expression were both increased in the IH group (2.03-fold and 1.92-fold [P = 0.003 and P = 0.041], respectively, relative to IA mice; Figure 2A). Vegf expression and Slc2a1 expression were lower in IA-exposed Hif1a−/−hep mice than in IA-exposed Hif1aF/F mice (0.45-fold relative expression for Vegf [P = 0.033] and 0.32-fold relative expression for Slc2a1 [P = 0.047]). HIF-1α was directly examined in liver tissue in a subgroup of mice by using immunofluorescence (for representative images, see Figure 2B).
Figure 2.

HIF-1α target genes and immunoreactivity responses to IH and Hif1a−/−hep. (A) RT-PCR results for Vegf (left) and Slc2a1 (right, encoding the GLUT1 protein) expression in total liver tissue (n = 6/group). IH increased expression of both Vegf and Slc2a1 in Hif1aF/F mice. Hif1a−/−hep mice showed reduced expression of both relative to Hif1aF/F mice. *P < 0.05 and *** P < 0.005 for two-tailed unpaired t test comparison with Hif1aF/F IA group. (B) Immunofluorescence results for HIF-1α protein from frozen sectioned liver tissue. A marked increase in HIF-1α is seen in IH-exposed Hif1aF/F mice. HIF-1α is not as highly stabilized in IA-exposed Hif1a−/−hep mice compared with IA-exposed Hif1aF/F mice and appears to be largely confined to nonhepatocytes such as endothelial cells (white arrows), which were unimpacted by Hif1a−/−hep. Scale bars, 200 μm.
Characterization of NAFLD Severity
NAFLD severity was determined by using a variety of endpoints. Representative H&E staining, Masson’s trichrome staining, and Sirius red staining are all shown in Figure 3A. Liver aminotransferase levels (ALT [alanine aminotransferase] and AST [aspartate aminotransferase]) were highly elevated in all groups, but neither the genotype nor the exposure had an effect (Table 2). AP (alkaline phosphatase) levels were normal in all mice. There was no significant impact from the genotype or IH/IA exposure on the liver triglyceride content (Figure 3B). Liver collagen content, measured by using a hydroxyproline assay, was significantly higher in Hif1aF/F mice than in Hif1a−/−hep mice (P < 0.001), and IH increased hydroxyproline as well (P = 0.033), but there was no significant interactive effect (P = 0.192; Figure 3C). Similarly, Sirius red staining showed a reduction of liver fibrosis in Hif1a−/−hep mice (P < 0.001) and an increase in liver fibrosis with IH (P = 0.020) but showed no interactive effect (P = 0.440).
Figure 3.
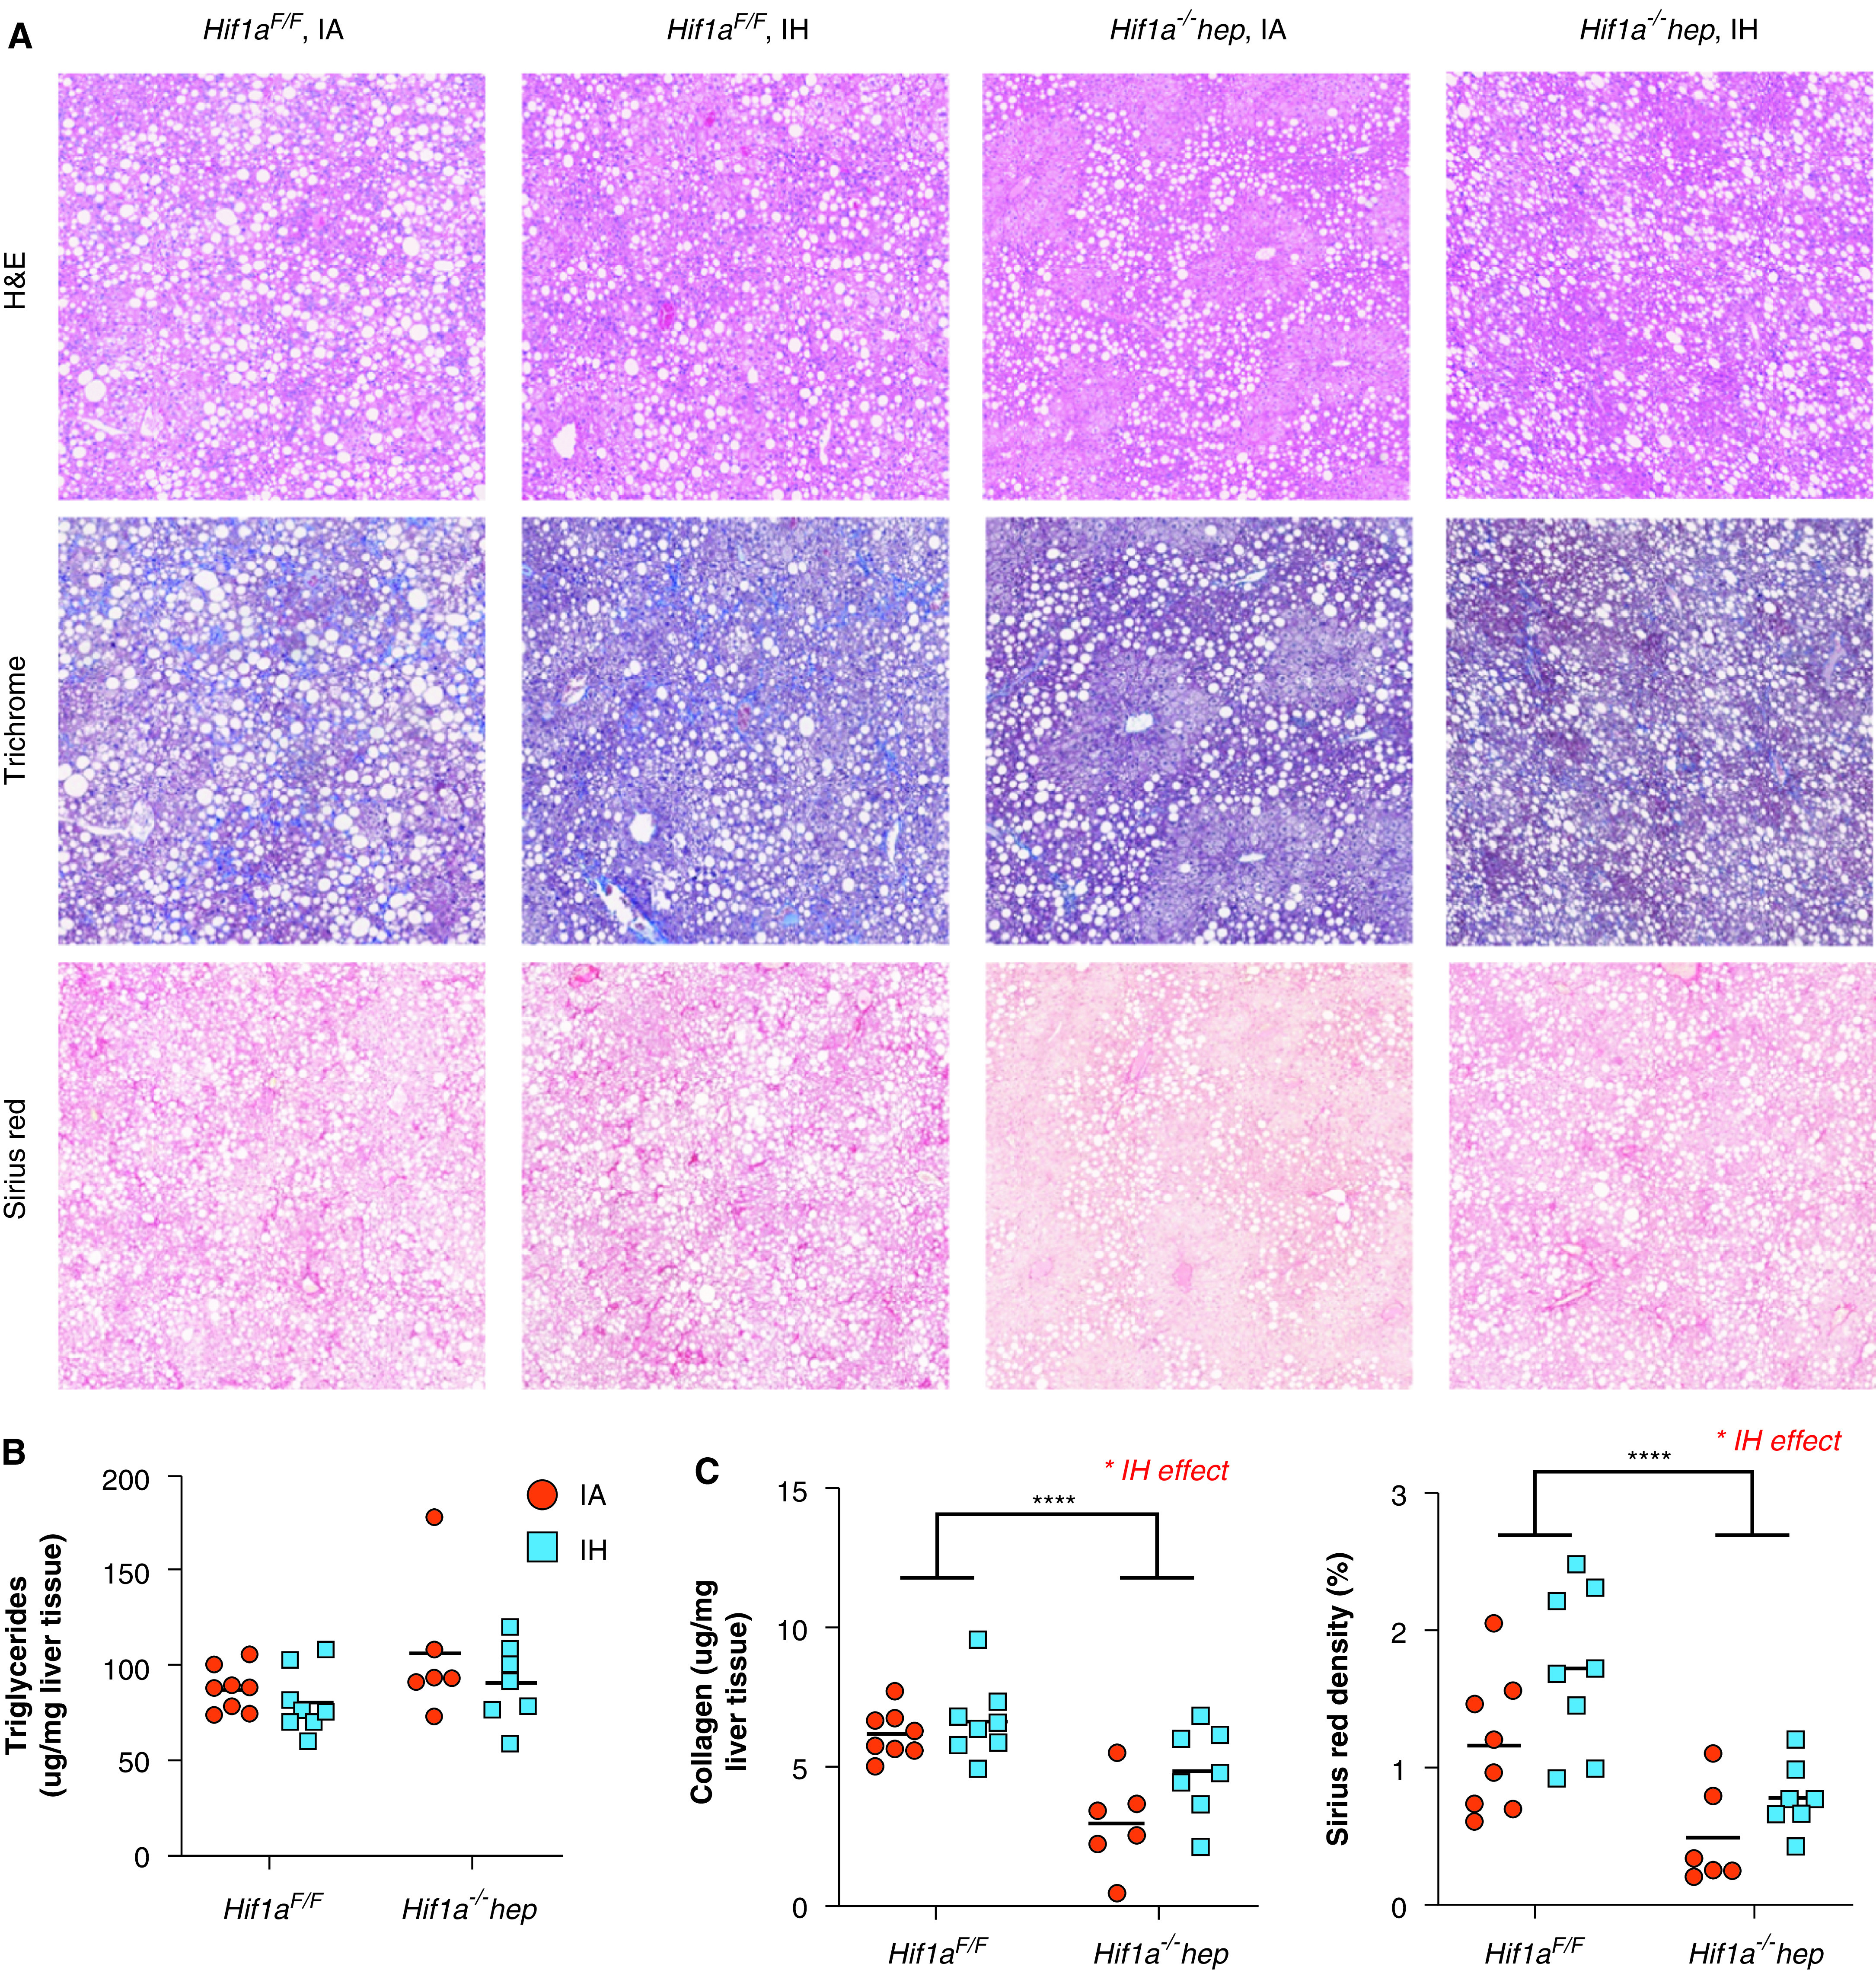
Nonalcoholic fatty liver disease characteristics. (A) Representative H&E, Masson’s trichrome, and Sirius red stains from all experimental groups. Large white circles are vacuoles of fat as seen in severe hepatic steatosis. In Masson’s trichrome staining, collagen stains blue, and in Sirius red staining, collagen stains dark red. There is less collagen apparent in Hif1a−/−hep liver samples. (B) Hepatic triglyceride content. Neither the genotype (P = 0.095) nor the exposure (P = 0.191) impacted hepatic triglyceride levels. (C) Hepatic collagen content as assessed by using a hydroxyproline assay (left) and evaluation of liver fibrosis by using Sirius red staining (right). *P < 0.05 and ****P < 0.001 for comparisons made by using two-way ANOVA. When P values are <0.05 for exposure comparisons made by using two-way ANOVA, this is noted above the figure. Scale bars, 200 μm. H&E = hematoxylin and eosin.
Table 2.
Serum Aminotransferase and AP Levels at the Time of Death
|
Hif1aF/F |
Hif1a−/−hep |
P | |||
|---|---|---|---|---|---|
| IA (n = 10) | IH (n = 10) | IA (n = 9) | IH (n = 7) | ||
| AST, U/L | 514 ± 137 | 647 ± 158 | 371 ± 92 | 771 ± 287 | 0.117 (exposure) |
| 0.955 (genotype) | |||||
| 0.426 (interaction) | |||||
| ALT, U/L | 231 ± 31 | 154 ± 17 | 331 ± 123 | 490 ± 259 | 0.746 (exposure) |
| 0.087 (genotype) | |||||
| 0.346 (interaction) | |||||
| AP, U/L | 65 ± 5 | 44 ± 7 | 56 ± 6 | 53 ± 10 | 0.098 (exposure) |
| 0.976 (genotype) | |||||
| 0.193 (interaction) | |||||
Definition of abbreviations: ALT = alanine aminotransferase; AP = alkaline phosphatase; AST = aspartate aminotransferase.
Aminotransferase levels were highly elevated in all groups, without significant effects of genotype or hypoxic exposure being shown. AP was normal in all groups.
Effects on Oxidative Stress, Inflammatory Cytokines, Mitochondrial Function, and Gene Expression
To understand the mechanisms by which HIF-1 and IH may have impacted metabolic and liver-related outcomes, we examined liver oxidative stress by measuring a marker of lipid peroxidation (MDA), hepatic levels of proinflammatory cytokines, liver mitochondrial efficiency, and genes of fatty acid metabolism and collagen synthesis by using RT-PCR (Figure 4). Despite a reduction in the liver collagen content in Hif1a−/−hep mice, MDA levels were higher in Hif1a−/−hep mice than in Hif1aF/F mice (P < 0.001; Figure 4A). There was no significant effect of IH, and there was no interactive effect. Hepatic levels of the proinflammatory cytokines IL-1β and TNF-α were lower in Hif1a−/−hep mice and were higher with IH exposure (P < 0.001 for both exposure and genotype effects for each cytokine; Table 3), but there was no effect of either exposure or genotype on IL-6 levels. No interactive effects between the genotype and exposure were noted. Hepatic mitochondrial efficiency was assessed by calculating the RCR, the ratio of state III to state IV oxygen consumption. The RCR was reduced in Hif1a−/−hep mice relative to Hif1aF/F mice (P = 0.002; Figure 4B). There was no effect of IH on the RCR. Hif1a−/−hep mice in the IA group had lower expression of Loxl1 and Col3a1 than Hif1aF/F mice in the IA group (P = 0.045 and P = 0.029, respectively; Figure 4C), but there was no effect of IH. There were no significant effects of either genotype or exposure on the other examined genes.
Figure 4.
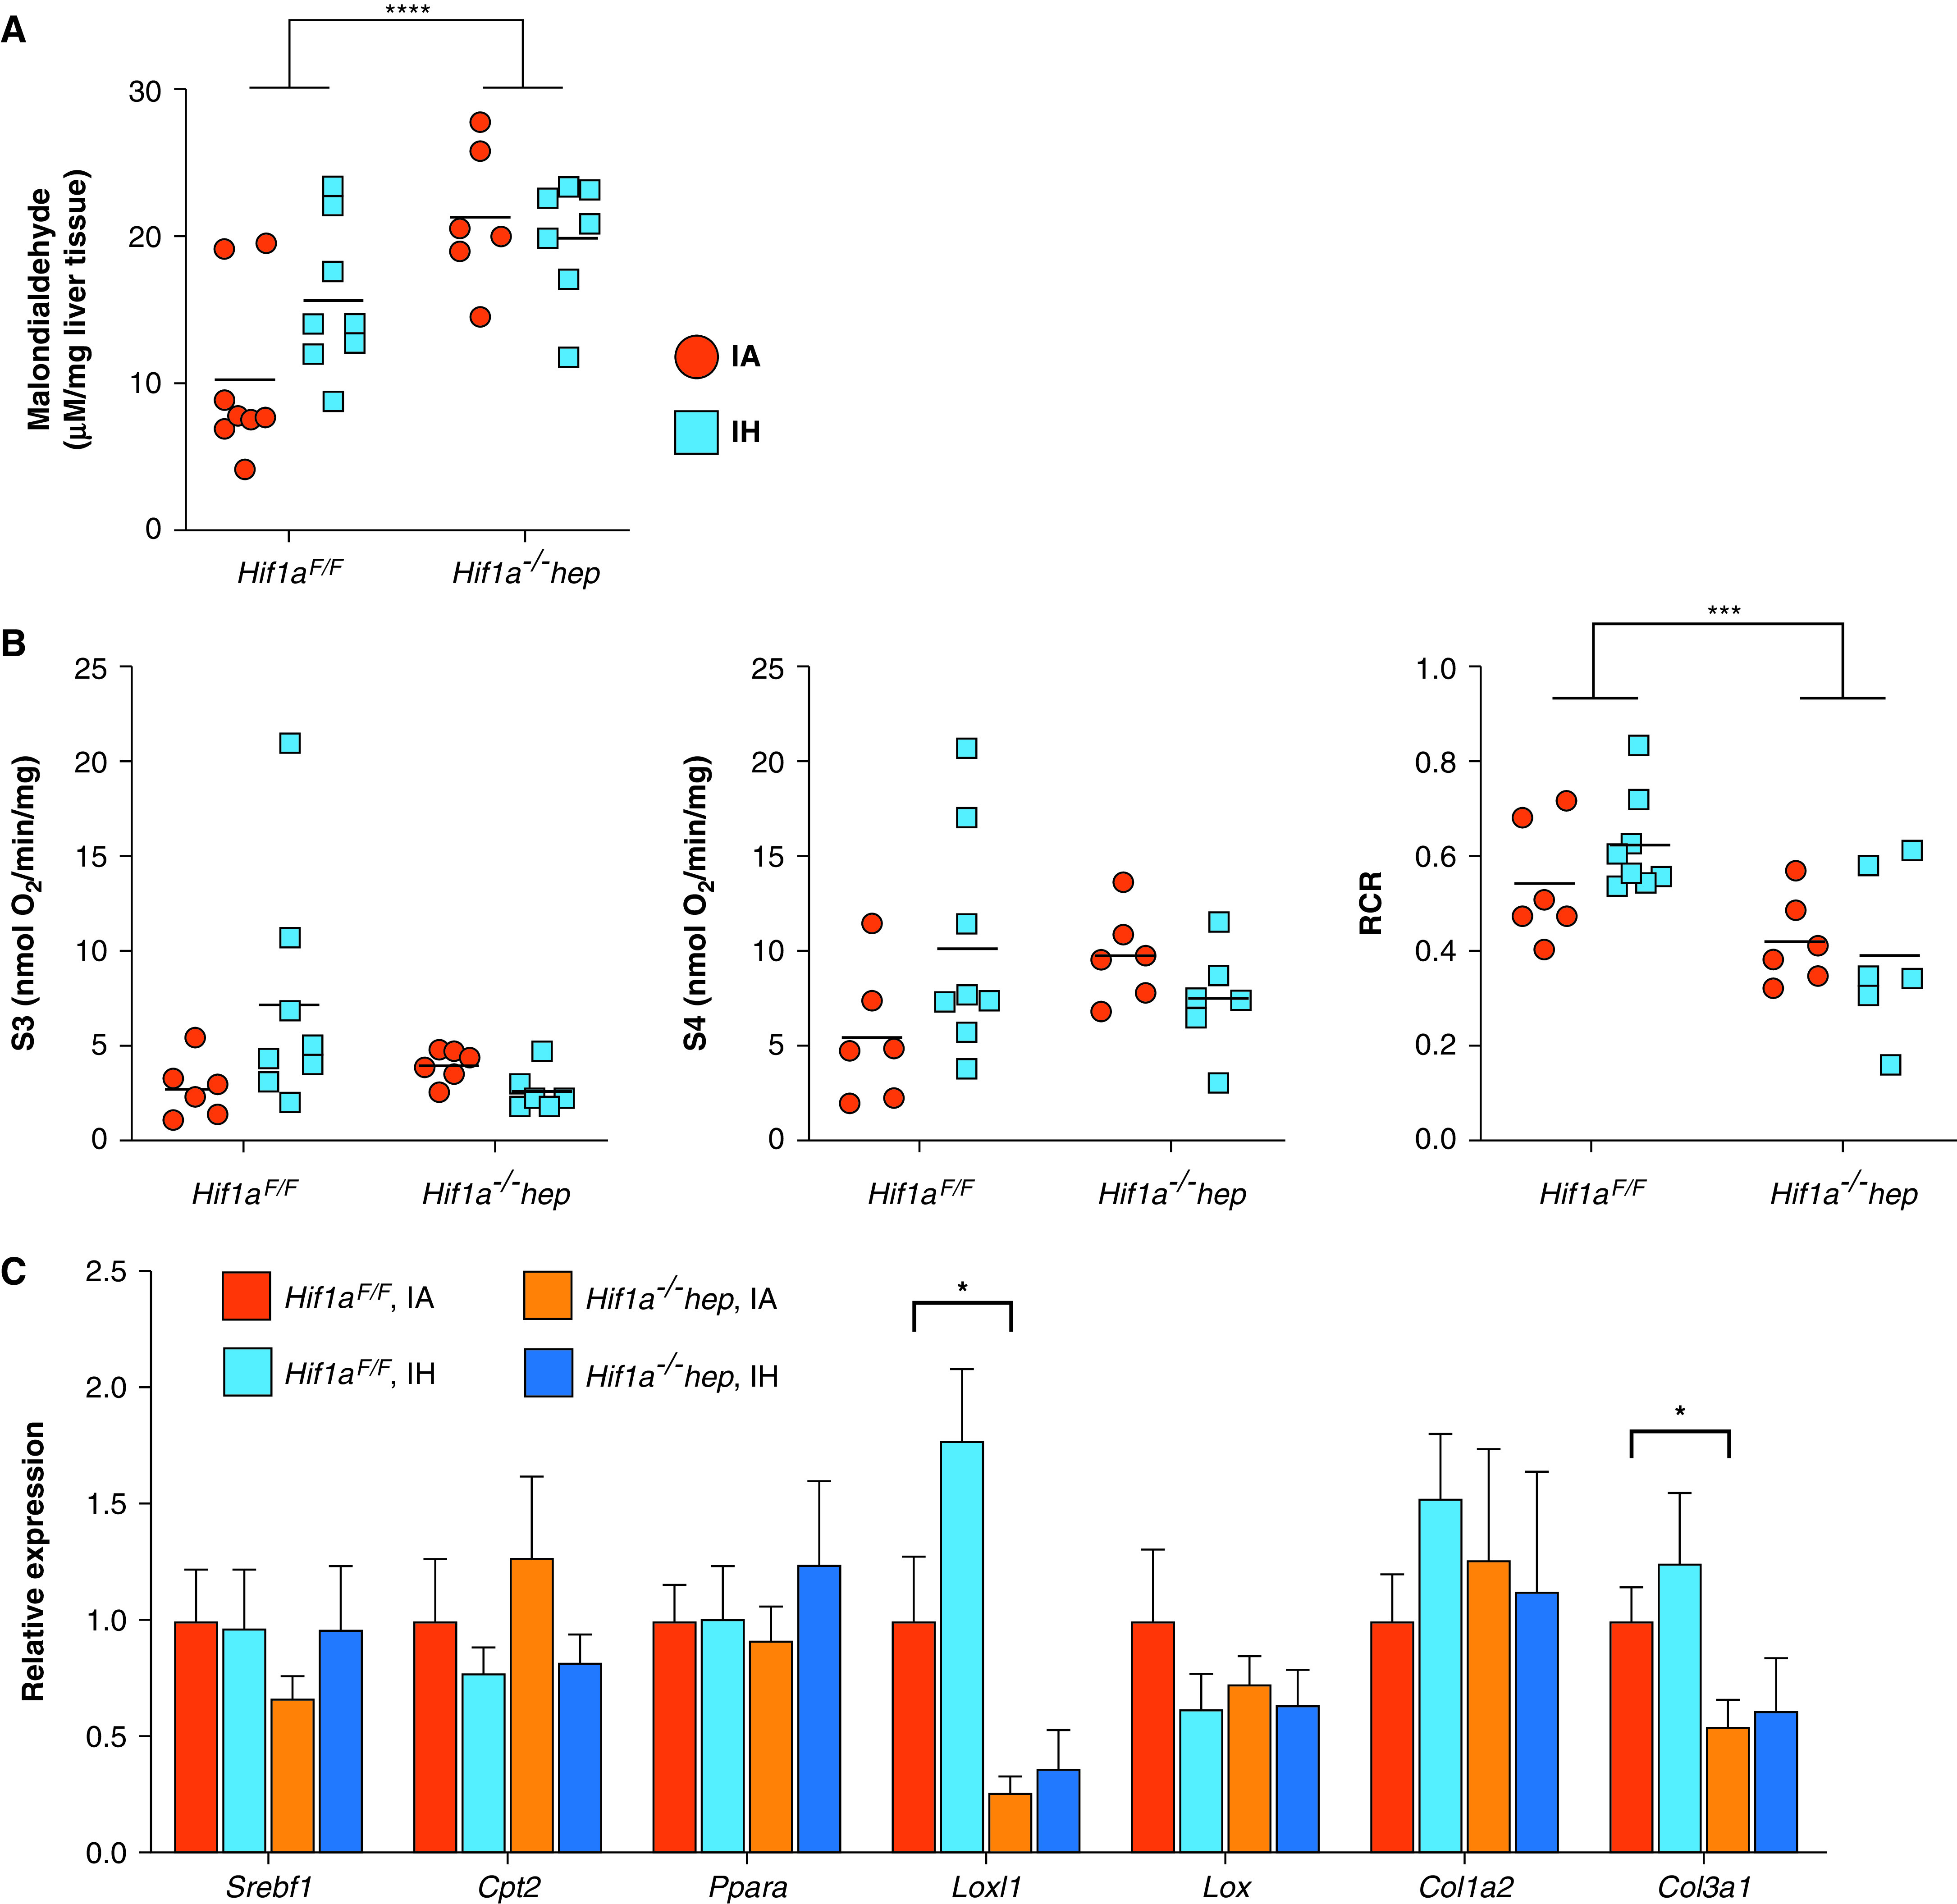
Effects of Hif1a−/−hep and IH on hepatic lipid peroxidation (malondialdehyde [MDA] content), hepatic mitochondrial efficiency, and expression of genes relevant to liver fibrosis and hepatic lipid metabolism. (A) MDA concentration in each experimental group. MDA was increased in Hif1a−/−hep mice (P < 0.001), but hypoxia exposure had no effect of (P = 0.309). An interactive effect between the genotype and exposure did not reach significance (P = 0.080). (B) Mitochondrial efficiency as represented by the RCR (ratio between state III [S3] and state IV [S4] oxygen consumption), with O2 flux being shown in S3 and S4. Mitochondrial efficiency was lower in Hif1a−/−hep mice than in Hif1aF/F mice (P = 0.002). There was no effect from IH exposure (P = 0.613), and there were no genotype or exposure effects on raw O2 flux data in S3 and S4. ***P < 0.005 and ****P < 0.001 for two-way ANOVA in A and B. (C) RT-PCR results for select genes related to hepatic lipid metabolism (Srebf1, Cpt2, and Ppara) and collagen synthesis (Loxl1, Lox, Col1a2, and Col3a1) (n = 6/group). *P < 0.05 for two-tailed unpaired t test comparison with Hif1aF/F IA group. In the IA group, Hif1a−/−hep mice showed reductions in Loxl1 and Col3a1 expression compared with Hif1aF/F mice, but no significant effect of IH was observed in any gene. RCR = respiratory control ratio.
Table 3.
Proinflammatory Cytokine Levels in Homogenized Liver Tissue, Normalized to Liver Tissue Weight, at the Time of Death
|
Hif1aF/F |
Hif1a−/−hep |
P | |||
|---|---|---|---|---|---|
| IA (n = 8) | IH (n = 8) | IA (n = 6) | IH (n = 7) | ||
| TNF-α, pg/mg | 33.5 ± 4.8 | 47.9 ± 2.3 | 9.7 ± 0.7 | 20.4 ± 2.8 | <0.001 (exposure) |
| <0.001 (genotype) | |||||
| 0.510 (interaction) | |||||
| IL-1β, pg/mg | 61.0 ± 5.3 | 80.0 ± 4.6 | 24.7 ± 1.5 | 45.5 ± 5.3 | <0.001 (exposure) |
| <0.001 (genotype) | |||||
| 0.832 (interaction) | |||||
| IL-6, pg/ml | 51.0 ± 6.6 | 55.4 ± 8.5 | 36.0 ± 7.3 | 42.8 ± 6.0 | 0.447 (exposure) |
| 0.067 (genotype) | |||||
| 0.876 (interaction) | |||||
Effect of HIF-1α–Targeting ASOs
In a second and concurrent experiment, wild-type C57BL/6J mice were fed the same high–trans-fat diet as above to induce NASH. All mice were exposed to IH during the final 6 weeks of the experiment. A third of the mice were injected with Hif1a-ASO, a third were injected with a Scr-ASO, and a final third were injected with saline. Representative H&E, Masson’s trichrome, and Sirius red stains are shown in Figure 5A. The mice injected with Hif1a-ASO demonstrated less HIF-1α protein as determined by using immunofluorescence, and HIF-1 targets assessed by using RT-PCR generally showed less expression (Figure 5B). There were no significant differences in body weights at the start of the experiment (Hif1a-ASO group, 23.5 ± 1.6 g; Scr-ASO group, 23.2 ± 1.4 g; saline group, 24.1 ± 1.1 g; P = 0.890 for one-way ANOVA), at the time of IH exposure (Hif1a-ASO group, 37.0 ± 2.8 g; Scr-ASO group, 36.7 ± 4.8 g; saline group, 37.0 ± 2.6 g; P = 0.998), or at the time of death (Hif1a-ASO group, 34.8 ± 2.0 g; Scr-ASO group, 34.0 ± 1.9 g; saline group, 33.7 ± 1.8 g; P = 0.923). There were no between-group differences in the GTT AUC (P = 0.689; Figure 5C). There was a trend toward a reduction in the liver collagen content in the Hif1a-ASO group (Hif1a-ASO group, 5.5 ± 1.0 μg/mg; Scr-ASO group, 8.8 ± 1.1 μg/mg; saline group, 8.5 ± 0.9 μg/mg; P = 0.088 for one-way ANOVA; individual values are shown in Figure 5D). Post hoc comparison of Hif1a-ASO mice with a combined Scr-ASO and saline group showed a significant reduction in the liver collagen content in the Hif1a-ASO group (P = 0.040).
Figure 5.
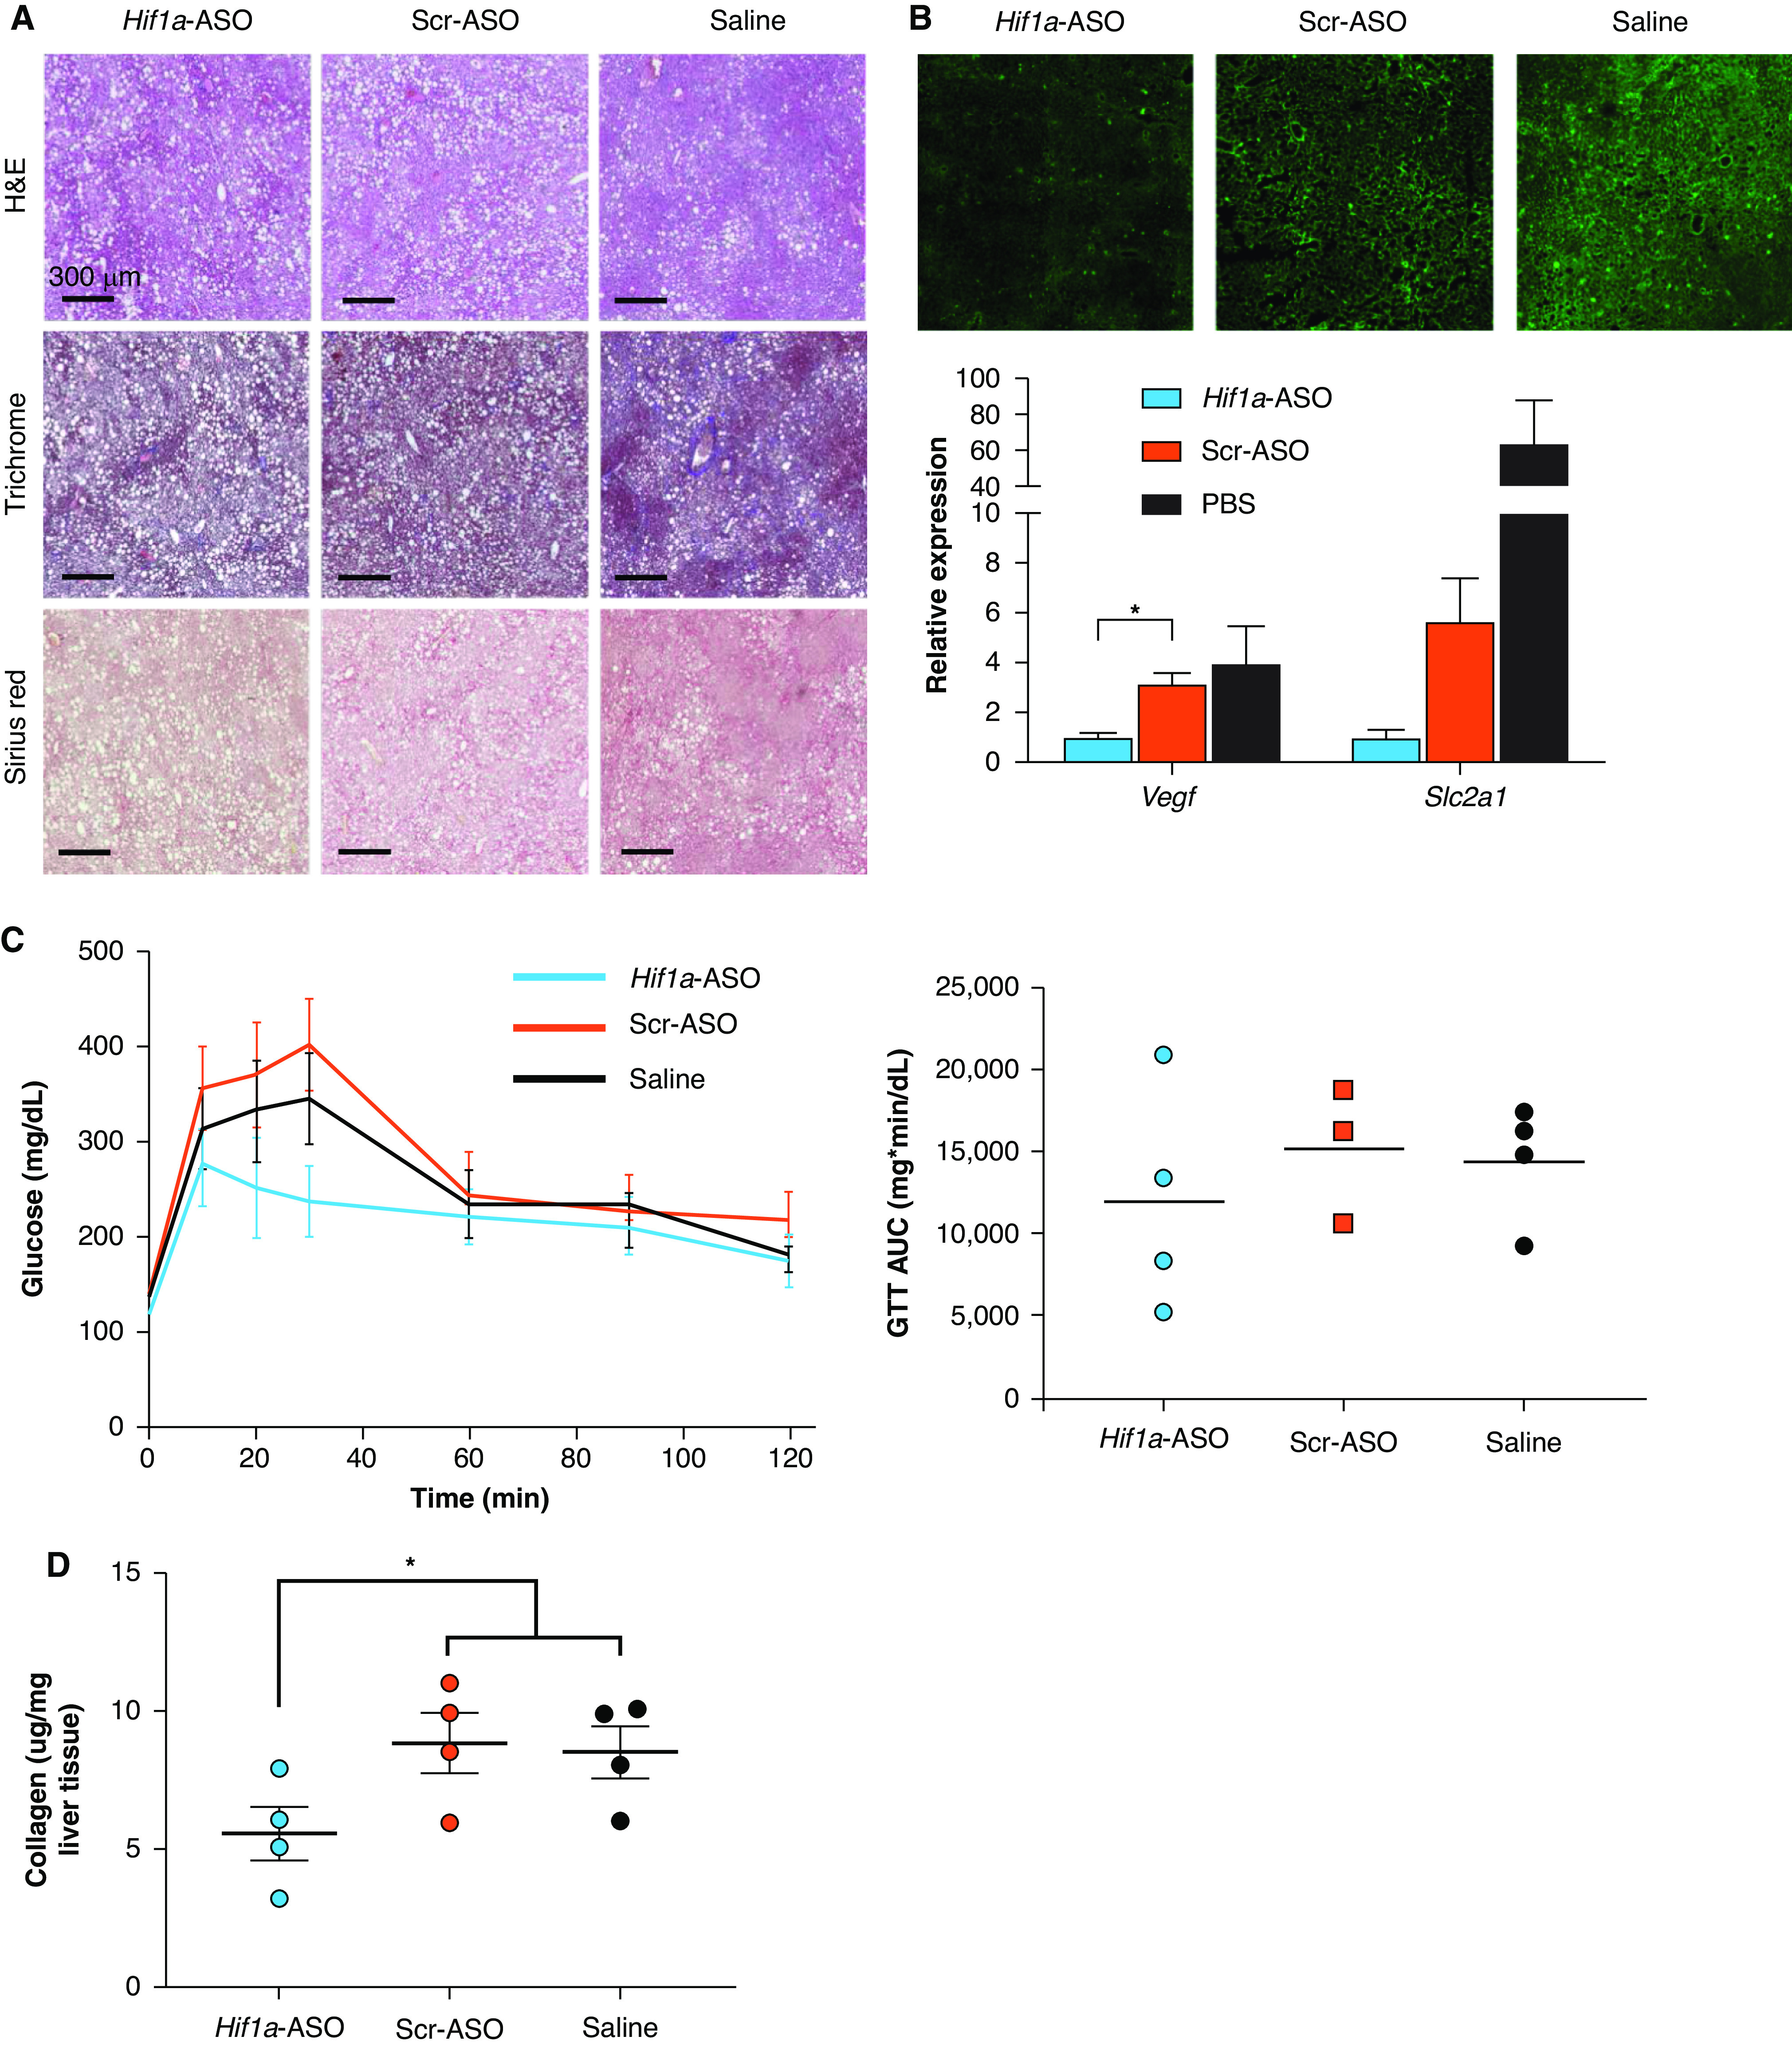
Effect of an antisense oligonucleotide (ASO) targeting HIF-1α (Hif1a-ASO) in mice on a high–trans-fat diet and exposed to IH. (A) Representative H&E, Masson’s trichrome, and Sirius red stains from all experimental groups. (B) Immunofluorescence results for HIF-1α protein from frozen sectioned liver tissue and RT-PCR results for Vegf expression (left) and Slc2a1 expression (right) in total liver tissue (n = 4/group). (C) In the GTT results, no significant between-group differences were observed. (D) Liver collagen content as per hydroxyproline assay results. There was a trend toward a reduction in liver collagen in the Hif1a-ASO group relative to the other groups. P = 0.088 for comparison made by using one-way ANOVA. *P < 0.05 for comparison between Hif1a-ASO mice and the Scr-ASO and saline groups combined (two-tailed unpaired t test). Scale bars, 300 μm. Scr-ASO = scrambled, noncoding ASO.
Discussion
These experiments were designed to determine the effects of IH, via HIF-1, on metabolic dysfunction and NAFLD progression. We found that hepatocyte HIF-1 mediates the development of metabolic dysfunction in this model, with Hif1a−/−hep mice having lower body weight, lower fasting glucose, improved glucose tolerance, and less epididymal fat compared with Hif1aF/F mice. We also found that liver fibrosis was reduced in Hif1a−/−hep mice. IH worsens liver fibrosis in this model as well, although we did not observe an interaction between IH and Hif1a−/−hep. These results are summarized in Figure 6. In addition, we discovered that there was a significant impact of Hif1a−/−hep in terms of reducing hepatic proinflammatory cytokines and reducing the hepatic expression of genes related to fibrosis (Loxl1 and Col3a1), and we found that IH increased the expression of proinflammatory cytokines. Finally, we have demonstrated that in vivo knockdown of HIF-1α by ASO is feasible and that there may be advantageous effects on liver fibrosis. Taken together, these results imply that hepatocyte HIF-1α is an important mediator of several key components of the NAFLD profile, including its progression to liver injury and fibrosis, and that IH worsens liver fibrosis. These effects may occur via alterations in liver inflammatory stress.
Figure 6.
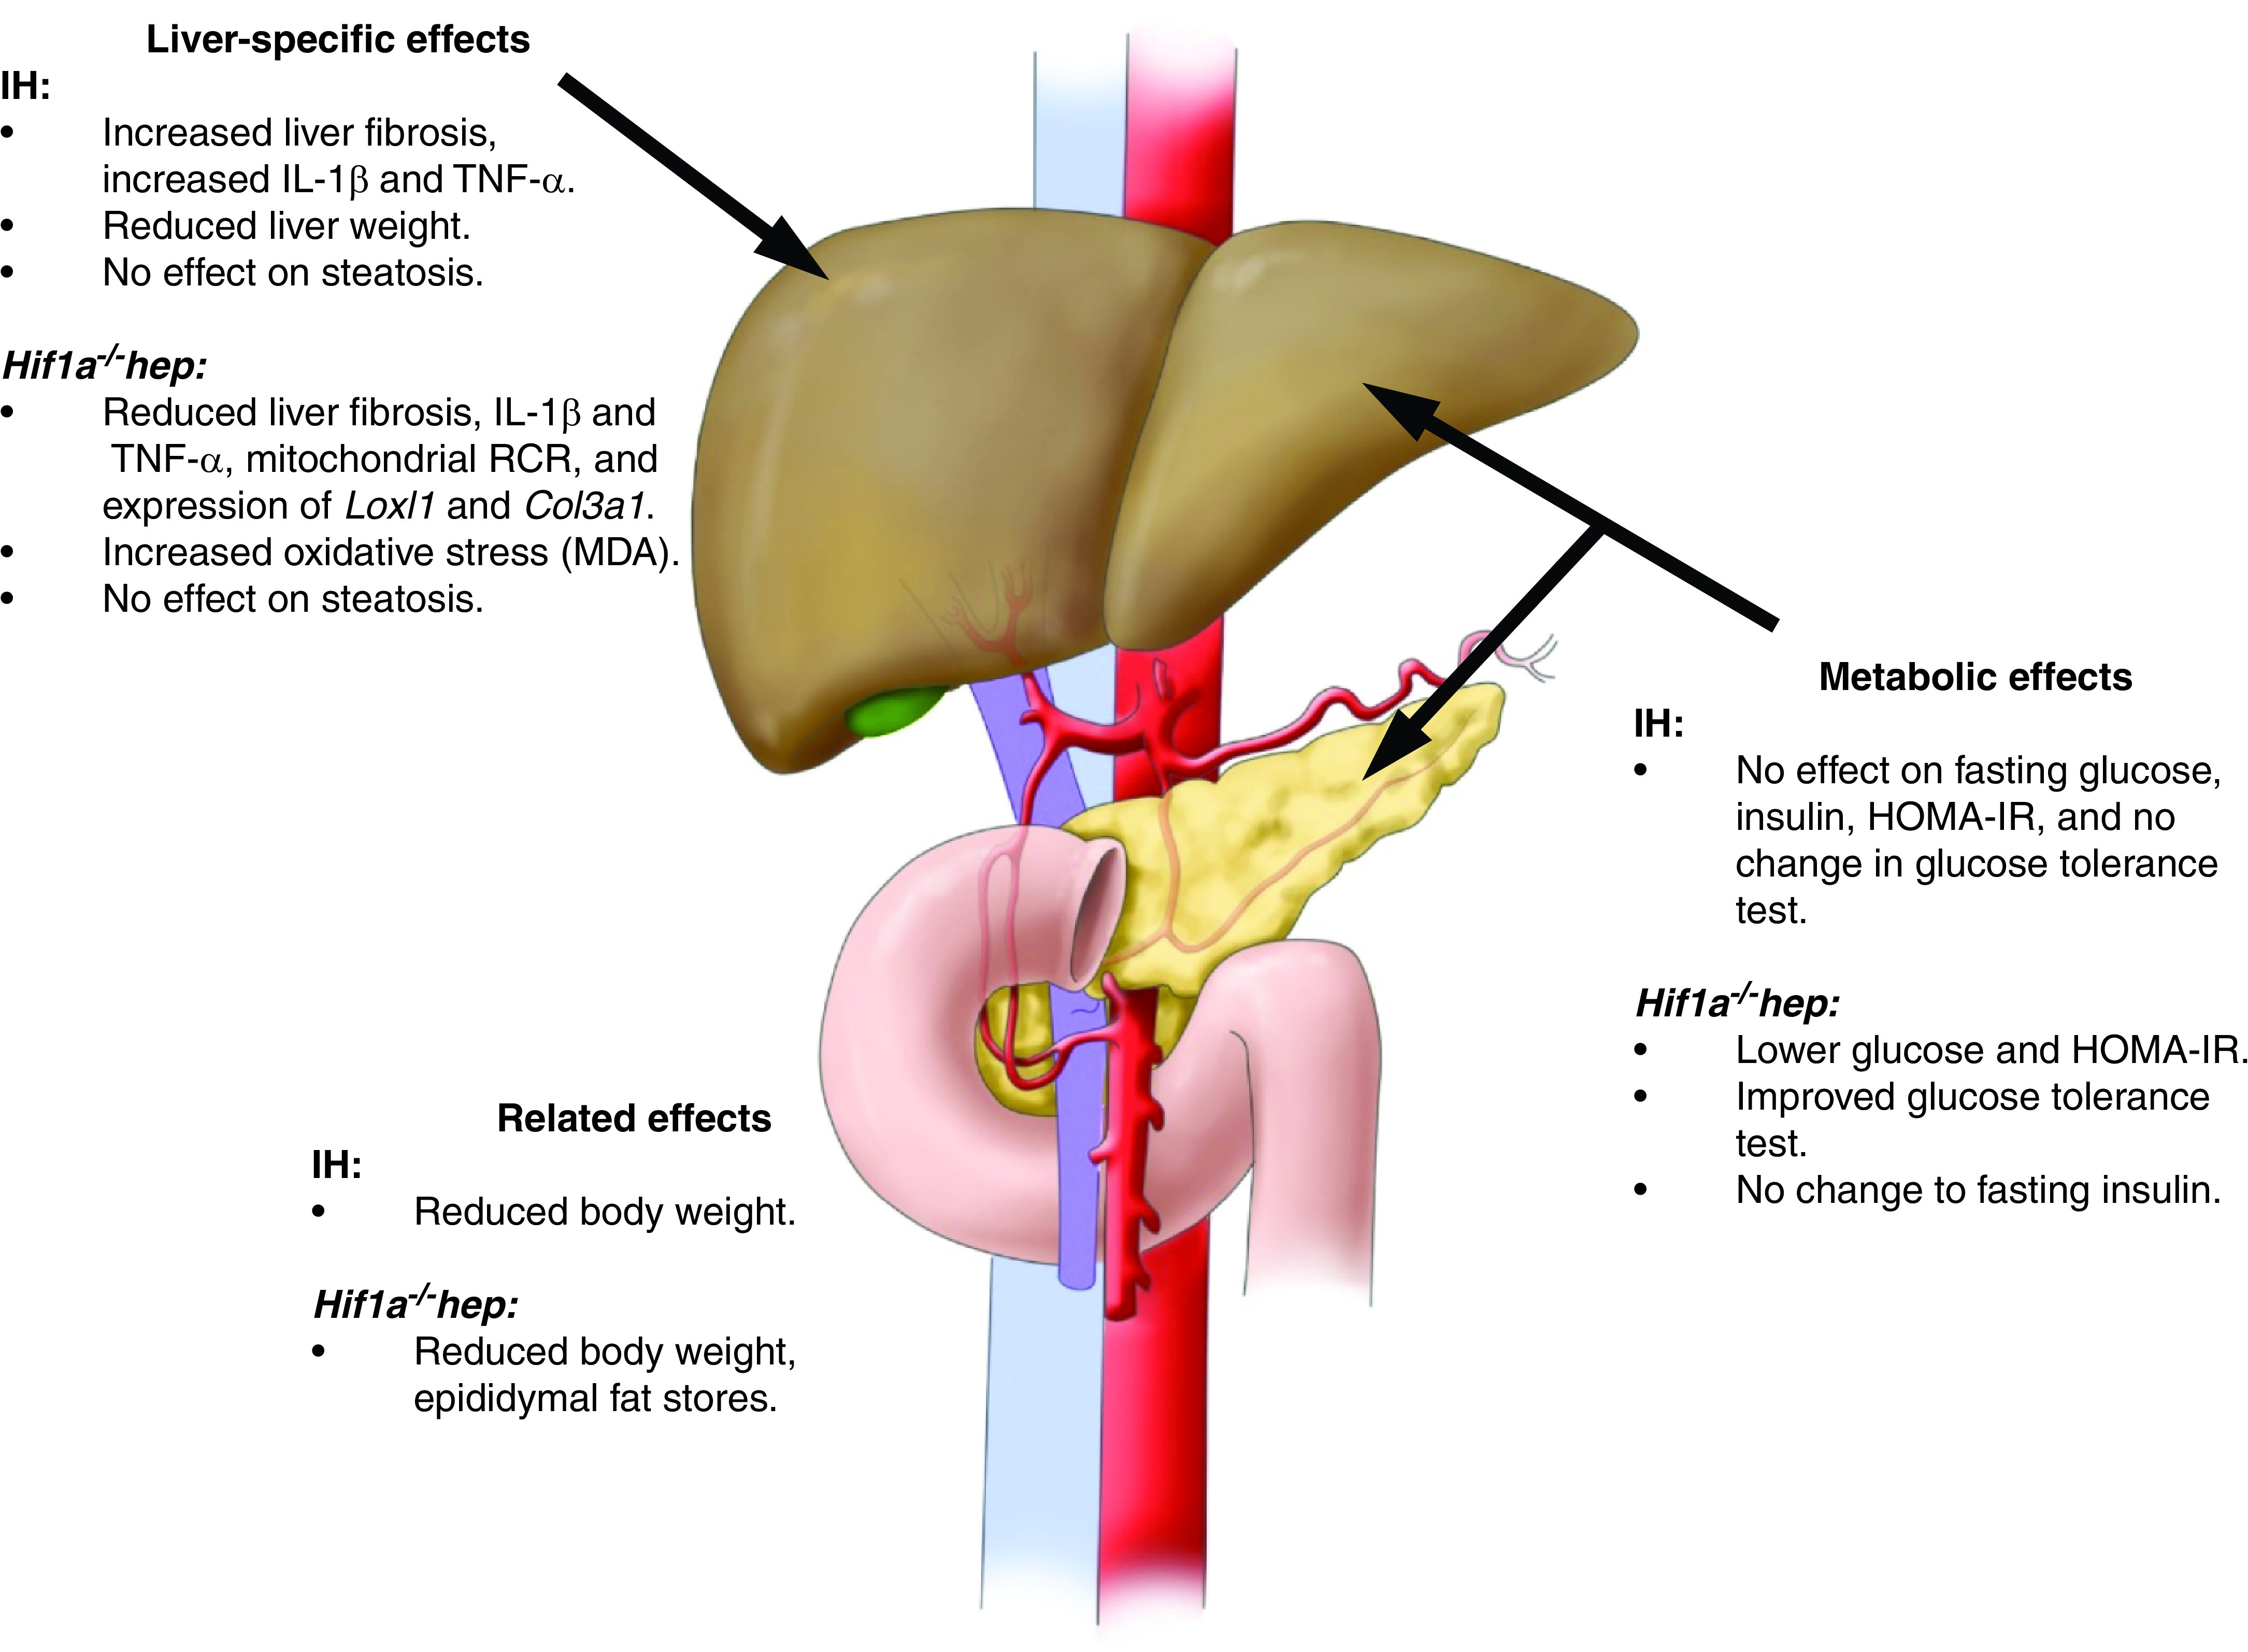
Summary of the major metabolic and liver-specific effects of Hif1a−/−hep and IH. IH had no major metabolic effects but reduced body weight and increased liver fibrosis and the expression of certain proinflammatory cytokines in the liver. The Hif1a−/−hep genotype was associated with lower fasting glucose, a lower HOMA-IR index, and improved glucose tolerance. In the liver, Hif1a−/−hep mice had less fibrosis, lower proinflammatory cytokine levels, reduced expression of certain genes of collagen synthesis or cross-linking, and increased levels of MDA. Neither IH nor the Hif1a−/−hep genotype impacted liver steatosis. Adapted from Reference 14.
HIFs and NAFLD
Several reports have identified a putative link between HIFs (HIF-1 and HIF-2) and NAFLD development and progression (20). HIFs act as transcription factors to initiate a cascade of effects relevant to the cellular response to hypoxia (21, 22). Both HIF-1 and HIF-2 have been implicated in dysregulation of lipid metabolism leading to hepatic steatosis in NAFLD (23, 24). Moreover, similar links have been drawn between HIFs and liver fibrosis. Hypoxia increases hepatocyte HIF-1α in vitro, leading to increases in profibrotic mediators (25). We and others have noted that Hif1a−/−hep reduces liver fibrosis in vivo (16, 26). HIF-1 signaling in other cell types has been similarly implicated in liver fibrosis in NASH: mice on a methionine- and choline-deficient diet to induce NASH had enhanced macrophage HIF-1α activation, which thereby impaired autophagy and increased inflammation (27). HIF-2 has also been linked to liver fibrosis in various NAFLD models (23, 28). Thus, there are accumulating data demonstrating the importance of HIF pathways to NAFLD progression, but thus far, investigations into the potential link among IH, HIFs, and NAFLD have been scant. Our experiments attempted to address this gap.
Why Does the Effect of Hif1a−/−hep Seemingly Outweigh the Effect of IH?
Despite the relative lack of mechanistic data linking IH to NAFLD, many clinical studies have identified OSA, and particularly the hypoxic burden of OSA, as a risk factor for NAFLD development and progression (14). Our previous work showed that HIF-1 is a key modulator of NAFLD progression, and other studies have demonstrated that even a high-fat diet alone is enough to stabilize hepatic HIF-1α (29, 30), also suggesting a strong link between liver tissue hypoxia and NAFLD. Therefore, the question arises as to why the effect of Hif1a−/−hep seemed to exceed the effect of IH in NAFLD progression in this model. On the basis of our data and previous reports, IH increases hepatic HIF-1α (31), supporting the link between OSA and NAFLD via IH, causing HIF-1α activation. We offer several possible explanations for this observation:
-
1.
The duration of IH was relatively short. Although the genotype differences in this experiment were germline differences, IH exposure was of limited duration. We chose this experimental design because our preliminary studies suggested that IH exposure concurrent with the entire duration of a high–trans-fat diet did not result in experimental NASH or severe metabolic derangement and prevented weight gain. This observation is perhaps unsurprising; IH has been shown previously to prevent weight gain in mice with diet-induced obesity (32). Perhaps a longer exposure to IH would elicit more profound effects on NAFLD characteristics.
-
2.
The IH effect of reducing body weight might have countered any harmful effects. Given the observation that IH prevents weight gain and/or enhances weight loss in obese mouse models, perhaps any putatively deleterious metabolic effects of IH are abrogated by a beneficial effect of IH on obesity. Weight reduction has been shown to improve NAFLD severity in humans and in murine models (33, 34). In light of this, one might therefore argue that IH is a poor model of human OSA, but we note that the relationship between weight and OSA is complex, with reports suggesting that OSA treatment is associated with weight gain (35). Moreover, metabolic derangement in experimental IH is typically worse in mice with diet-induced obesity than in lean mice (32), despite the effect of IH on weight. It is also worth noting that OSA often develops in individuals who already have obesity. Nonetheless, in our experimental design, it is conceivable that IH may have induced some benefit to NAFLD severity by virtue of weight reduction.
-
3.
The timing of using IH to induce HIF-1 activation is complex. It is also plausible that transient HIF-1 activation has durable effects on metabolism, further complicating the experimental design. For instance, mice on a high-fat diet have increased hepatic expression of HIF-1α protein, but this effect wanes over the course of months (30). However, our experiments have shown that Hif1a−/−hep may result in long-term changes to the liver (16). Ongoing experiments will attempt to address this further to delineate the effects of a “time course” of IH, both on HIF-1α expression and on phenotype changes relevant to NAFLD, in mice on a similar diet.
Unanswered Questions about the Interaction between IH and HIF-1
There are several interesting findings from these experiments. For example, HIF-1α in our model appears to impact weight gain, but there also exists a HIF-1–independent effect of IH on weight loss, suggesting that there likely is not a simple linear relationship among hypoxia, HIF-1, and metabolic dysregulation or NAFLD. This is made more puzzling by the observation that IH robustly increased hepatic HIF-1α levels and increased HIF-1 target gene expression. We hypothesize that there might be a threshold effect that is relevant to the observed effects of hepatocyte HIF-1α: having some of it in severe obesity and NAFLD increases liver fibrosis and dysglycemia and induces weight gain; having more of it does not really worsen these effects. We also suggest that the observed effects in such experiments are likely to be intimately dependent on the specifics of the OSA and NAFLD models used. Notably, in our experiment, IH did not impact fasting glucose, insulin resistance, lipid metabolism, hepatic oxidative stress, or other metabolic markers that have clearly been shown to be impacted by a similar IH regimen in previous reports (36–38), despite effects on hepatic inflammatory cytokine levels being demonstrated. We hypothesize that this may be due to a “ceiling effect,” but further investigation is needed to define these relationships. We also note that the lack of an interactive effect of IH and the HIF-1α status in liver fibrosis may simply be due to a small sample size, but there may in addition be multifaceted responses to IH, some of which are HIF-1 independent (e.g., via HIF-2). Finally, the lack of an interactive effect can potentially be explained by the modest IH effect, which is discussed above. Clearly, these interactions are complex and merit further mechanistic inquiry.
What Mechanisms Explain the Effects of HIF-1 and IH on NAFLD Severity?
In examining the potential mechanisms explaining our findings, there are again some surprising outcomes that are relevant. First, mitochondrial efficiency (here gauged by the RCR) was reduced in liver tissue in Hif1a−/−hep, despite an overall improved metabolic and NASH profile. This seems puzzling, as mitochondrial dysfunction has been mechanistically linked to NASH progression in several studies, both in humans and in rodent models (39, 40). However, we view our findings as being consistent with the idea that HIF-1 serves in a role of optimizing mitochondrial efficiency, as noted by Semenza and colleagues (41), and suggest that at least in this model system, HIF-1 does not impact liver fibrosis or other outcomes through mitochondrial inefficiency. Second, oxidative stress was actually higher in Hif1a−/−hep mice, although hepatic oxidative stress is also thought to be important in NAFLD progression (42). Some studies have demonstrated the protective effect of HIF-1 against oxidative stress in a variety of scenarios (43, 44), and again, our findings are likely to be model specific. Finally, we did show changes in hepatic levels of IL-1β and TNF-α in both Hif1a−/−hep and IH-exposed mice, suggesting that HIF-1 and IH may impart changes to liver fibrosis in NASH through hepatic inflammation. In light of these findings, the opposing directions of oxidative stress and hepatic inflammation are also unexpected, particularly because many proinflammatory signals use reactive oxygen species as part of their signaling cascade. We surmise that in a complex disease like NAFLD, in which oxidative stress and inflammation may be activated at different time points, superimposing IH on the system probably leads to variable responses that may fluctuate over time. Imposing IH at an earlier time point may have demonstrated different changes to oxidative stress markers and proinflammatory cytokines, consistent with some experimental findings (45, 46). In addition, genes relevant to collagen synthesis, including Loxl1 (which participates in collagen cross-linking, an important step in liver fibrosis, which we have previously shown to be impacted by HIF-1α in a NAFLD model [16]) and Col3a1 (the gene encoding a subtype of collagen found in liver fibrosis) were expressed less in Hif1a−/−hep mice. These findings may help explain the effect of HIF-1α on liver fibrosis, although the direct relationship with proinflammatory cytokines, if any, deserves further investigation, such as with pharmacologic manipulation.
Strengths and Limitations of This Study
There are strengths and important limitations to this study. We have used models of severe OSA and NAFLD that are realistic: we induced NAFLD and NASH by way of diet alone without the use of particular dietary deficiencies (e.g., a methionine- and choline-deficient diet). We have therefore avoided the chemical exposure or genetic modification on which other NAFLD models rely. Moreover, we have used an IH regimen that has been extensively investigated in previous studies (5, 47) and that is associated with oxyhemoglobin saturations similar to what one would experience in severe OSA. In addition, we have extensively phenotyped the mice in this experiment and are therefore able to provide mechanistic data relevant to the observed findings. However, the phenotypes are largely a single snapshot at the end of a long experiment, and further study would help to define the time course of the impact of Hif1a−/−hep or IH on our outcomes of interest. In addition, as noted above, the effect of different exposure times of IH has not been identified, although ongoing experiments by our group intend to address this. We also do not have a full understanding of the specific causes of weight fluctuation in mice exposed to IH or mice that have the Hif1a−/−hep genotype, and the relationship between this weight fluctuation and NAFLD severity is not clear. Activity, oxygen consumption, and other metabolic parameters could not be recorded because of the complexity of IH/IA exposure. Finally, although our ASO experiment gives useful information about the feasibility of this type of in vivo manipulation, the sample size was limited, and the experiment does not provide context about the interaction between IH and HIF-1α.
Conclusions
In summary, we report here the effects of IH and Hif1a−/−hep in a mouse model of NAFLD. Hif1a−/−hep mice had an improved metabolic profile, with less weight gain, lower fasting glucose, improved glucose handling, an improved HOMA-IR index, and less epididymal fat. Hif1a−/−hep mice also had less liver fibrosis, and IH worsened liver fibrosis in this model, albeit with a small effect size. There were no other significant metabolic effects of IH. IH and hepatocyte HIF-1α each increased hepatic proinflammatory cytokine levels, and Hif1a−/−hep reduced expression of important fibrogenic genes. The use of Hif1a-ASOs injected intraperitoneally in a small group of mice was feasible and led to a trend toward the improvement of liver fibrosis. These results suggest a strong relationship between HIF-1 and NAFLD in which liver fibrosis is likely impacted by IH, potentially providing some mechanistic insight to substantiate the observed associative link between OSA and NAFLD severity. Further investigative study is needed to expand on these findings.
Acknowledgments
Acknowledgment
The authors thank A.S.M. for helpful discussions, L.C.W. for illustrations, and N.Y.M. for kind encouragement. David A. Brenner, M.D., and Frank L. Powell, Ph.D., provided thoughtful feedback.
Footnotes
Supported by grants from the American Thoracic Society Foundation (ATS-2017-19), the American Academy of Sleep Medicine Foundation (177-PA-17), the National Institutes of Health (National Heart, Lung, and Blood Institute grant K08HL143140), and the University of California San Diego (RS295R). Core facilities were accessed with a grant from the National Institutes of Health (National Institute of Neurological Disorders and Stroke grant NS047101).
Author Contributions: O.A.M.: study conception and design; acquisition, analysis, and interpretation of results; and main manuscript author. E.A.M., X.Z., M.G., H.Z., P.W.G., M.A., and E.C.B.: data acquisition and analysis of results. K.E.M.: statistical analysis. A.M.: Conception and study design.
Originally Published in Press as DOI: 10.1165/rcmb.2020-0492OC on May 18, 2021
Author disclosures are available with the text of this article at www.atsjournals.org.
References
- 1. Senaratna CV, Perret JL, Lodge CJ, Lowe AJ, Campbell BE, Matheson MC. et al. Prevalence of obstructive sleep apnea in the general population: a systematic review. Sleep Med Rev. 2017;34:70–81. doi: 10.1016/j.smrv.2016.07.002. [DOI] [PubMed] [Google Scholar]
- 2. Pham LV, Schwartz AR. The pathogenesis of obstructive sleep apnea. J Thorac Dis. 2015;7:1358–1372. doi: 10.3978/j.issn.2072-1439.2015.07.28. [DOI] [PMC free article] [PubMed] [Google Scholar]
- 3. Reinke C, Bevans-Fonti S, Drager LF, Shin M-K, Polotsky VY. Effects of different acute hypoxic regimens on tissue oxygen profiles and metabolic outcomes. J Appl Physiol (1985) 2011;111:881–890. doi: 10.1152/japplphysiol.00492.2011. [DOI] [PMC free article] [PubMed] [Google Scholar]
- 4. He Q, Yang QC, Zhou Q, Zhu H, Niu WY, Feng J. et al. Effects of varying degrees of intermittent hypoxia on proinflammatory cytokines and adipokines in rats and 3T3-L1 adipocytes. PLoS One. 2014;9:e86326. doi: 10.1371/journal.pone.0086326. [DOI] [PMC free article] [PubMed] [Google Scholar]
- 5. Savransky V, Nanayakkara A, Li J, Bevans S, Smith PL, Rodriguez A. et al. Chronic intermittent hypoxia induces atherosclerosis. Am J Respir Crit Care Med. 2007;175:1290–1297. doi: 10.1164/rccm.200612-1771OC. [DOI] [PMC free article] [PubMed] [Google Scholar]
- 6. Mesarwi OA, Sharma EV, Jun JC, Polotsky VY. Metabolic dysfunction in obstructive sleep apnea: A critical examination of underlying mechanisms. Sleep Biol Rhythms. 2015;13:2–17. doi: 10.1111/sbr.12078. [DOI] [PMC free article] [PubMed] [Google Scholar]
- 7. Shahar E, Whitney CW, Redline S, Lee ET, Newman AB, Nieto FJ. et al. Sleep-disordered breathing and cardiovascular disease: cross-sectional results of the Sleep Heart Health Study. Am J Respir Crit Care Med. 2001;163:19–25. doi: 10.1164/ajrccm.163.1.2001008. [DOI] [PubMed] [Google Scholar]
- 8. Javaheri S, Barbe F, Campos-Rodriguez F, Dempsey JA, Khayat R, Javaheri S. et al. Sleep apnea: types, mechanisms, and clinical cardiovascular consequences. J Am Coll Cardiol. 2017;69:841–858. doi: 10.1016/j.jacc.2016.11.069. [DOI] [PMC free article] [PubMed] [Google Scholar]
- 9. Martínez-Cerón E, Barquiel B, Bezos A-M, Casitas R, Galera R, García-Benito C. et al. Effect of continuous positive airway pressure on glycemic control in patients with obstructive sleep apnea and type 2 diabetes: a randomized clinical trial. Am J Respir Crit Care Med. 2016;194:476–485. doi: 10.1164/rccm.201510-1942OC. [DOI] [PubMed] [Google Scholar]
- 10. Ip MSM, Lam B, Ng MMT, Lam WK, Tsang KWT, Lam KSL. Obstructive sleep apnea is independently associated with insulin resistance. Am J Respir Crit Care Med. 2002;165:670–676. doi: 10.1164/ajrccm.165.5.2103001. [DOI] [PubMed] [Google Scholar]
- 11. Kim CH, Younossi ZM. Nonalcoholic fatty liver disease: a manifestation of the metabolic syndrome. Cleve Clin J Med. 2008;75:721–728. doi: 10.3949/ccjm.75.10.721. [DOI] [PubMed] [Google Scholar]
- 12. Rinella ME. Nonalcoholic fatty liver disease: a systematic review. JAMA. 2015;313:2263–2273. doi: 10.1001/jama.2015.5370. [DOI] [PubMed] [Google Scholar]
- 13. McCullough AJ. The clinical features, diagnosis and natural history of nonalcoholic fatty liver disease. Clin Liver Dis. 2004;8:521–533, viii. doi: 10.1016/j.cld.2004.04.004. [DOI] [PubMed] [Google Scholar]
- 14. Mesarwi OA, Loomba R, Malhotra A. Obstructive sleep apnea, hypoxia, and nonalcoholic fatty liver disease. Am J Respir Crit Care Med. 2019;199:830–841. doi: 10.1164/rccm.201806-1109TR. [DOI] [PMC free article] [PubMed] [Google Scholar]
- 15. Clapper JR, Hendricks MD, Gu G, Wittmer C, Dolman CS, Herich J. et al. Diet-induced mouse model of fatty liver disease and nonalcoholic steatohepatitis reflecting clinical disease progression and methods of assessment. Am J Physiol Gastrointest Liver Physiol. 2013;305:G483–G495. doi: 10.1152/ajpgi.00079.2013. [DOI] [PubMed] [Google Scholar]
- 16. Mesarwi OA, Shin M-K, Bevans-Fonti S, Schlesinger C, Shaw J, Polotsky VY. Hepatocyte hypoxia inducible factor-1 mediates the development of liver fibrosis in a mouse model of nonalcoholic fatty liver disease. PLoS One. 2016;11:e0168572. doi: 10.1371/journal.pone.0168572. [DOI] [PMC free article] [PubMed] [Google Scholar]
- 17. Shin M-K, Drager LF, Yao Q, Bevans-Fonti S, Yoo D-Y, Jun JC. et al. Metabolic consequences of high-fat diet are attenuated by suppression of HIF-1α. PLoS One. 2012;7:e46562. doi: 10.1371/journal.pone.0046562. [DOI] [PMC free article] [PubMed] [Google Scholar]
- 18. Neuman RE, Logan MA. The determination of hydroxyproline. J Biol Chem. 1950;184:299–306. [PubMed] [Google Scholar]
- 19. Ioja S, Singamsetty S, Corey C, Guo L, Shah F, Jurczak MJ. et al. Nocturnal hypoxia improves glucose disposal, decreases mitochondrial efficiency, and increases reactive oxygen species in the muscle and liver of C57BL/6J mice independent of weight change. Oxid Med Cell Longev. 2018;2018:9649608. doi: 10.1155/2018/9649608. [DOI] [PMC free article] [PubMed] [Google Scholar]
- 20. Musso G, Olivetti C, Cassader M, Gambino R. Obstructive sleep apnea-hypopnea syndrome and nonalcoholic fatty liver disease: emerging evidence and mechanisms. Semin Liver Dis. 2012;32:49–64. doi: 10.1055/s-0032-1306426. [DOI] [PubMed] [Google Scholar]
- 21. Semenza GL. Regulation of physiological responses to continuous and intermittent hypoxia by hypoxia-inducible factor 1. Exp Physiol. 2006;91:803–806. doi: 10.1113/expphysiol.2006.033498. [DOI] [PubMed] [Google Scholar]
- 22. Jaakkola P, Mole DR, Tian YM, Wilson MI, Gielbert J, Gaskell SJ. et al. Targeting of HIF-α to the von Hippel-Lindau ubiquitylation complex by O2-regulated prolyl hydroxylation. Science. 2001;292:468–472. doi: 10.1126/science.1059796. [DOI] [PubMed] [Google Scholar]
- 23. Morello E, Sutti S, Foglia B, Novo E, Cannito S, Bocca C. et al. Hypoxia-inducible factor 2α drives nonalcoholic fatty liver progression by triggering hepatocyte release of histidine-rich glycoprotein. Hepatology. 2018;67:2196–2214. doi: 10.1002/hep.29754. [DOI] [PubMed] [Google Scholar]
- 24. Tirosh O. Hypoxic signaling and cholesterol lipotoxicity in fatty liver disease progression. Oxid Med Cell Longev. 2018;2018:2548154. doi: 10.1155/2018/2548154. [DOI] [PMC free article] [PubMed] [Google Scholar]
- 25. Copple BL, Bustamante JJ, Welch TP, Kim ND, Moon J-O. Hypoxia-inducible factor-dependent production of profibrotic mediators by hypoxic hepatocytes. Liver Int. 2009;29:1010–1021. doi: 10.1111/j.1478-3231.2009.02015.x. [DOI] [PMC free article] [PubMed] [Google Scholar]
- 26. Han J, He Y, Zhao H, Xu X. Hypoxia inducible factor-1 promotes liver fibrosis in nonalcoholic fatty liver disease by activating PTEN/p65 signaling pathway. J Cell Biochem. 2019;120:14735–14744. doi: 10.1002/jcb.28734. [DOI] [PubMed] [Google Scholar]
- 27. Wang X, de Carvalho Ribeiro M, Iracheta-Vellve A, Lowe P, Ambade A, Satishchandran A. et al. Macrophage-specific hypoxia-inducible factor-1α contributes to impaired autophagic flux in nonalcoholic steatohepatitis. Hepatology. 2019;69:545–563. doi: 10.1002/hep.30215. [DOI] [PMC free article] [PubMed] [Google Scholar]
- 28. Qu A, Taylor M, Xue X, Matsubara T, Metzger D, Chambon P. et al. Hypoxia-inducible transcription factor 2α promotes steatohepatitis through augmenting lipid accumulation, inflammation, and fibrosis. Hepatology. 2011;54:472–483. doi: 10.1002/hep.24400. [DOI] [PMC free article] [PubMed] [Google Scholar]
- 29. Carabelli J, Burgueño AL, Rosselli MS, Gianotti TF, Lago NR, Pirola CJ. et al. High fat diet-induced liver steatosis promotes an increase in liver mitochondrial biogenesis in response to hypoxia. J Cell Mol Med. 2011;15:1329–1338. doi: 10.1111/j.1582-4934.2010.01128.x. [DOI] [PMC free article] [PubMed] [Google Scholar]
- 30. Ochiai D, Goda N, Hishiki T, Kanai M, Senoo-Matsuda N, Soga T. et al. Disruption of HIF-1α in hepatocytes impairs glucose metabolism in diet-induced obesity mice. Biochem Biophys Res Commun. 2011;415:445–449. doi: 10.1016/j.bbrc.2011.10.089. [DOI] [PMC free article] [PubMed] [Google Scholar]
- 31. Suzuki T, Shinjo S, Arai T, Kanai M, Goda N. Hypoxia and fatty liver. World J Gastroenterol. 2014;20:15087–15097. doi: 10.3748/wjg.v20.i41.15087. [DOI] [PMC free article] [PubMed] [Google Scholar]
- 32. Drager LF, Li J, Reinke C, Bevans-Fonti S, Jun JC, Polotsky VY. Intermittent hypoxia exacerbates metabolic effects of diet-induced obesity. Obesity (Silver Spring) 2011;19:2167–2174. doi: 10.1038/oby.2011.240. [DOI] [PMC free article] [PubMed] [Google Scholar]
- 33. Marques CMM, Motta VF, Torres TS, Aguila MB, Mandarim-de-Lacerda CA. Beneficial effects of exercise training (treadmill) on insulin resistance and nonalcoholic fatty liver disease in high-fat fed C57BL/6 mice. Braz J Med Biol Res. 2010;43:467–475. doi: 10.1590/s0100-879x2010007500030. [DOI] [PubMed] [Google Scholar]
- 34. Romero-Gómez M, Zelber-Sagi S, Trenell M. Treatment of NAFLD with diet, physical activity and exercise. J Hepatol. 2017;67:829–846. doi: 10.1016/j.jhep.2017.05.016. [DOI] [PubMed] [Google Scholar]
- 35. Drager LF, Brunoni AR, Jenner R, Lorenzi-Filho G, Benseñor IM, Lotufo PA. Effects of CPAP on body weight in patients with obstructive sleep apnoea: a meta-analysis of randomised trials. Thorax. 2015;70:258–264. doi: 10.1136/thoraxjnl-2014-205361. [DOI] [PubMed] [Google Scholar]
- 36. Jun J, Savransky V, Nanayakkara A, Bevans S, Li J, Smith PL. et al. Intermittent hypoxia has organ-specific effects on oxidative stress. Am J Physiol Regul Integr Comp Physiol. 2008;295:R1274–R1281. doi: 10.1152/ajpregu.90346.2008. [DOI] [PMC free article] [PubMed] [Google Scholar]
- 37. Polotsky VY, Li J, Punjabi NM, Rubin AE, Smith PL, Schwartz AR. et al. Intermittent hypoxia increases insulin resistance in genetically obese mice. J Physiol. 2003;552:253–264. doi: 10.1113/jphysiol.2003.048173. [DOI] [PMC free article] [PubMed] [Google Scholar]
- 38. Li J, Thorne LN, Punjabi NM, Sun CK, Schwartz AR, Smith PL. et al. Intermittent hypoxia induces hyperlipidemia in lean mice. Circ Res. 2005;97:698–706. doi: 10.1161/01.RES.0000183879.60089.a9. [DOI] [PubMed] [Google Scholar]
- 39. Mantena SK, Vaughn DP, Andringa KK, Eccleston HB, King AL, Abrams GA. et al. High fat diet induces dysregulation of hepatic oxygen gradients and mitochondrial function in vivo. Biochem J. 2009;417:183–193. doi: 10.1042/BJ20080868. [DOI] [PMC free article] [PubMed] [Google Scholar]
- 40. Koliaki C, Szendroedi J, Kaul K, Jelenik T, Nowotny P, Jankowiak F. et al. Adaptation of hepatic mitochondrial function in humans with non-alcoholic fatty liver is lost in steatohepatitis. Cell Metab. 2015;21:739–746. doi: 10.1016/j.cmet.2015.04.004. [DOI] [PubMed] [Google Scholar]
- 41. Semenza GL. Oxygen-dependent regulation of mitochondrial respiration by hypoxia-inducible factor 1. Biochem J. 2007;405:1–9. doi: 10.1042/BJ20070389. [DOI] [PubMed] [Google Scholar]
- 42. Masarone M, Rosato V, Dallio M, Gravina AG, Aglitti A, Loguercio C. et al. Role of oxidative stress in pathophysiology of nonalcoholic fatty liver disease. Oxid Med Cell Longev. 2018;2018:9547613. doi: 10.1155/2018/9547613. [DOI] [PMC free article] [PubMed] [Google Scholar]
- 43. Zhao T, Zhu Y, Morinibu A, Kobayashi M, Shinomiya K, Itasaka S. et al. HIF-1-mediated metabolic reprogramming reduces ROS levels and facilitates the metastatic colonization of cancers in lungs. Sci Rep. 2014;4:3793. doi: 10.1038/srep03793. [DOI] [PMC free article] [PubMed] [Google Scholar]
- 44. Li H-S, Zhou Y-N, Li L, Li S-F, Long D, Chen X-L. et al. HIF-1α protects against oxidative stress by directly targeting mitochondria. Redox Biol. 2019;25:101109. doi: 10.1016/j.redox.2019.101109. [DOI] [PMC free article] [PubMed] [Google Scholar]
- 45. Kumar A, Sharma A, Duseja A, Das A, Dhiman RK, Chawla YK. et al. Patients with nonalcoholic fatty liver disease (NAFLD) have higher oxidative stress in comparison to chronic viral hepatitis. J Clin Exp Hepatol. 2013;3:12–18. doi: 10.1016/j.jceh.2012.10.009. [DOI] [PMC free article] [PubMed] [Google Scholar]
- 46. Gangwar A, Paul S, Ahmad Y, Bhargava K. Intermittent hypoxia modulates redox homeostasis, lipid metabolism associated inflammatory processes and redox post-translational modifications: benefits at high altitude. Sci Rep. 2020;10:7899. doi: 10.1038/s41598-020-64848-x. [DOI] [PMC free article] [PubMed] [Google Scholar]
- 47. Savransky V, Nanayakkara A, Vivero A, Li J, Bevans S, Smith PL. et al. Chronic intermittent hypoxia predisposes to liver injury. Hepatology. 2007;45:1007–1013. doi: 10.1002/hep.21593. [DOI] [PubMed] [Google Scholar]