Abstract
A test-retest study of FreeSurfer derived cortical thickness, cortical surface area, and cortical volume, as well as quantitative R1 relaxometry assessed on the midpoint of the cortex, was performed on a cohort of pediatric subjects (6–12 years old) scanned without sedation using SNARE-MPnRAGE (self navigated retrospective motion corrected magnetization prepared with n rapid gradient echoes) imaging. Reliability was assessed with coefficients of variation (CoVs) and intraclass correlation coefficients (ICCs) and statistical tests were used to determine differences with and without SNARE motion correction. Comparison of the test-retest measures of SNARE-MPnRAGE with prospectively motion corrected PROMO MPRAGE were also performed. When SNARE motion correction was used all parameters had statistically significant improvements and demonstrated high reliability. Reliability varied depending on parameter, region, and measurement type (vertex or region of interest). For mean thickness/surface area/volume/mean R1 across the regions of FreeSurfer’s DK Atlas, the mean CoVs (% x100) were (1.2/1.6/1.9/0.9) and the mean ICCs were (0.88/0.96/0.94/0.83). When assessed on a per-vertex basis, the CoVs and ICCs for thickness/R1 had mean values of (2.9/1.9) and (0.82/0.68) across the regions of the DK Atlas. Retrospectively motion corrected MPnRAGE had significantly lower CoVs and higher ICCs for the morphological measures than PROMO MPRAGE. Motion correction effectively removed motion related biases in nearly all regions for R1 and morphometric measures.
Keywords: Cortex, Relaxometry, Freesurfer, Motion, Retest, Reliability
1. Introduction
Cortical surface reconstructions using T1-weighted (T1w) magnetic resonance imaging (MRI) images and the FreeSurfer (Dale, Fischl, & Sereno, 1999) software package are widely used to investigate measures of the cerebral cortex including cortical thickness, cortical surface area, and cortical volume. However, the results are known to be highly variable when poor quality images are used, such as those containing artifacts from motion. For example, a recent study (Iscan et al., 2015) of forty healthy adults (18–65 years old) examined the effects of visual screening of T1w image quality on the test-retest reliability of cortical measures obtained from FreeSurfer and found significant improvements when using only a subset (25 of 40 subjects) of the data that passed inspection against those using the entire dataset.
Typically, T1w images from magnetization prepared rapid gradient echo (MPRAGE) are used for FreeSurfer analyses. The MPRAGE sequence uses an inversion pulse for magnetization preparation and a rapid gradient echo readout with conventional Cartesian k-space sampling. Prospective motion correction was previously implemented in MPRAGE by incorporating small flip angle excitations that collect either a series of 2D orthogonal images (White et al., 2010) or volumetric 3D-encoded echo planar images (Tisdall et al., 2012) at the end of each TR that are used to estimate motion and subsequently update the acquisition instructions before the next TR (White et al., 2010). Three dimensional echo planar imaging fat-exciting motion-navigator (Fat-Nav) technique was used in the magnetization prepared 2 rapid gradient acquisition gradient echoes multi echo (MP2RAGEME) sequence for retrospective motion correction of high resolution T1 and R2* at 7T (Bazin et al., 2020). An alternative to MPRAGE, MPnRAGE (Kecskemeti et al., 2016) uses radial k-space sampling to acquire a large (~400) number, n, of MPRAGE images with different T1-weighted contrasts in about the same amount of time as a conventional MPRAGE exam. The radial k-space trajectory makes MPnRAGE less sensitive to motion than MPRAGE, producing isotropic blurring artifacts as opposed to replicate ghosting artifact (Glover & Pauly, 1992). Further the 3D radial acquisition also allows Self-NAvigated REtrospective (SNARE) motion correction (Kecskemeti et al., 2018) to reduce image blurring from motion. In a comparison study of conventional magnetization prepared rapid gradient echo (MPRAGE) with prospective motion (PROMO) correction (White et al., 2010), MPnRAGE was shown to yield consistently higher image quality and automated regional segmentation reliability when imaging a pediatric (6–12 years old) cohort of normal control subjects (Kecskemeti & Alexander, 2019). Quantitative R1 relaxometry maps, generated from the n motion corrected MPnRAGE images in those regions also demonstrated high test-retest reliability despite the large degrees of participant motions (Kecskemeti & Alexander, 2020). In the previous two studies, analysis was limited to whole brain segmentations with FSL FAST (Zhang, Brady, & Smith, 2001), subcortical segmentations with FSL FIRST (Patenaude, Smith, Kennedy, & Jenkinson, 2011) and FreeSurfer, and whole brain cortical volume with FreeSurfer.
The current study performs test-retest analyses of cortical thickness, cortical surface area and cortical volume of MPnRAGE and PROspectively Motion (PROMO) corrected MPRAGE as well as the cortical R1 relaxometry values from MPnRAGE. This study examines test-retest at the whole brain and regional levels for all measures, and also at the vertex level for thickness and R1. To our knowledge, this is the first study to examine the test-retest of quantitative R1 of the cortex using surface based maps as well as the first test-retest of Freesurfer cortical measures in a pediatric population. The test-retest performance will estimate statistical power that may be used to estimate the number of subjects needed for group comparisons of future studies. Since the subjects in this study are pediatric subjects and stabilization padding was not used for the repeated imaging, we expect the results of this study to be generalizable as an upper-bound for future studies of adults or children scanned with stabilization padding.
2. Methods
2.1. MPnRAGE background
A magnetization (inversion) prepared rapid gradient echo (i.e. MPRAGE (Mugler & Brookeman, 1990)) sequence was modified to collect a large number, n, gradient echoes (i.e. MPnRAGE (Kecskemeti et al., 2016, 2018)) within each gradient echo readout block using a 3D radial k-space trajectory in place of the conventional Cartesian trajectory of MPRAGE. The trajectory ordering was quasi-randomly selected to approximately distribute projection angles uniformly within each gradient echo block as well as across each gradient echo block, at each inversion time. The quasi-random angular ordering within a gradient echo block rapidly changes the direction of the readout gradients so that motion during the readout block creates an approximately isotropic spatial blurring. Low resolution navigator images are formed using data within each gradient echo block to estimate motion parameters. SNARE motion correction is performed directly in k-space using the Fourier Shift Theorem to correct translations and by rotating the k-space trajectories to correct for rotations. Thus, errors from spatial interpolations are eliminated. Images for a range of inversion time contrasts are formed using the collection of data at a specific inversion time, but across all gradient echo blocks and are used to estimate R1 by fitting to a known model, derived by solving the Bloch equations. Thus, all images are inherently aligned. Additional details regarding image reconstruction, motion correction and relaxometry estimation can be found in references (Kecskemeti et al., 2018) and (Kecskemeti & Alexander, 2020).
2.2. Study population
Imaging experiments were performed with institutional review board approval and informed consent/assent. Twelve children (9.4 +/− 2.6 years, min = 6.5 years, max = 13.8 years, 6 male and 6 female) without known neurological health concerns were selected for imaging. Recruitment was not based on likelihood of subjects remaining still during the scan.
2.3. Prior analyses
MPnRAGE T1-weighted images from this population were previously analyzed in references (Kecskemeti & Alexander, 2019) and (Kecskemeti & Alexander, 2020), which demonstrated high test-retest of volumes, segmentation masks, and region of interest quantitative T1 values from automated segmentations from FSL FAST, FSL FIRST, and FreeSurfer. The cortical analysis with FreeSurfer was limited to whole brain cortical volume (Kecskemeti & Alexander, 2019) and whole brain averaged quantitative T1 (Kecskemeti & Alexander, 2020).
2.4. Data collection
All exams took place on a 3T MRI scanner (Discovery MR750, GE Healthcare, Waukesha, WI) without the use of sedation. Participants watched a video of their choice and were instructed to remain still. The participants heads were stabilized within a 32 channel head coil (Nova Medical, Wilmington, MA) using the NoMoCo pillow support system (NoMoCo Pillow, Inc., La Jolla, Ca). After receiving a single MPnRAGE acquisition and prospectively corrected T1-weighted MPRAGE acquisition (6–7 minutes), some of the padding was removed to allow further range of motion. Each subject then received alternating MPnRAGE and PROMO MPRAGE acquisitions until three exams in total of each was acquired. The order of all MPnRAGE and PROMO MPRAGE scans was counter-balanced within and across subjects.
2.5. PROMO corrected MPRAGE acquisition parameters
A works in progress version of the PROMO corrected MPRAGE acquisition version was used that acquired k-space with a linear centric view-ordering scheme. Whole brain coverage with 1.0 mm isotropic resolution was acquired using a sagittal acquisition with 192 slices and a 256 × 256 mm in-plane acquisition matrix. Additional parameters include TI = 900 ms, TR/TE = 6.952 ms/2.92 ms, band-width = 31.25 kHz, flip angle 8 degrees, time between magnetization preparation pulses = 2488 ms, and ARC acceleration of 2 and 1.25 along the phase encode and slice directions, respectively. The acquisition time was 6 min with an additional 1 min of data re-acquisition allowed as needed.
2.6. PROMO corrected MPRAGE motion correction strategy
MPRAGE-PROMO utilizes the period of “free recovery” between each SPGR readout block and the next magnetization preparation module to collect a series of orthogonal-2D “navigator” images to estimate the amount of motion between successive magnetization preparation pulses (2488 ms) and then adjust the excitation and imaging gradients if a certain motion criterion is met. Motion within the readout window (Nz*TR = 1335 ms) is not corrected and will result in motion induced ghost artifacts. After a complete data set is acquired, an optional rescan period (up to 1 min in this study) continually reacquires kspace data one ky-plane at a time, each time choosing the ky-plane that is most corrupt by motion as determined by the navigator motion estimates. More details can be found in (White et al., 2010).
2.7. MPnRAGE acquisition parameters
Whole brain coverage with 1.0 mm isotropic resolution was acquired in the axial orientation with 200 slices. Parameters included, TR = 4.9 ms, TE = 1.8 ms, n = 386 views along the recovery curve. The excitation flip angles were 4°/8° for the first 325/remaining 61 views. A delay time of TD = 500 ms occurred after the last TR of each gradient echo block to allow the signal to recover before the next preparation pulse. The scan time was 7 min.
2.8. MPnRAGE reconstruction and T1 fitting procedure
Composite T1-weighted images using the entire k-space dataset for each scan were reconstructed both with and without motion correction according to (Kecskemeti et al., 2018). The Tenengrad metric (Krotkov, 1988), a reference free measure of image sharpness found to agree well with human perception of image sharpness of MPnRAGE images (Kecskemeti et al., 2018), was used to assess the change in image sharpness after motion correction. If the Tenengrad metric indicated that composite T1-weighted image sharpness was decreased due to motion correction, which occasionally occurs in cases with no apparent motion, the motion-correction pipeline returned the non-motion corrected T1-weighted image for segmentation and did not use motion correction for the remainder of the processing. Similar to the procedure in (Kecskemeti & Alexander, 2020), complex valued source images corresponding to each of the 386 inversion times (12ms to 1889ms, evenly spaced by 1TR) were reconstructed by summing the individual coil images according to (Roemer, Edelstein, Hayes, Souza, & Mueller, 1990) both with and without motion correction. A multi-pass fitting procedure similar to (Kecskemeti & Alexander, 2020) was performed that initially fit all voxels for 4 unknowns (R1, spin density, B1, and inversion efficiency) using a known model determined by solving the Bloch equations. The second and third pass filter and then fix B1 (second pass) and inversion efficiency (third pass) with a 3D Gaussian kernel of 7 mm and 9 mm full-width half-max, respectively. The fourth pass filters the original inversion efficiency map with a non-local-means filter using the R1 map of the third pass as the reference to reduce blurring of inversion efficiency across tissue types. The final R1 maps were then denoised using total variation (TV) minimization (Rudin, Osher, & Fatemi, 1992).
2.9. ROI selection & T1 measurement
Prior to segmentation with recon-all from FreeSurfer, the composite T1-weighted images were corrected for the strong receiver biases using N4BiasFieldCorrection, part of the ANTS software package described in (Tustison et al., 2010). The quantitative R1 maps are inherently aligned with the T1-weighted images, so no additional registration steps are needed other than a reorientation from axial to coronal view that FreeSurfer initially performs to the input images, which can be corrected with FreeSurfer’s mri_vol2vol utility. R1 values within the cortical surface of each subject are sampled at the midpoint between the white matter / gray matter boundary and the pial surface using FreeSurfer’s tool mri_vol2surf with option “–projfrac 0.5”.
2.10. Region of Interest (ROI) analysis
Mean cortical thickness and quantitative R1 values were computed for each region of both the Destrieux and Desikan-Killian (DK) atlases by averaging over the associated values for all vertices within each region. The coefficient of variation (CoV) describes the within subject variation, which is useful to know when studying longitudinal changes of an individual. However, when studying changes across a population the utility of a technique with a low CoV is diminished if the changes with respect to population are also small (of order or smaller than the CoV). The intraclass correlation coefficient (ICC), however, puts the within subject variation in perspective with the between subject (population) variation and therefore serves as a useful indicator for studying changes across a population. Thus, the reliability of these region-of-interest (ROI) measurements, as well as the cortical surface area and volume of each ROI, was assessed by computing the ICC and CoV for each region. Mean ICC and CoV values for each atlas were computed by averaging across the respective measurements for all regions. Statistical differences between the mean measures with and without motion correction were assessed with the Wilcoxon signed-rank test. Corrections for false discoveries was performed with the Benjamini-Hochberg procedure (Benjamini & Hochberg, 1995) at the significance level of p = 0.05.
2.11. Vertex based analysis
Cortical thickness and quantitative R1 values were mapped to FreeSurfer’s fsaverage template with mri_surf2surf to allow comparisons of individual vertices across repeated measurements and between subjects. The reliability of measurements at each vertex were assessed by computing the ICC and the CoV for each vertex. Mean ICC and CoV values for each region were computed by averaging across the respective measurements at all vertices within each region. Mean ICC and CoV values for each atlas were computed by averaging across the respective measurements for all regions. Statistical differences between the mean measures with and without motion correction were assessed with the Wilcoxon signed-rank test. Corrections for false discoveries was performed with the Benjamini-Hochberg procedure (Benjamini & Hochberg, 1995) at the significance level of p = 0.05.
2.12. Impact of surface based smoothing
An initial investigation of the impact of surface-based smoothing of the cortical measurements was conducted by examining the cortical average of the vertex-based ICCs and CoVs when different amounts of smoothing are used during the mapping to the fsaverage template. These results were used to choose a consistent smoothing for vertex based analyses above.
2.13. Impact of hemisphere dependence
An initial investigation used the Wilcoxon signed-rank method to test whether the coefficients of variation had hemispherical dependence. The results were used to decide how the remainder of the analysis is presented.
2.14. Power analysis
After computing the standard deviation of the individual measures, a power analysis using a two-sided t-test with a significance level of 0.05 and power of 0.90 was used to determine the sample sizes required to detect certain percent differences of the measures between two groups. All calculations were performed using the “sampsizepwr” function in Matlab 2020a using the automatic motion correction results.
2.15. Characterization of motion and its relation to parameter measurement, test-retest, and bias
Spatial blurring is the dominant image artifact from motion in MPnRAGE. Thus, a useful scalar metric to quantify the amount of motion and its effect of image quality should describe the amount of blurring around the average location of the imaged object. Since variances add in quadrature, a natural candidate for a motion metric, ρ, is a linear combination of the variances of translational and rotational motions, and , across the navigator frames, i.e.
| (1) |
where the summation index i runs over the x, y, and z directions and the αi and βi are constants. Choosing αi = 1∕3 provides equal contributions among the three independent directions so that then describes the average blurring due to translational motions. The βi are then interpreted as conversation factors to provide the correct units and help balance the relative weighting of translations and rotations. Since the amount blurring due to rotational motions depends on the radial distance, r, from the center of rotation, choosing βi = 2r2/3 so that then describes the average blurring at a distance r from the center of rotation due to rotational motions. The extra factor of 2 in the definition of βi occurs because displacement in a single direction can occur from rotations in the two orthogonal directions. Therefore, motion will be characterized with the following metric, ρ, defined in Eq. (2) below as
| (2) |
where and are the variances of translations and rotations between the navigator frames the i’th direction, the summation runs across the x, y, and z directions and . The value for r could be increased or decreased as desired to provide a metric with a weighting more focused at a different radius, or even set to zero to focus only on translational motions. This manuscript uses r = 180/π mm, which is about the radius of an idealized spherical human brain and assumes that the transformation is computed around the center of the image, consistent with the transformations applied during image reconstruction.
Although Eq. (2) is an attractive method because it is simple and easy to compute, it provides a single scalar value that cannot capture regional differences in blurring and requires several assumptions. An alternative method to characterize motion is to directly compute the positional uncertainty or image blurring at each voxel location. This is accomplished by using the inverse motion transformations from each of the N navigators to create a (N × 3) vector of spatial coordinates for each voxel that describe where that voxel was mapped from in each of the navigator frames. The positional uncertainty or spatial blurring in each direction is then described by the standard deviation across the N measurements in each direction. The average positional uncertainty or average blurring is the square root of the average of the squared uncertainties of all directions. In the rest of this work, the map of average positional uncertainties will be referred to as a motion map. This motion map is inherently aligned with the T1-weighted and R1 images and thus motion estimates can be easily computed for each vertex to create a cortical motion map. The mean cortical motion can be obtained by averaging across all vertices of the cortical motion map.
To put the amounts of motion of this limited study into context with those of a larger study, the motion metric, motion maps, and mean cortical motions were also computed for subjects of an ongoing study of autism spectrum disorder (ASD). The study consisted of 107 children ages 8.7 years +/−1.2 years (76 males, 31 females), made up of 35 children with typically developing (TD) controls, 42 with ASD, 12 TD but with first degree relative with ASD and 1 with undetermined diagnosis due to conflicting parental reports. The protocol was identical with the test-retest study except the scan length was increased to 9 minutes to increase the signal to noise ratio and the participants heads were well stabilized within the receiver coil. Prior to scanning, most of these participants were acclimated to the scanning environment with a mock-simulator MRI scanner and similar to the test-retest study, participants watched a movie during the MPnRAGE acquisition. There were no repeated scans in this comparison study, so it was not used to assess test-retest.
The relative biases of motion on R1 relaxometry and morphological parameters values were characterized by computing the percent difference maps of the uncorrected to motion corrected values. Further, a linear mixed effects model was used to separately fit each of the cortical parameters assessed both without and with motion correction as a function of the cortical motion, gender, age, and random effects of the measures for each subject. A linear mixed effects model was also used to fit the motion metric as a function of age, gender and the random effects of each subject.
3. Results
3.1. Overview
Seven of the 36 PROMO MPRAGE cases, spread across five different individuals, did not complete processing in FreeSurfer, likely due to the presence of visible motion artifacts. Rather than excluding five of twelve subjects from the ICC analysis, the computation for MPRAGE PROMO used only two scans for each subject, resulting in 10 total subjects. For subjects that had all three MPRAGE PROMO scans successfully finish segmentation in Freesurfer, the first two scans were used. All three scans, for all twelve subjects were used for MPnRAGE analysis. Since different subsets of participants were used, no statistical testing between the underlying values of thickness, surface area, and volume, although statistical testing was done to compare the CoVs and ICCs.
3.2. Sample images and surface reconstructions
Example MPnRAGE T1-weighted and R1 relaxometry images, motion parameter maps, and segmentation overlays are shown in Figs. 1,2 for a subject with severe motions. Image blurring associated with severe (Fig, 1) motions create fuzzy pial and white surfaces producing noticeably incorrect segmentations when motion correction in not applied, but visibly sharper surfaces and more realistic segmentations after motion correction is applied.
Fig. 1.
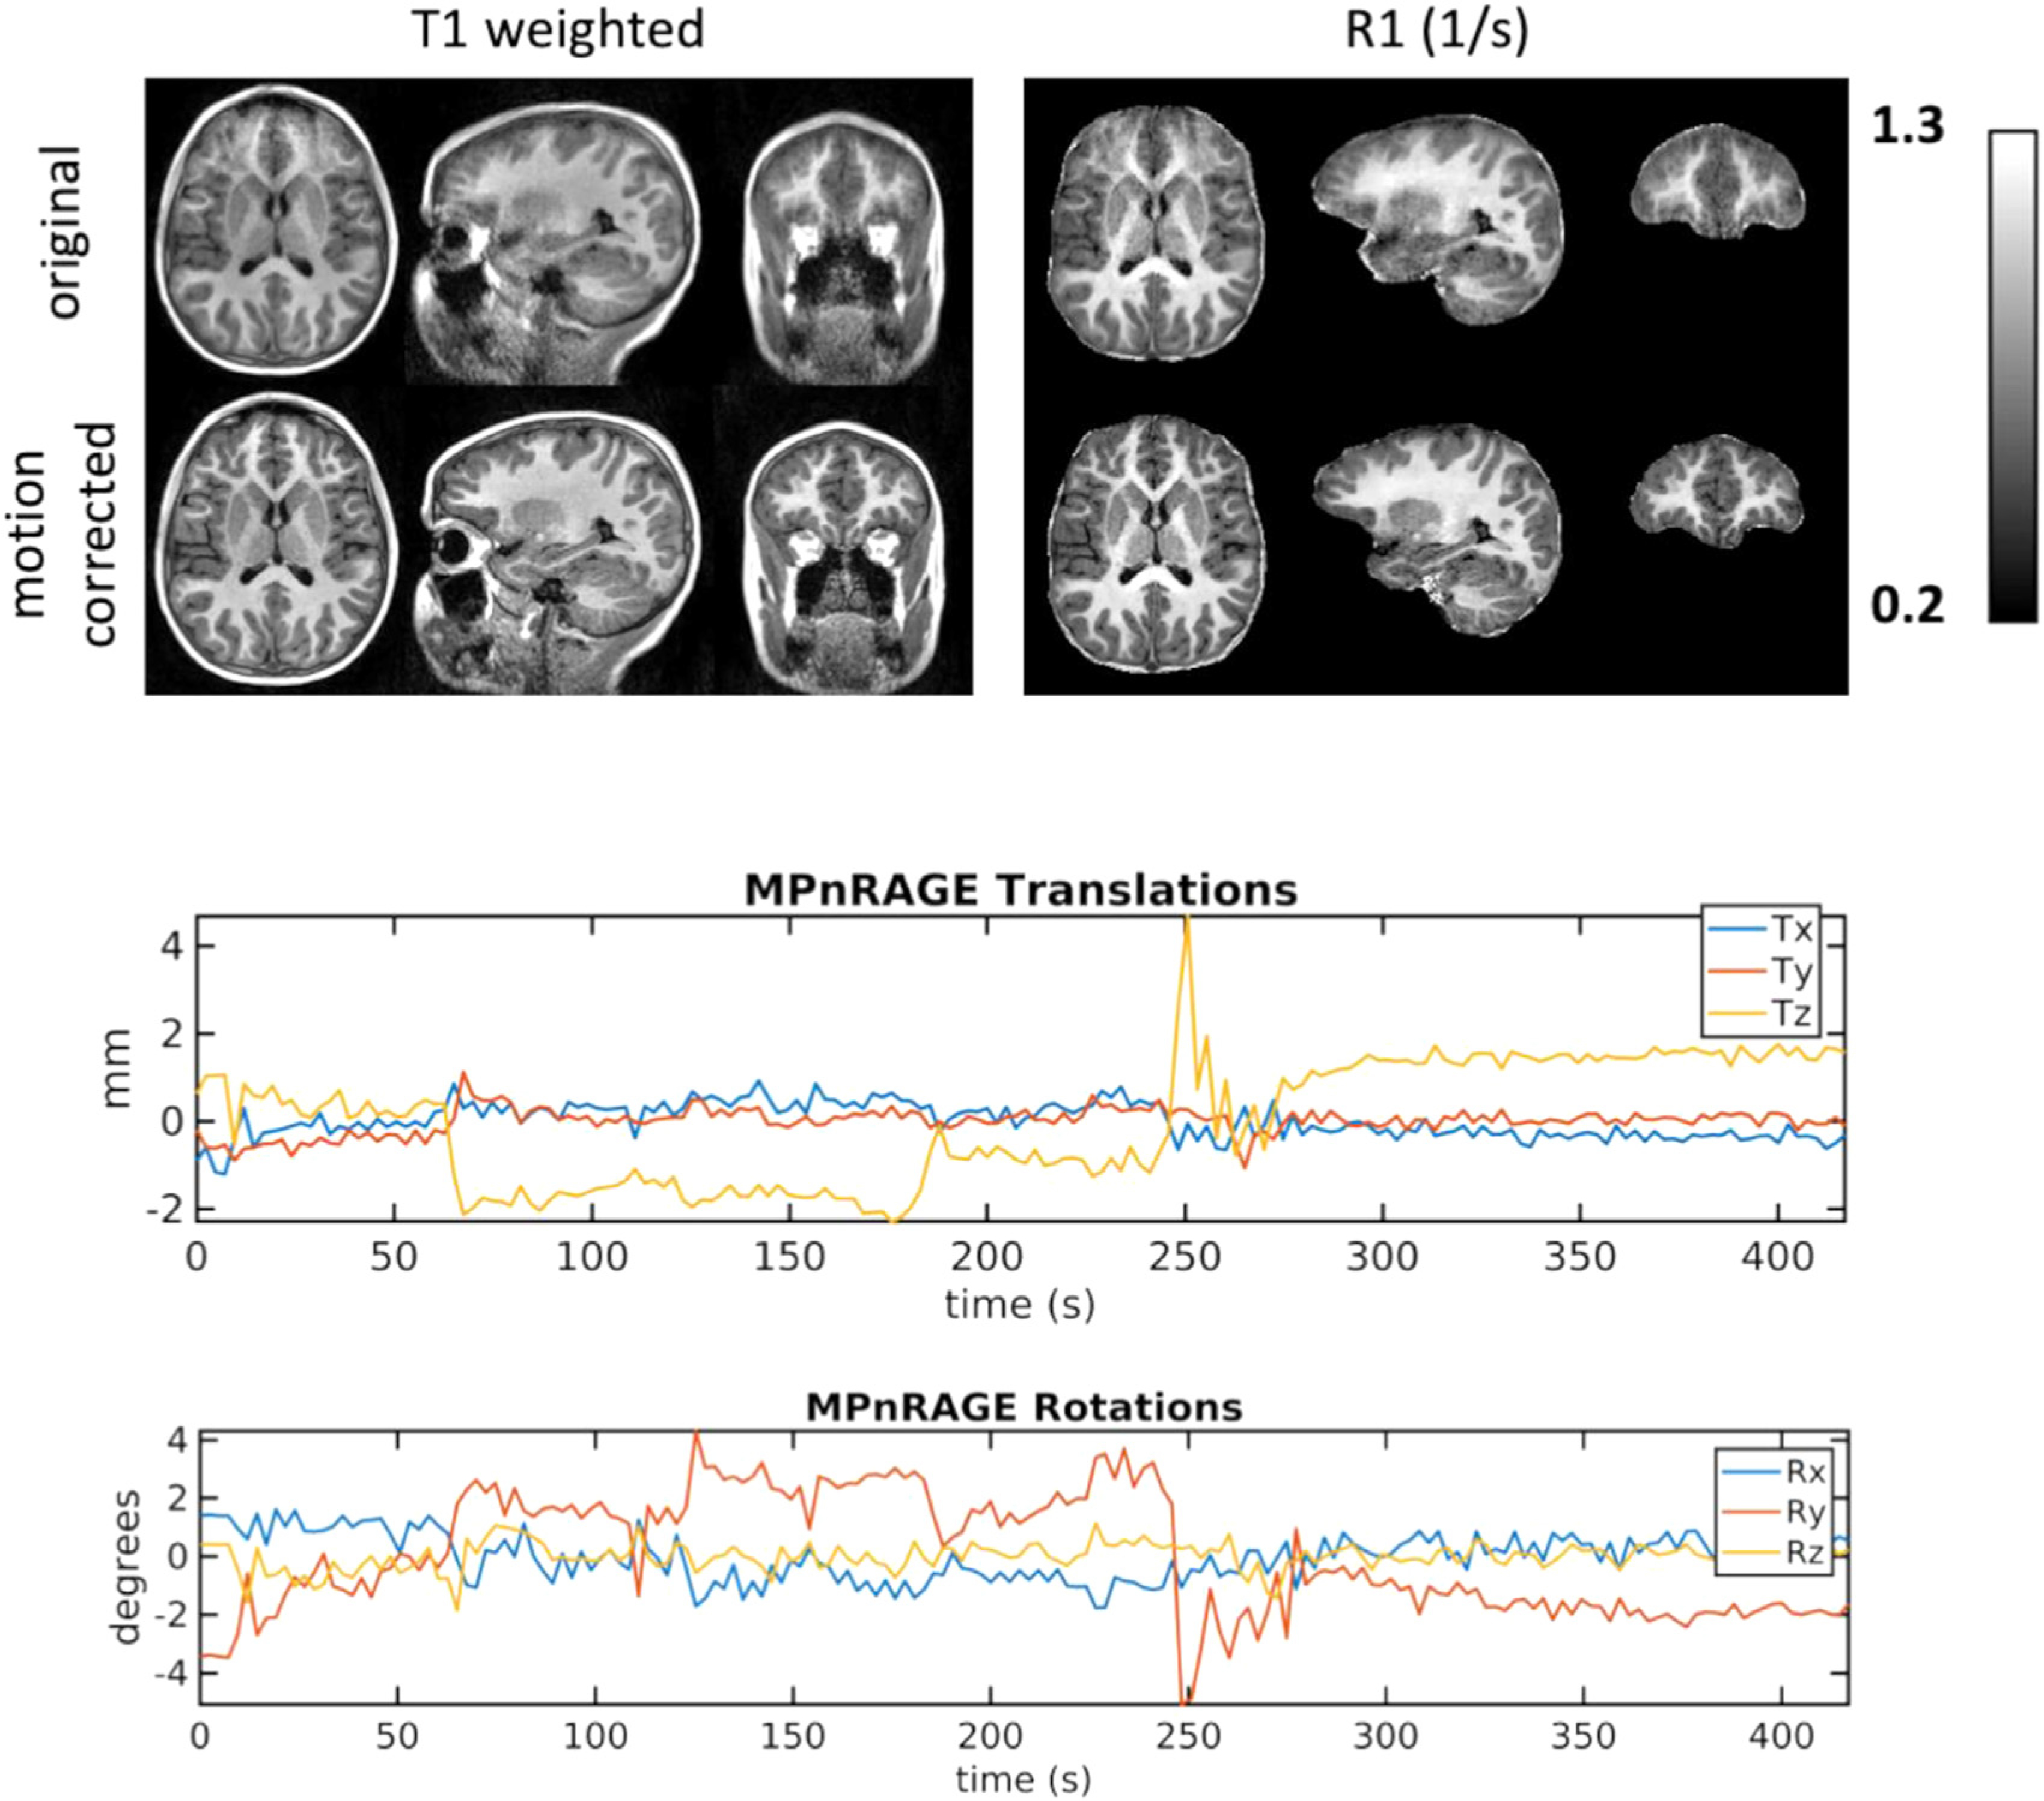
Example images and motion estimations from a 7.6 year old child typically developing female demonstrating MPnRAGE motion correction for moderate to severe motions. Without motion correction, the T1-weighted and quantitative R1 images have blurred tissue boundaries.
Fig. 2.
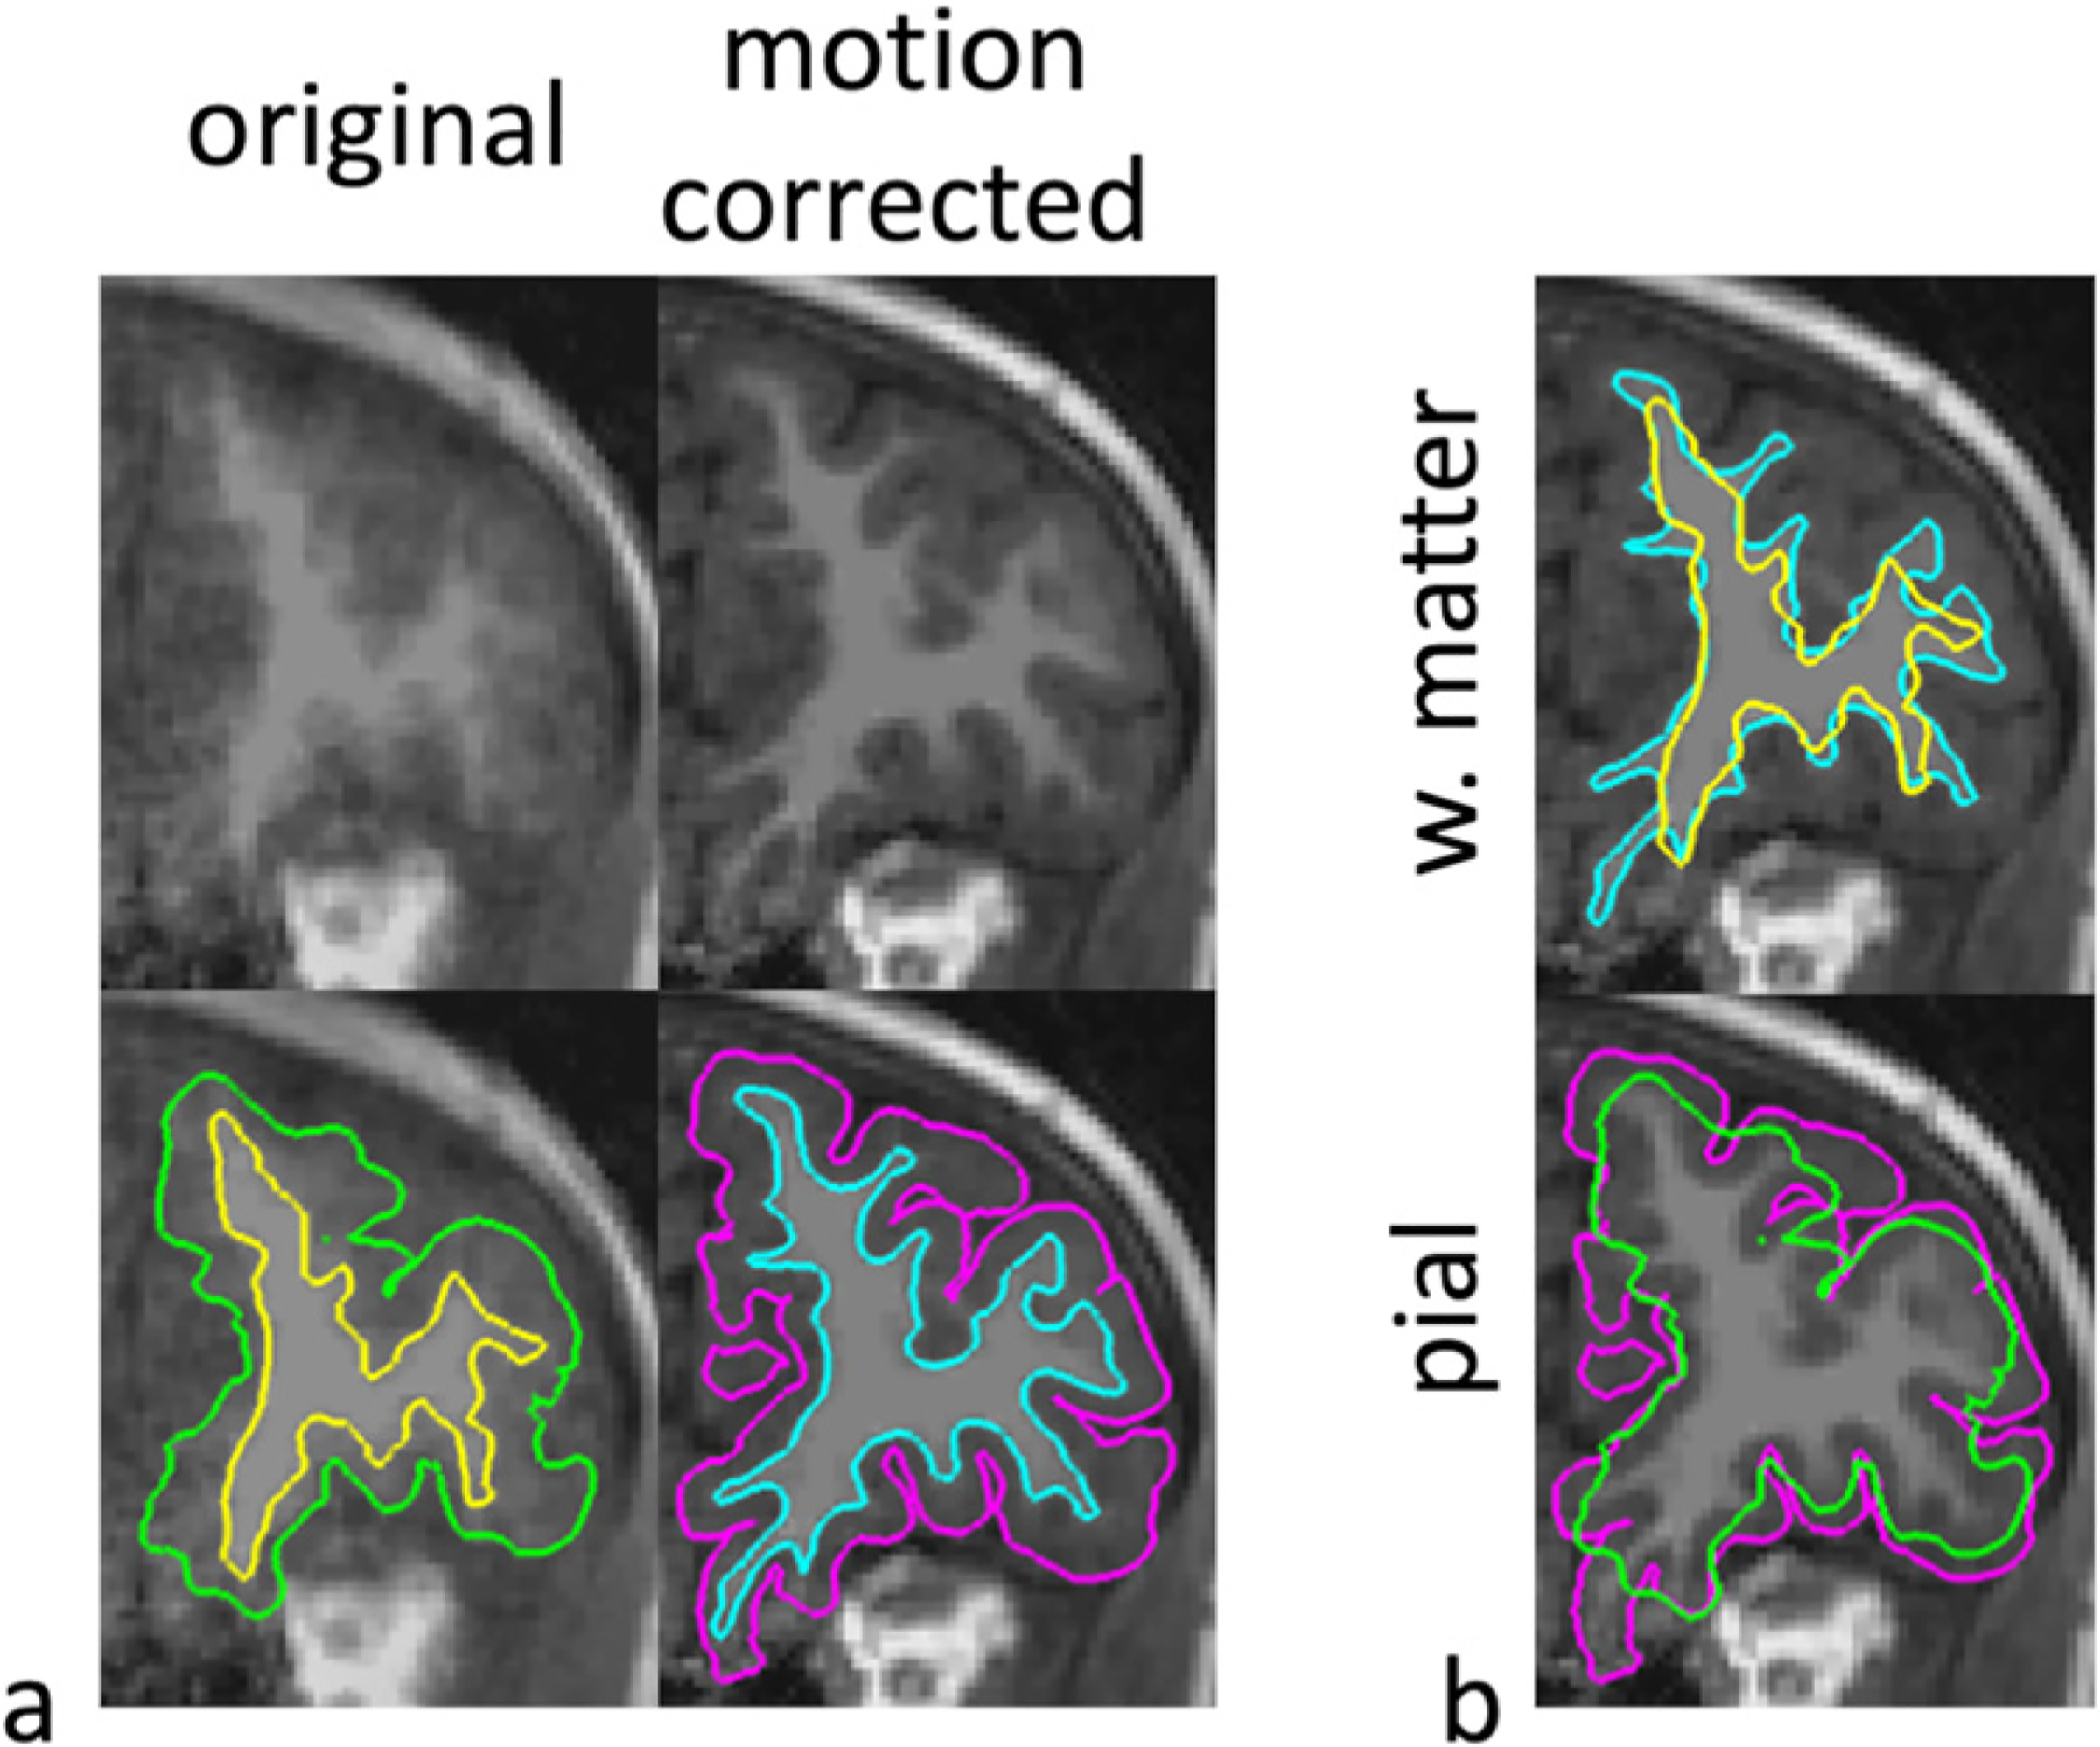
The resulting cortical segmentations (pial and white matter surfaces) from the T1-weighted image in Fig. 1 are shown for MPnRAGE without (No MC) and with (MC) motion correction. The white matter (aqua and yellow) and pial (magenta and green) are shown with and without motion correction respectively in (b).
3.3. Impact of surface based smoothing
Using the motion corrected MPnRAGE images as an example, the effects of surfaced based smoothing of the cortical thickness and R1 relaxometry maps before computation of ICCs and CoVs for each vertex are shown in Fig, 3. Increasing the amount of smoothing improves the ICCs and CoVs of both parameters, with rapid improvements as the filter size (full width half-max) initially increases from 0 mm (no smoothing) towards about 5–10 mm of smoothing but small gains with more smoothing. The remainder of this work will utilize a 10mm filter, which is consistent with (Han et al., 2006) and much of the literature for group analysis of cortical thickness.
Fig. 3.
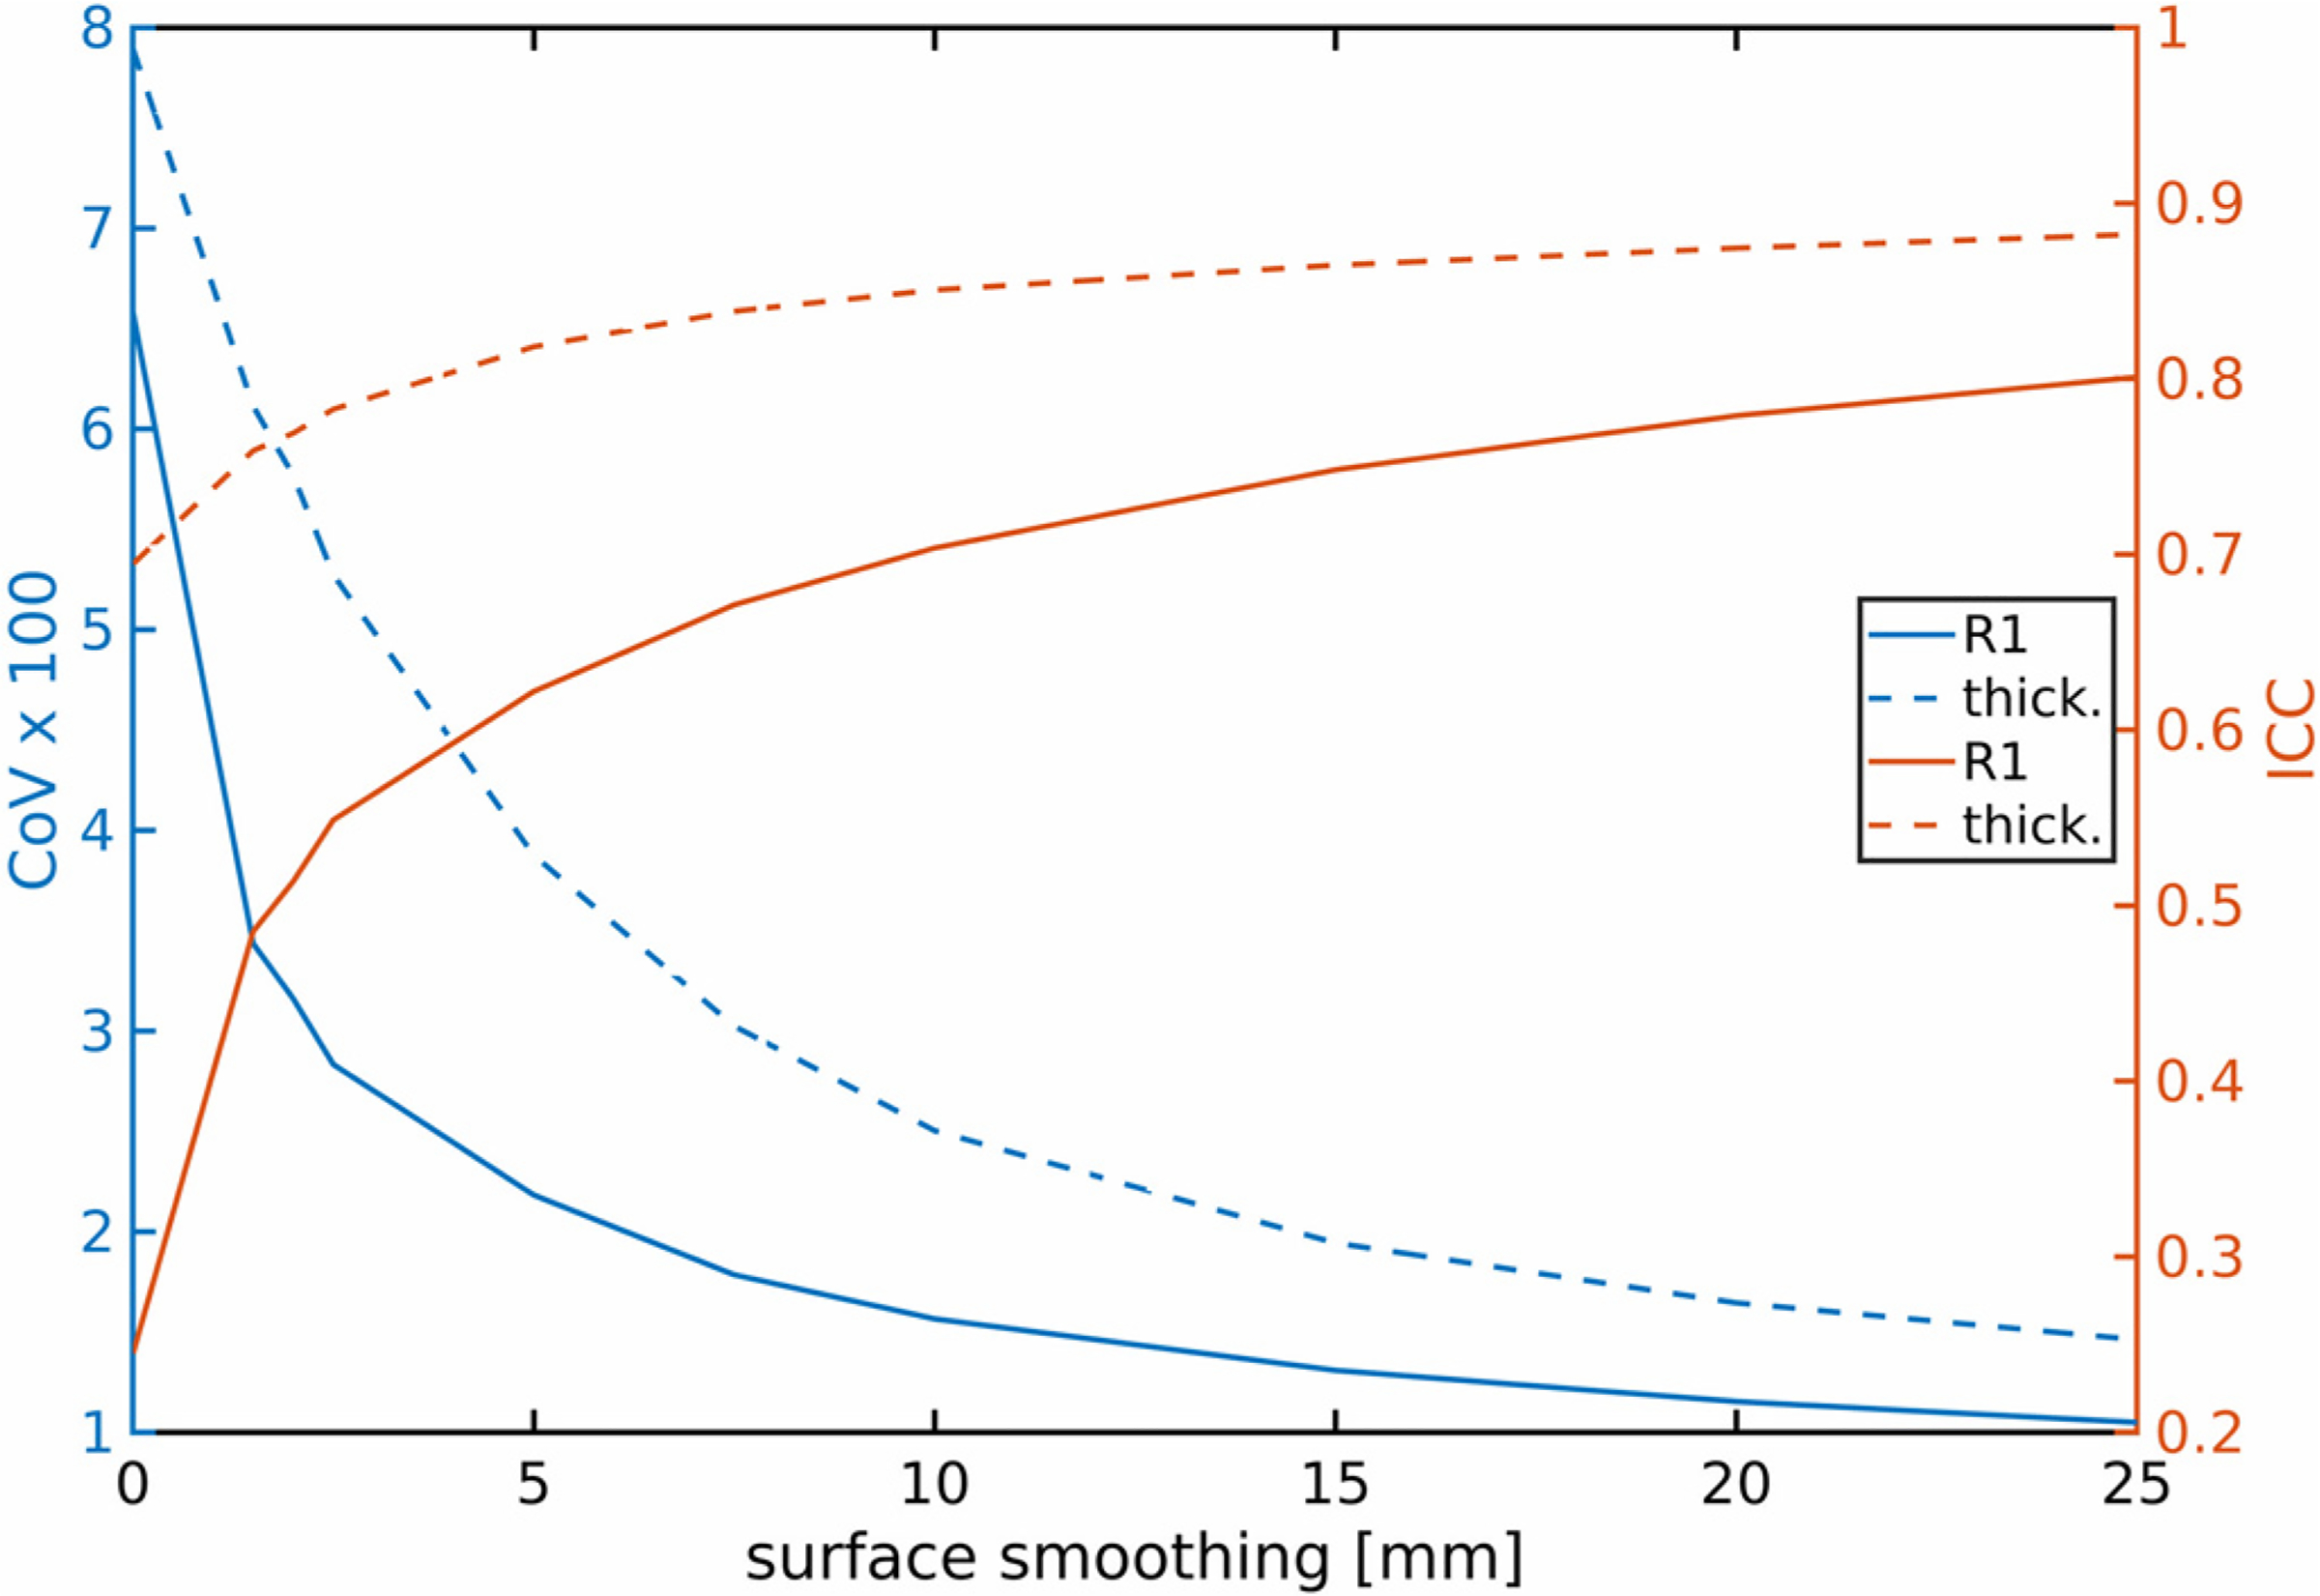
The impact of smoothing along the surfaces of the thickness and R1 maps before computation of the ICCs and CoVs at each vertex. Shown are the whole cortex averages across all vertices for different sized Gaussian kernels (full-width-half-maximum in mm). Motion corrected MPnRAGE was used for this example.
3.4. Impact of hemisphere dependence
For MPnRAGE, only the coefficient of variation of the surface area for superior occipital sulcus and transverse occipital sulcus in the Destrieux atlas, showed a statistical difference (p = 3.1e-4) between left and right hemispheres after false discovery rate corrections. The average p-values across all regions ranged from p = 0.42 (surface area in the Destrieux atlas) to p = 0.60 (thickness in the DK atlas), with over 95% of the measurements having p > 0.05. Thus, region of interest measurements from left and right hemispheres were combined for all further analyses including the analysis with the PROMO MPRAGE datasets.
3.5. Test-retest
The mean whole-brain cortical R1, thickness, surface area, and volume across all subjects are listed in Table 1 for all methods. For MPnRAGE, cortical geometric measures such as thickness, surface area, and volume were significantly smaller without motion correction, but quantitative R1 relaxometry values were significantly larger (min |Z| = 3.0, max p = 0.003). Motion correction significantly reduced the coefficients of variation for all measures (max p = 0.005). Without motion correction, the ICCs were between 0.69 and 0.79 for the morphological measures and was 0.37 for R1, but increased to between 0.96 and 0.99 for morhological measures and to 0.94 for R1 with motion correction. Compared to both the uncorrected and motion corrected MPnRAGE results, prospectively corrected MPRAGE had statistically significant (p < 0.001) lower ICCs and higher CoVs.
Table 1.
Whole brain average value of cortical thickness, surface area, volume, and quantitative R1 and associated intraclass correlation coefficients (ICC) and coefficients of variation (CoV) × 100.
| Whole brain averages | |||||
|---|---|---|---|---|---|
|
| |||||
| Thickness (mm) | surface area (1e5 mm^2) | Volume (1e5 mm^3) | R1 (1/s) | ||
|
| |||||
| MPRAGE PROMO | Value | 2.77±0.12 | 1.85±0.20 | 6.03±0.71 | – |
| CoV | 2.17±2.62 | 3.99±6.79 | 4.39±7.49 | – | |
| ICC | 0.41 | 0.59 | 0.60 | – | |
| MPnRAGE w/o motion correction | Value | 2.86±0.12 | 1.69±0.24 | 5.71±0.80 | 0.661±0.040 |
| CoV | 1.64±1.08 | 5.86±6.65 | 6.12±7.07 | 3.39±3.27 | |
| ICC | 0.79 | 0.72 | 0.69 | 0.37 | |
| MPnRAGE w/motion correction | Value | 2.89±0.10 | 1.81±0.14 | 6.12±0.46 | 0.631±0.014 |
| CoV | 0.65±0.29 | 0.49±0.51 | 0.76±0.49 | 0.46±0.32 | |
| ICC | 0.96 | 0.99 | 0.99 | 0.94 | |
Surface based colormaps of ICC and CoV for region of interest and vertex based measurements are shown in Figs. 4–6 for MPnRAGE and illustrate and regional heterogeneity of the reliability of each of the measures.
Fig. 4.
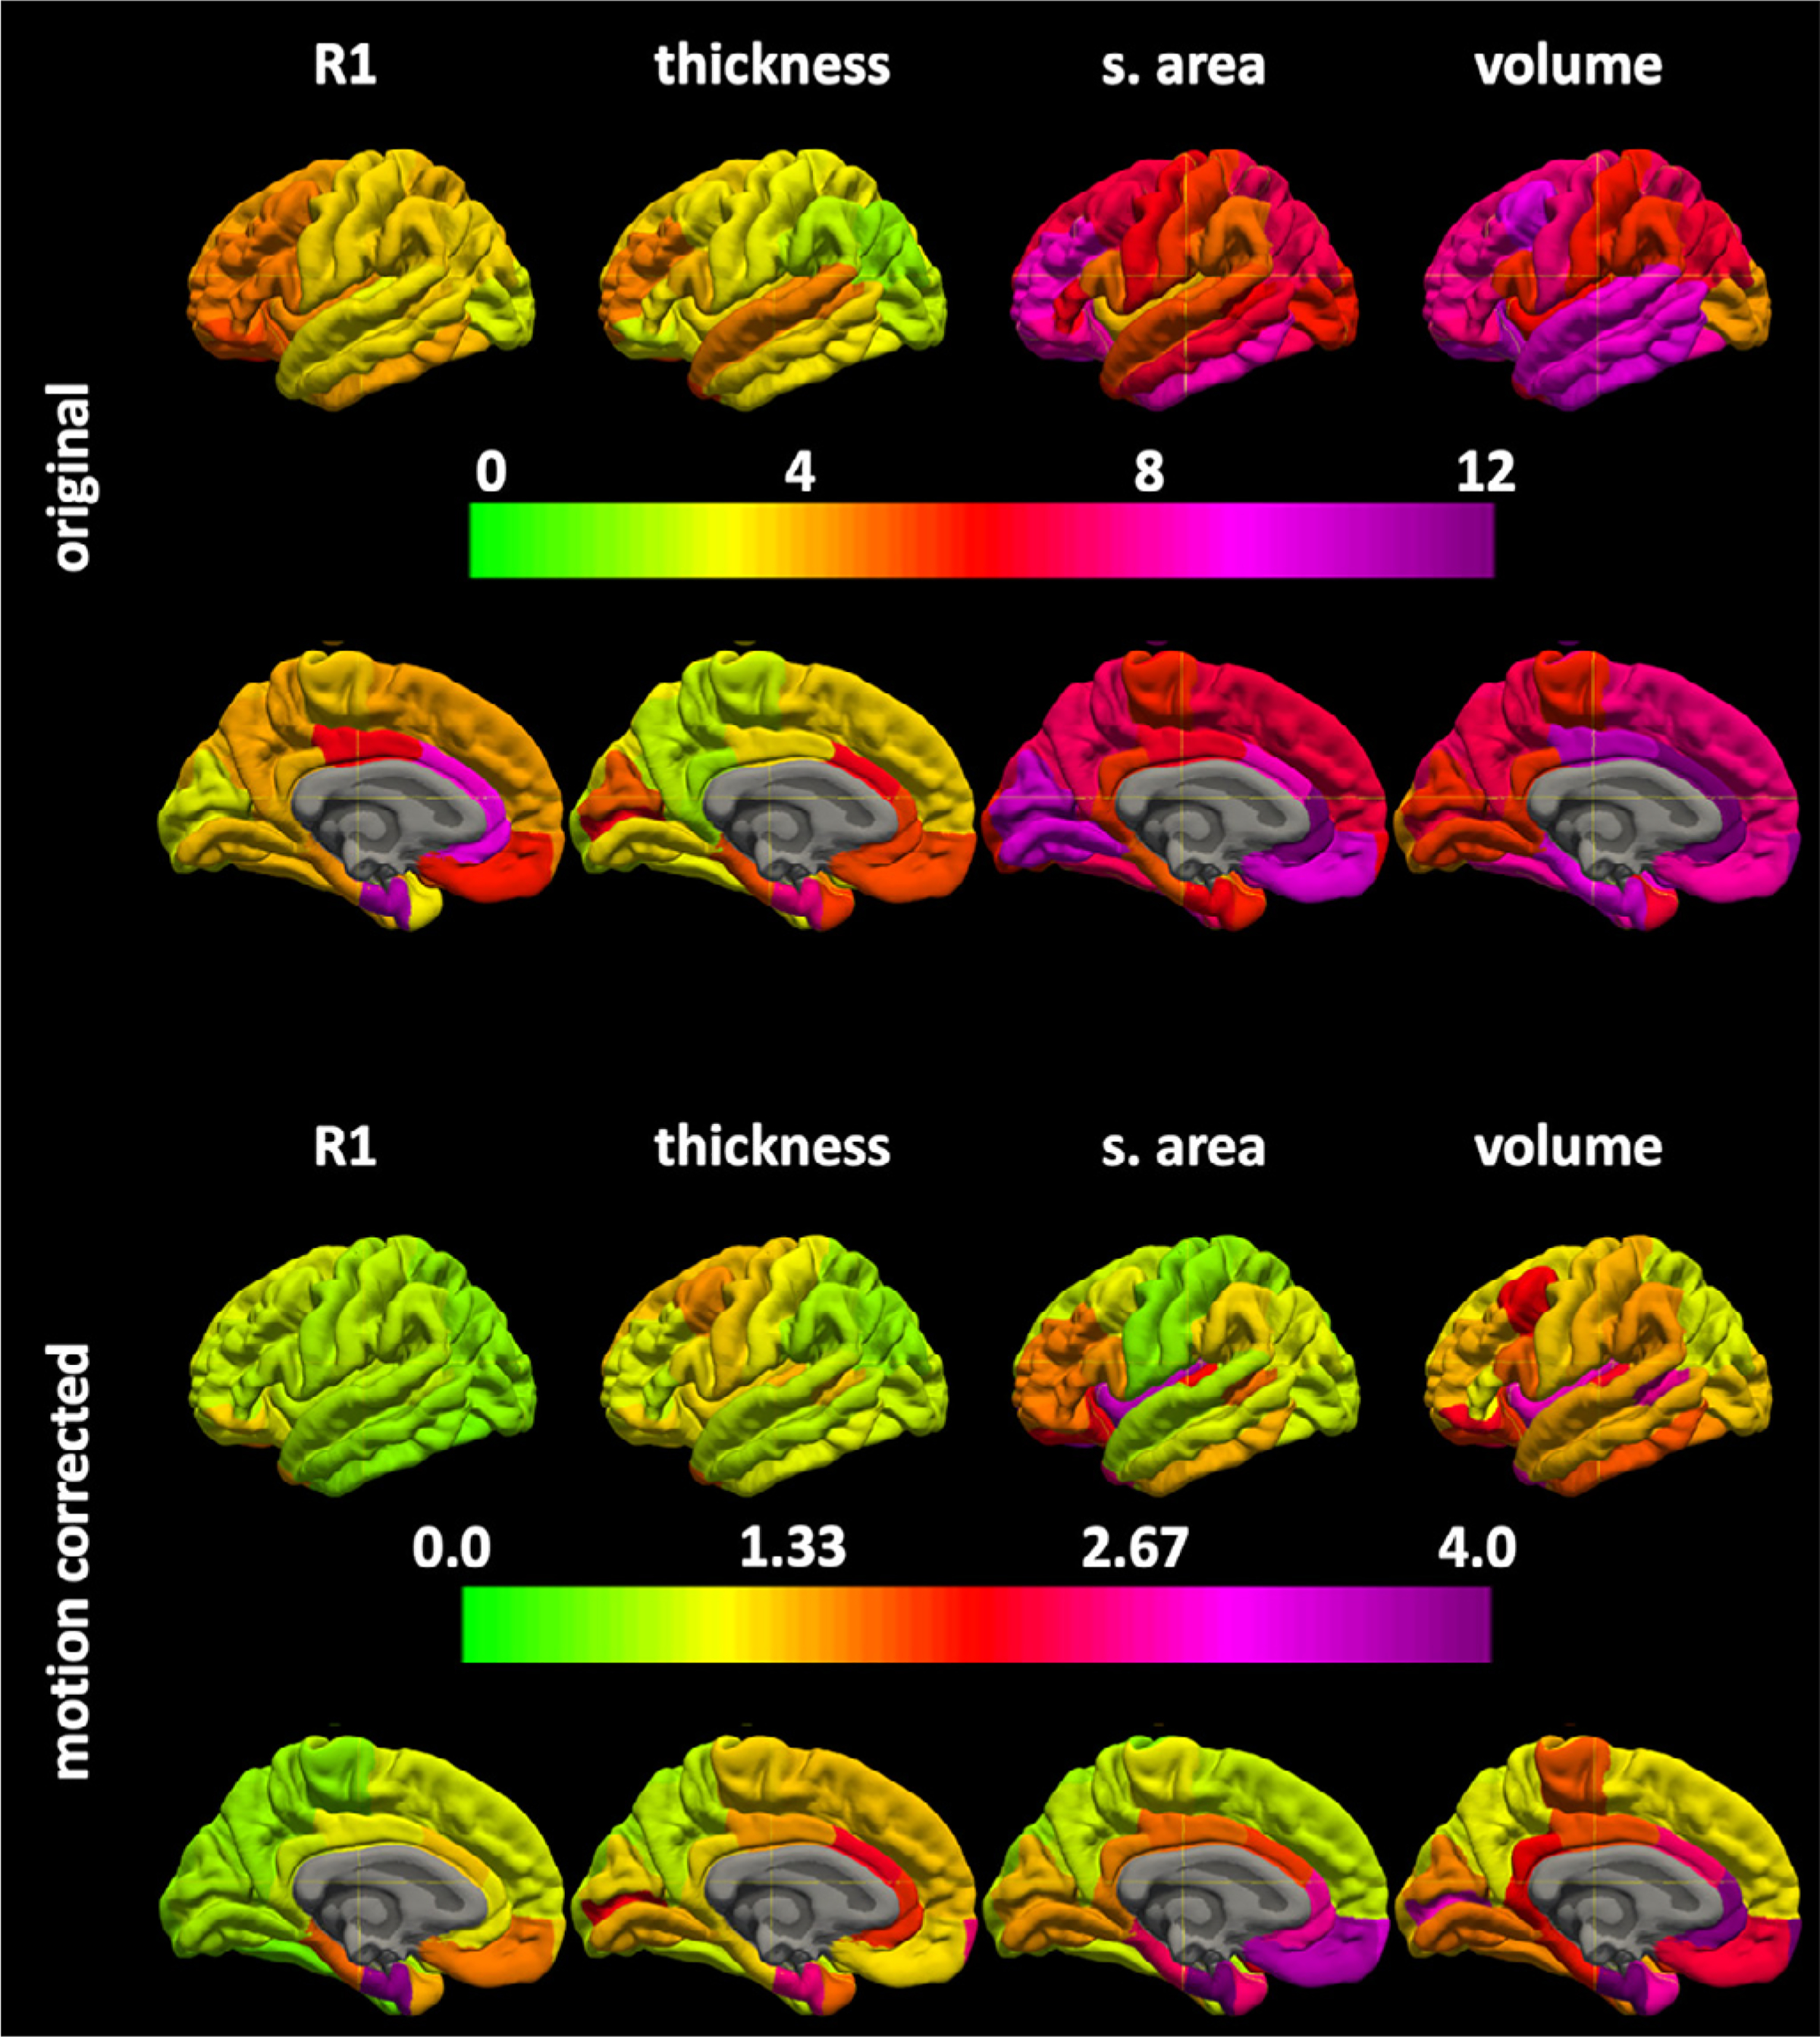
The regional surface maps for the coefficients of variations × 100 without (top) and with (bottom) motion correction for MPnRAGE.
Fig. 6.
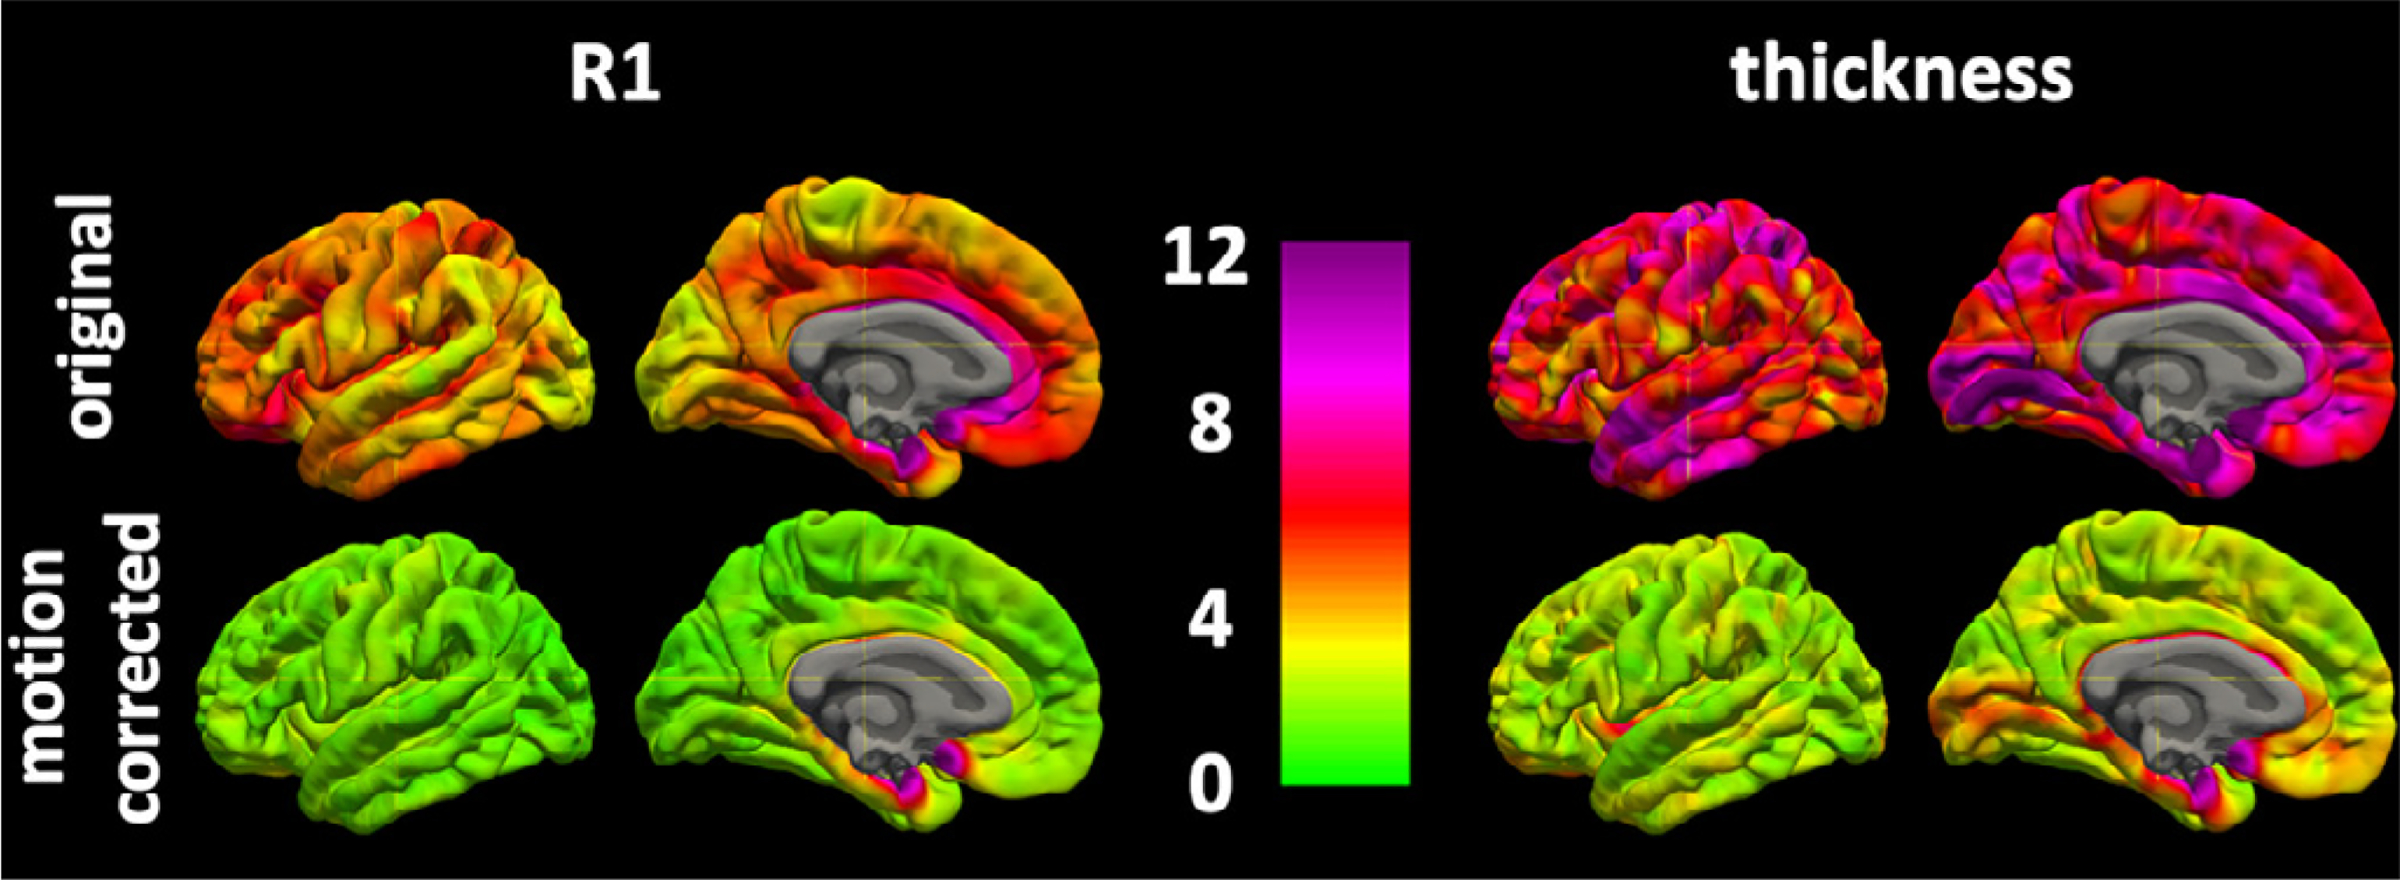
Vertex based coefficients of variation × 100 (top) and intraclass correlation coefficients (bottom) with and without motion correction for MPnRAGE.
Region-of-interest cortical R1, thickness, surface area, and volume measurements for the Destrieux and Desikan-Killian (DK) atlases are provided in Supplementary Tables 1–8. Statistical differences between the uncorrected and motion corrected MPnRAGE images were observed for 27, 64, 52 and 72 of the 74 regions for the Destrieux atlas and 12, 30, 27 and 33 of the 34 regions for the DK atlas for cortical thickness, surface area, volume, and R1, respectively.
When averaged across all regions, the ICC was significantly higher (min |z| = 5.0 p < 1e-6) and the CoV (min |z| = 5.1, p < 1e-6) was significantly lower for all measurements (R1, thickness, surface area and volume, for regional and voxel based techniques) when motion correction was used (Table 2 and 3 and Figs. 4–6). Across all measures, the median ICC without motion correction was 0.46 (minimum 0.31, maximum 0.71) but increased to 0.86 (minimum 0.68, maximum 0.96) after motion correction was applied. Similarly, the median COV decreased from 6.0% (minimum 3.8%, maximum 9.7%) to 1.8% (minimum 0.9%, maximum 3.6%) after motion correction was applied.
Table 2.
The mean+/− standard deviation of intraclass correlation coefficients for cortical thickness (thick.), cortical surface area (s. area), cortical volume (volume), and quantitative R1 are provided for MPnRAGE with and without motion correction for the regions of interest (ROIs) in the Destrieux and Desikan-Killan atlases. The mean ICCs are computed two different ways: ROI-based method computes the ICC of the mean values within each ROI and vertex-based computes ICCs for each vertex and averages the ICC across all vertices within an ROI. Differences between original and motion corrected values are significant for parameters.
| Intraclass Correlation Coefficient (ICC) |
|||||||||
|---|---|---|---|---|---|---|---|---|---|
| Destrieux Atlas |
Desikan–Killian (DK) Atlas |
||||||||
| Thick. | s. area | Volume | qR1 | Thick. | s. area | Volume | qR1 | ||
|
| |||||||||
| MPRAGEPROMO | ROI-based | 0.49±0.30 | 0.60±0.22 | 0.57± 0.27 | – | 0.50±0.29 | 0.62±0.22 | 0.59±0.22 | – |
| vertex-based | 0.45±0.15 | 0.46±0.15 | |||||||
|
| |||||||||
| MPnRAGE w/o motion correction | ROI-based | 0.50±0.16 | 0.69±0.12 | 0.63± 0.14 | 0.33±0.10 | 0.54±0.13 | 0.71±0.09 | 0.63±0.15 | 0.33±0.10 |
| vertex-based | 0.43±0.10 | 0.31±0.09 | 0.43±0.06 | 0.31±0.07 | |||||
|
| |||||||||
| MPnRAGE w/motion correction | ROI-based | 0.90±0.08 | 0.93±0.09 | 0.90±0.11 | 0.82±0.12 | 0.88±0.11 | 0.96±0.05 | 0.94±0.07 | 0.83±0.11 |
| vertex-based | 0.83±0.09 | 0.69±0.12 | 0.82±0.08 | 0.68±0.11 | |||||
Table 3.
The mean+/− standard deviation of coefficients of variation (CoV) for cortical thickness (thick.), cortical surface area (s. area), cortical volume (volume), and quantitative R1 are provided for MPnRAGE with and without motion correction for the regions of interest (ROIs) in the Destrieux and Desikan-Killan atlases. The mean CoVs are computed two different ways: ROI-based method computes the CoV of the mean values within each ROI and vertex-based computes CoVs for each vertex and averages the CoV across all vertices within an ROI. Differences between original and motion corrected values are significant for parameters.
| Coefficient of Variation (CoV) |
|||||||||
|---|---|---|---|---|---|---|---|---|---|
| Destrieux Atlas |
Desikan-Killian (DK) Atlas |
||||||||
| Thick. | s. area | Volume | qR1 | Thick. | s. area | Volume | qR1 | ||
|
| |||||||||
| MPRAGE PROMO | ROI-based | 3.0±2.4 | 6.9±7.2 | 7.2±7.6 | – | 2.8±2.3 | 5.2±6.1 | 5.6±6.9 | – |
| vertex-based | 5.1±3.6 | 5.1± 3.5 | |||||||
| MPnRAGE w/o motion correction | ROI-based | 4.0±3.0 | 8.8±7.3 | 9.7±8.1 | 4.2±4.0 | 3.8±2.9 | 6.9±6.5 | 8.0±8.0 | 4.4±4.3 |
| vertex-based | 7.0±4.6 | 4.8±3.8 | 7.4±4.9 | 5.1±4.0 | |||||
| MPnRAGE w/motion correction | ROI-based | 1.3±0.4 | 3.1±0.5 | 3.6±0.7 | 0.9±0.4 | 1.2±0.4 | 1.6±0.4 | 1.9±0.8 | 0.9±0.3 |
| vertex-based | 2.7±0.7 | 1.7±0.5 | 2.9±0.7 | 1.9±0.5 | |||||
3.6. Power analysis
The measurement error for the motion corrected datasets for the various regions of the Destrieux and DK atlases are shown in Fig. 7 and demonstrate a wide range of measurements errors across each atlas. Region of interested based R1 and cortical thickness measures have about 1–1.5% error. Vertex based R1 measures have about 2% (DK atlas) and 2–3% (Destrieux atlas), while cortical thickness has about 3–4% measurement error. Surface area and volume have about 2–4% measurement error. Results for each region and atlas are given in Supplementary Tables 9–10. Using these data, the required sample sizes to detect group differences at a significance level of 0.05 with a power of 0.90 using a two-sided t-test are listed in Table 4 for a range of effect sizes and measurement errors.
Fig. 7.
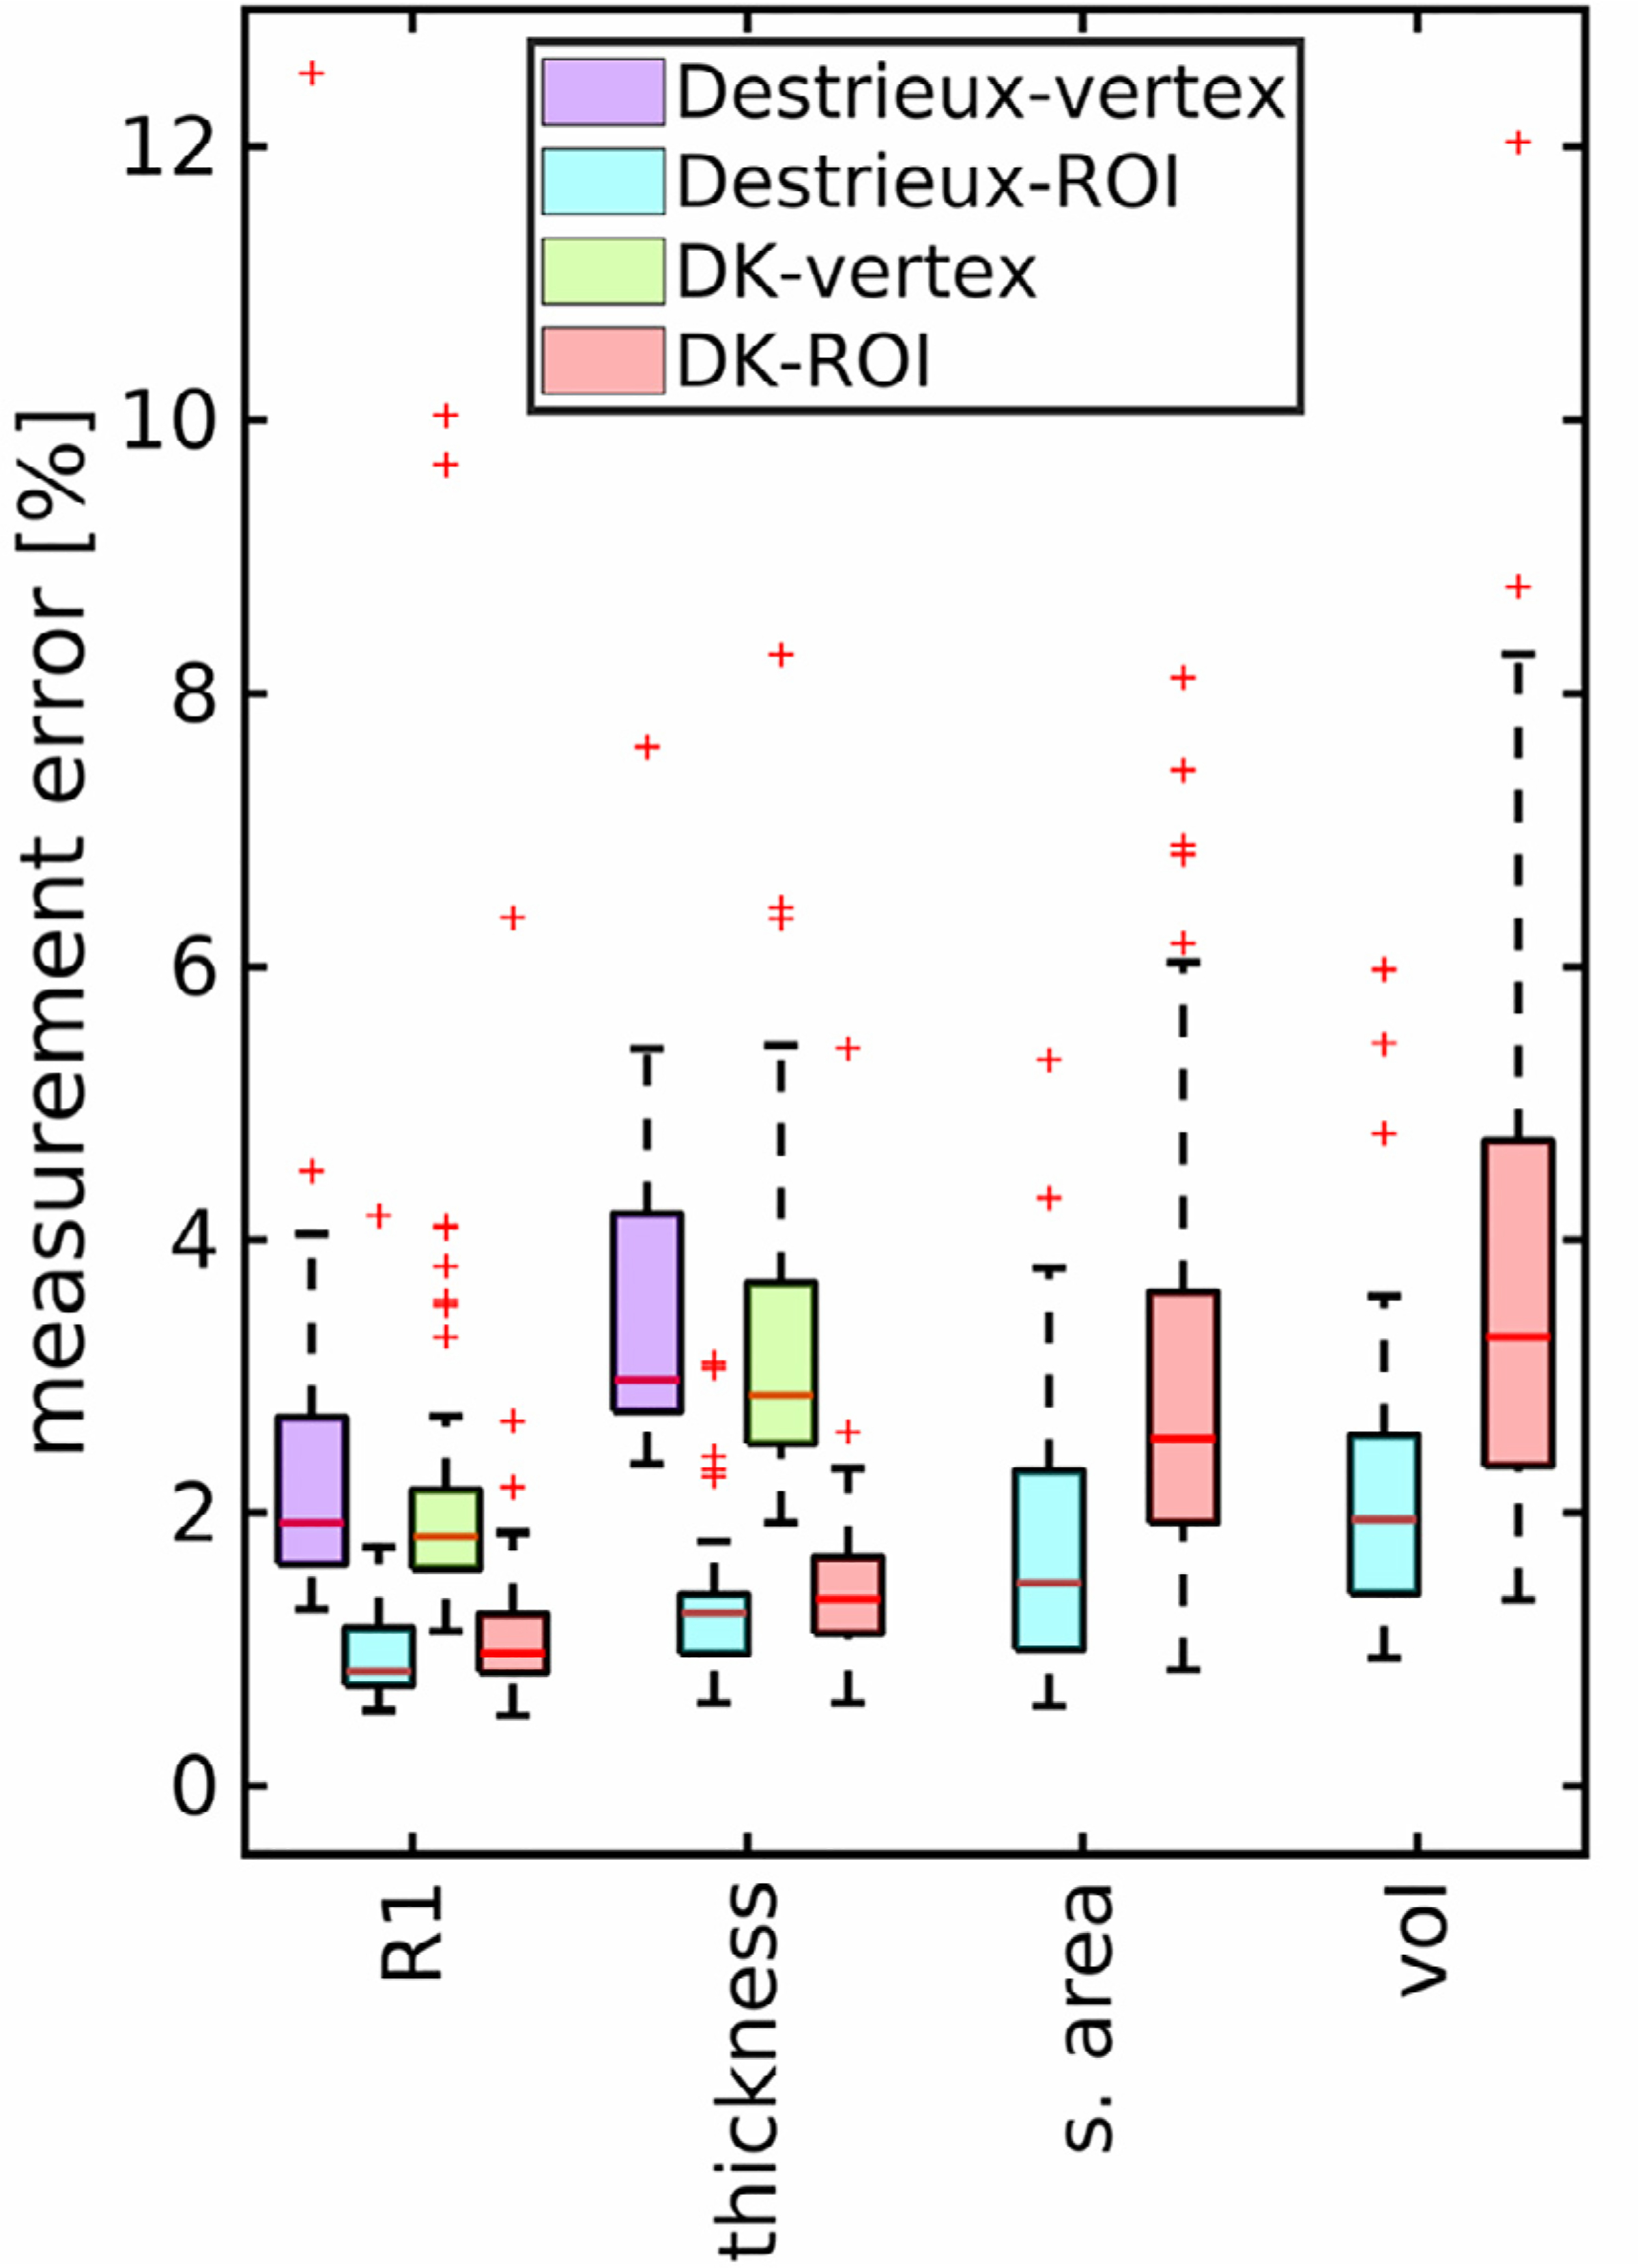
Box plots show the range of measurement errors (standard deviations × 100%) for the various regions of the Destrieux and Desikan-Killian (DK) Atlases for MPnRAGE. One in the Destrieux atlas had measurements errors outside the range of the plot (34% and 27%) for surface area and volume, respectively.
Table 4.
Sample size estimates to detect certain percent differences at a significance level of 0.05, two-sided t-test with power of 0.9.
| Effect size (%) |
|||||
|---|---|---|---|---|---|
| 0.5 | 1 | 2 | 3 | 5 | |
| Measurement error (%) | Number of subjects per group | ||||
|
| |||||
| 1a | 86 | 23 | 7 | 4 | 3 |
| 2b | 338 | 86 | 23 | 11 | 5 |
| 3c | 758 | 191 | 49 | 23 | 9 |
| 4d | 1346 | 338 | 86 | 39 | 15 |
| 5e | 2103 | 527 | 133 | 60 | 23 |
Approximate effect size for 50% of R1 region of interest (ROI) measurements.
Approximate effect size for all R1 and thickness ROI measurements, 50% of R1 vertex based measures and 50% of surface area and volume measurements in Destrieux Atlas.
Approximate effect size to include nearly more than 75% of the vertex based R1 measures and 50% of vertex based thickness measures.
Approximate effect size to include all R1 measures, 75% of thickness measurements, and greater than half of the surface area and volume measurements.
Approximate effect size to include almost 100% of all regions for all measures.
3.7. Characterization of motion and its relation to parameter measurement, test-retest, and bias
A bar graph showing the motion metric for each MPnRAGE scan is shown in Fig 8. The mean motion metric for each subject ranged from 0.4 mm to 2.3 mm with a mean and standard deviation of 1.2 mm and 0.7 mm respectively. The Wilcoxon rank sum tests failed to reject the null hypothesis of equal medians between the first and second scans (p = 0.21), first and third scans (p = 0.03), and second and third scans (p = 0.75) when corrections for false discoveries was performed with the Benjamini-Hochberg procedure (Benjamini & Hochberg, 1995) at the significance level of p = 0.05. The ASD comparison study had a mean motion metric of 1.3 mm and a standard deviation of 1.2 mm. Moreover, the maximum motion metric of any MPnRAGE scan in the test-retest study, 3.4 mm, corresponded to the 90% percentile of the larger ASD study. The population-mean motion maps for the cortical surfaces for the test-retest and ASD comparison study (Fig. 9) are remarkably similar, with an average difference of 0.02 mm +/− 0.03 mm per vertex. Averaged across all vertices, mean cortical motions are 0.87 mm +/− 0.70 mm for the test-retest study and 0.85 mm +/− 0.89 mm for the ASD comparison study. Box-and-whisker plots of the mean cortical motions for all subjects are shown in Fig. 10. The range of mean cortical motions of the test-retest study represent 95% of the motions observed in the ASD comparison study. Similarly to the motion metric, the Wilcoxon rank sum tests failed to reject the null hypothesis of equal medians between the first and second scans (p = 0.34), first and third scans (p = 0.04), and second and third scans (p = 0.54) when corrections for false discoveries was performed with the Benjamini-Hochberg procedure (Benjamini & Hochberg, 1995) at the significance level of p = 0.05. The Pearson correlation between the motion metric (Eq. (2)) and the mean cortical motion is 0.97.
Fig. 8.
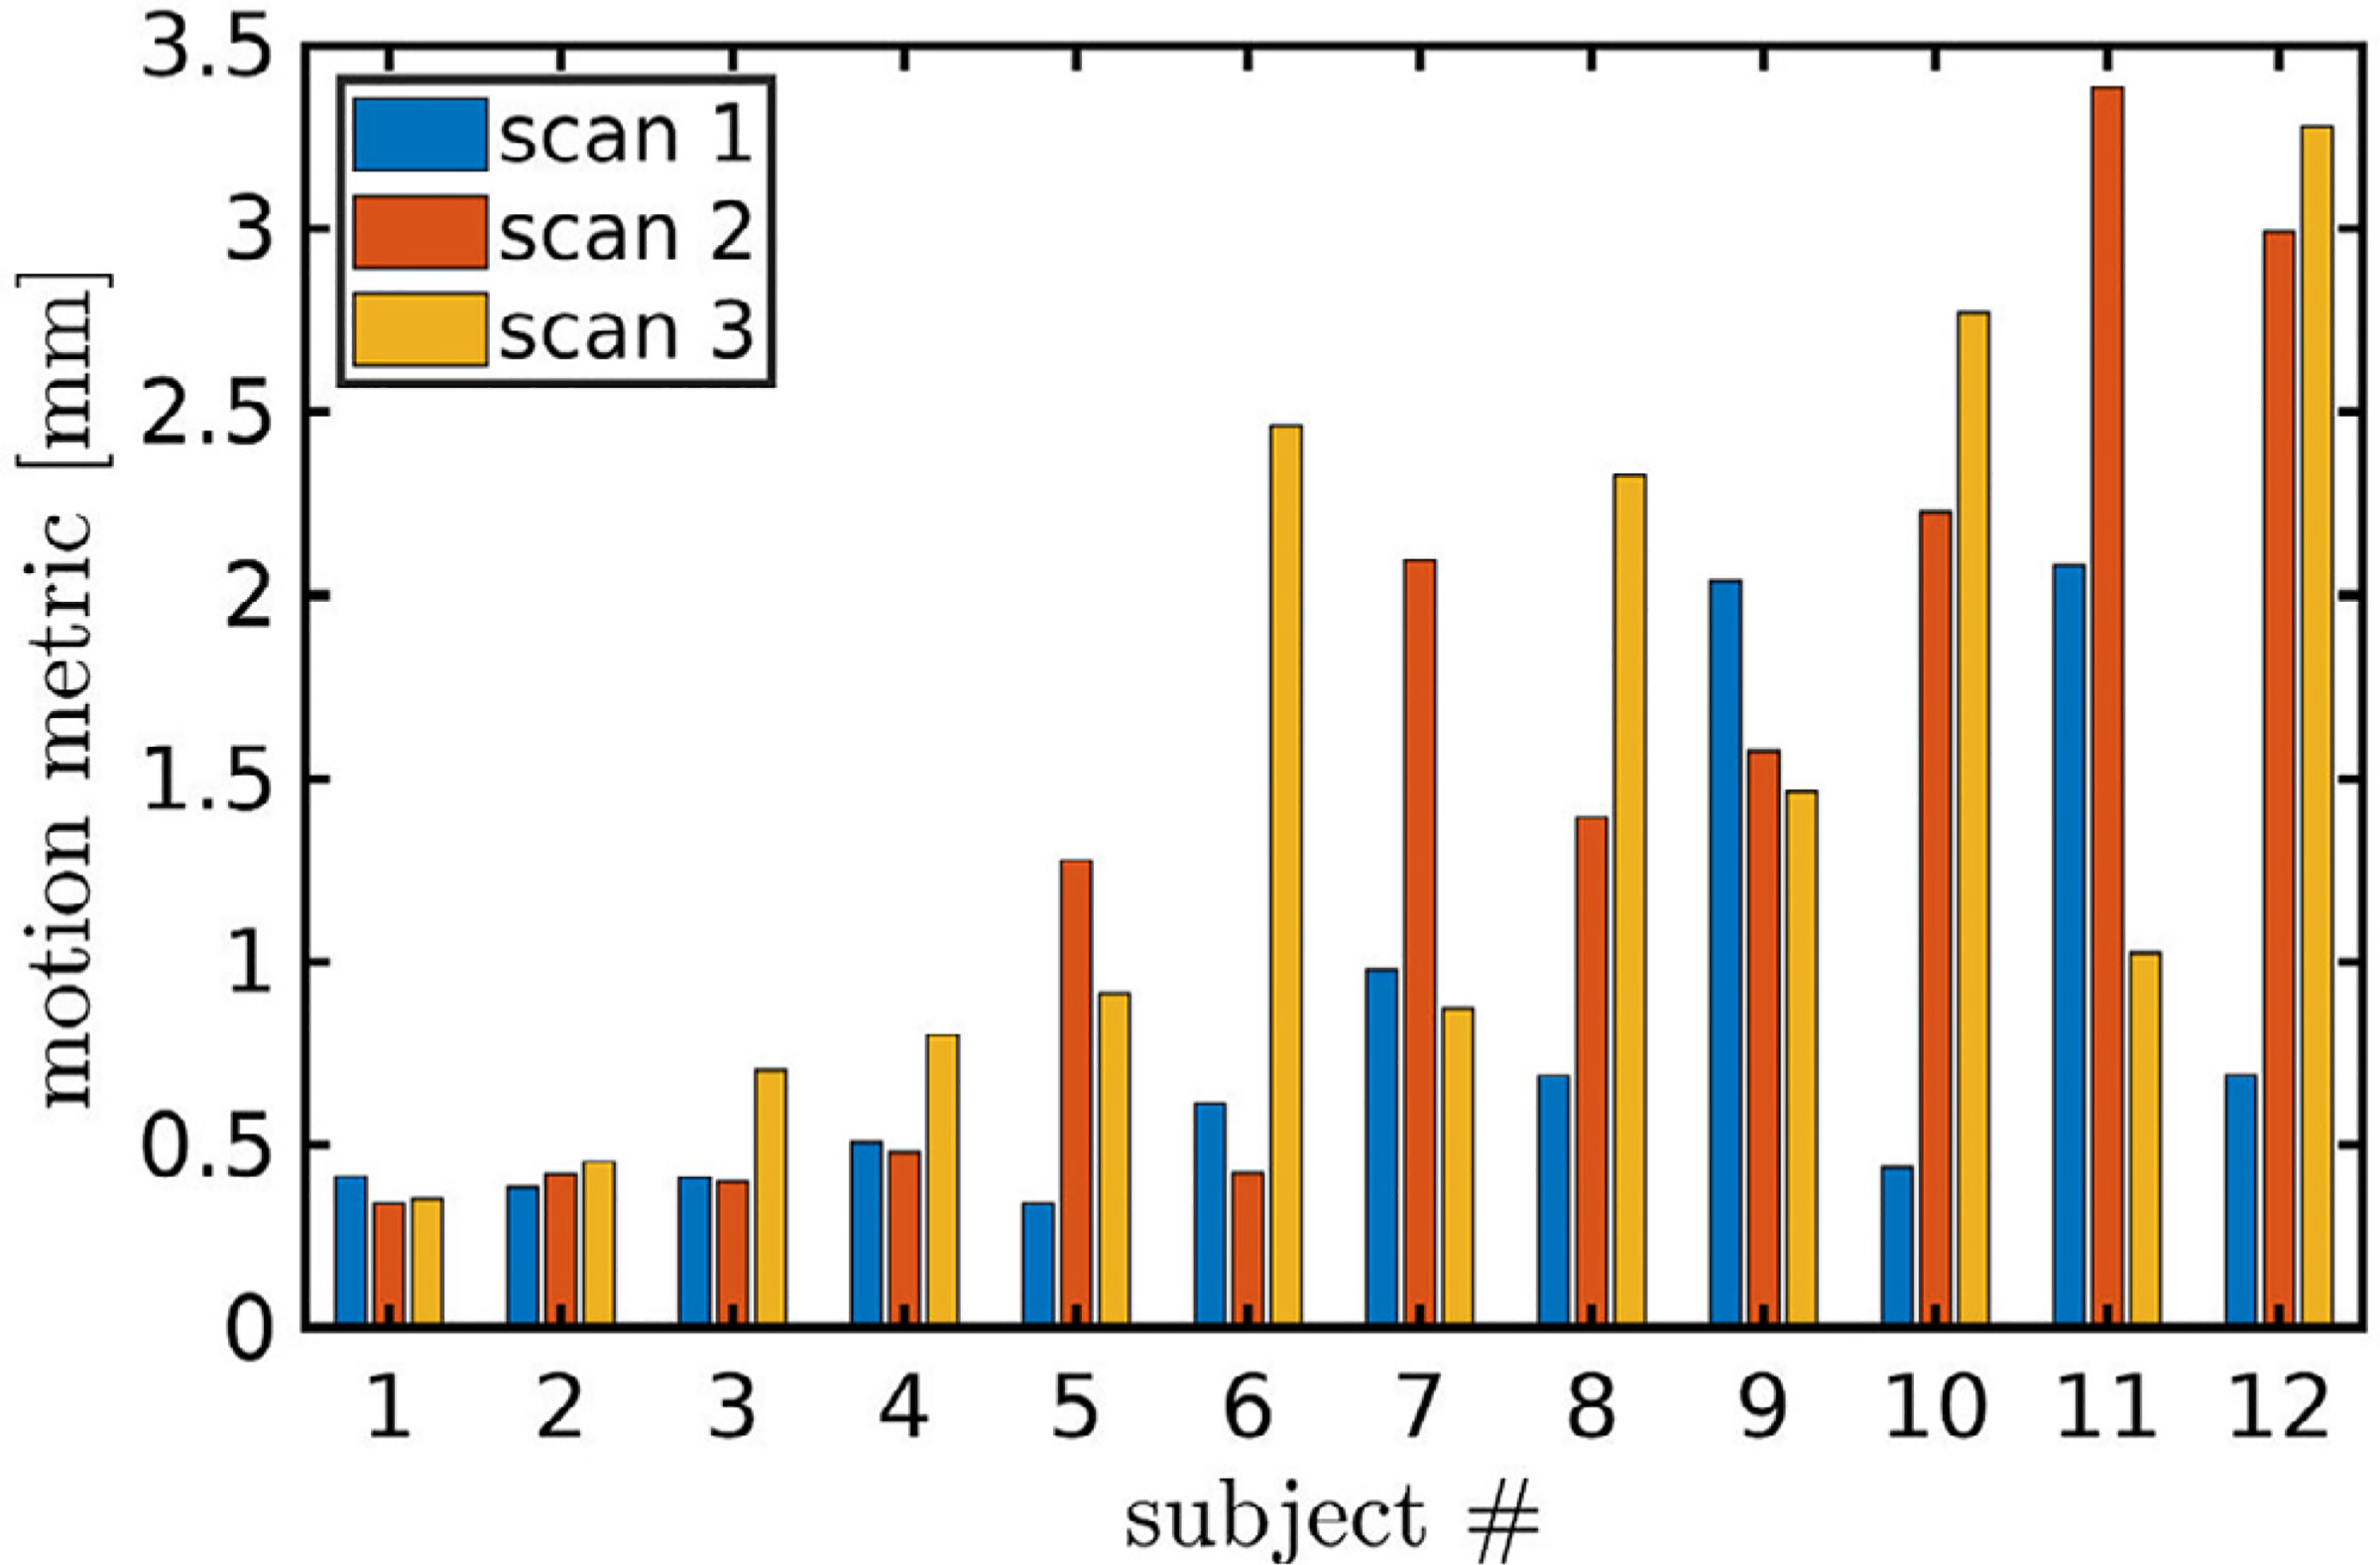
The motion metric, Eq. (2), is shown for each of three MPnRAGE scan from all twelve participants.
Fig. 9.
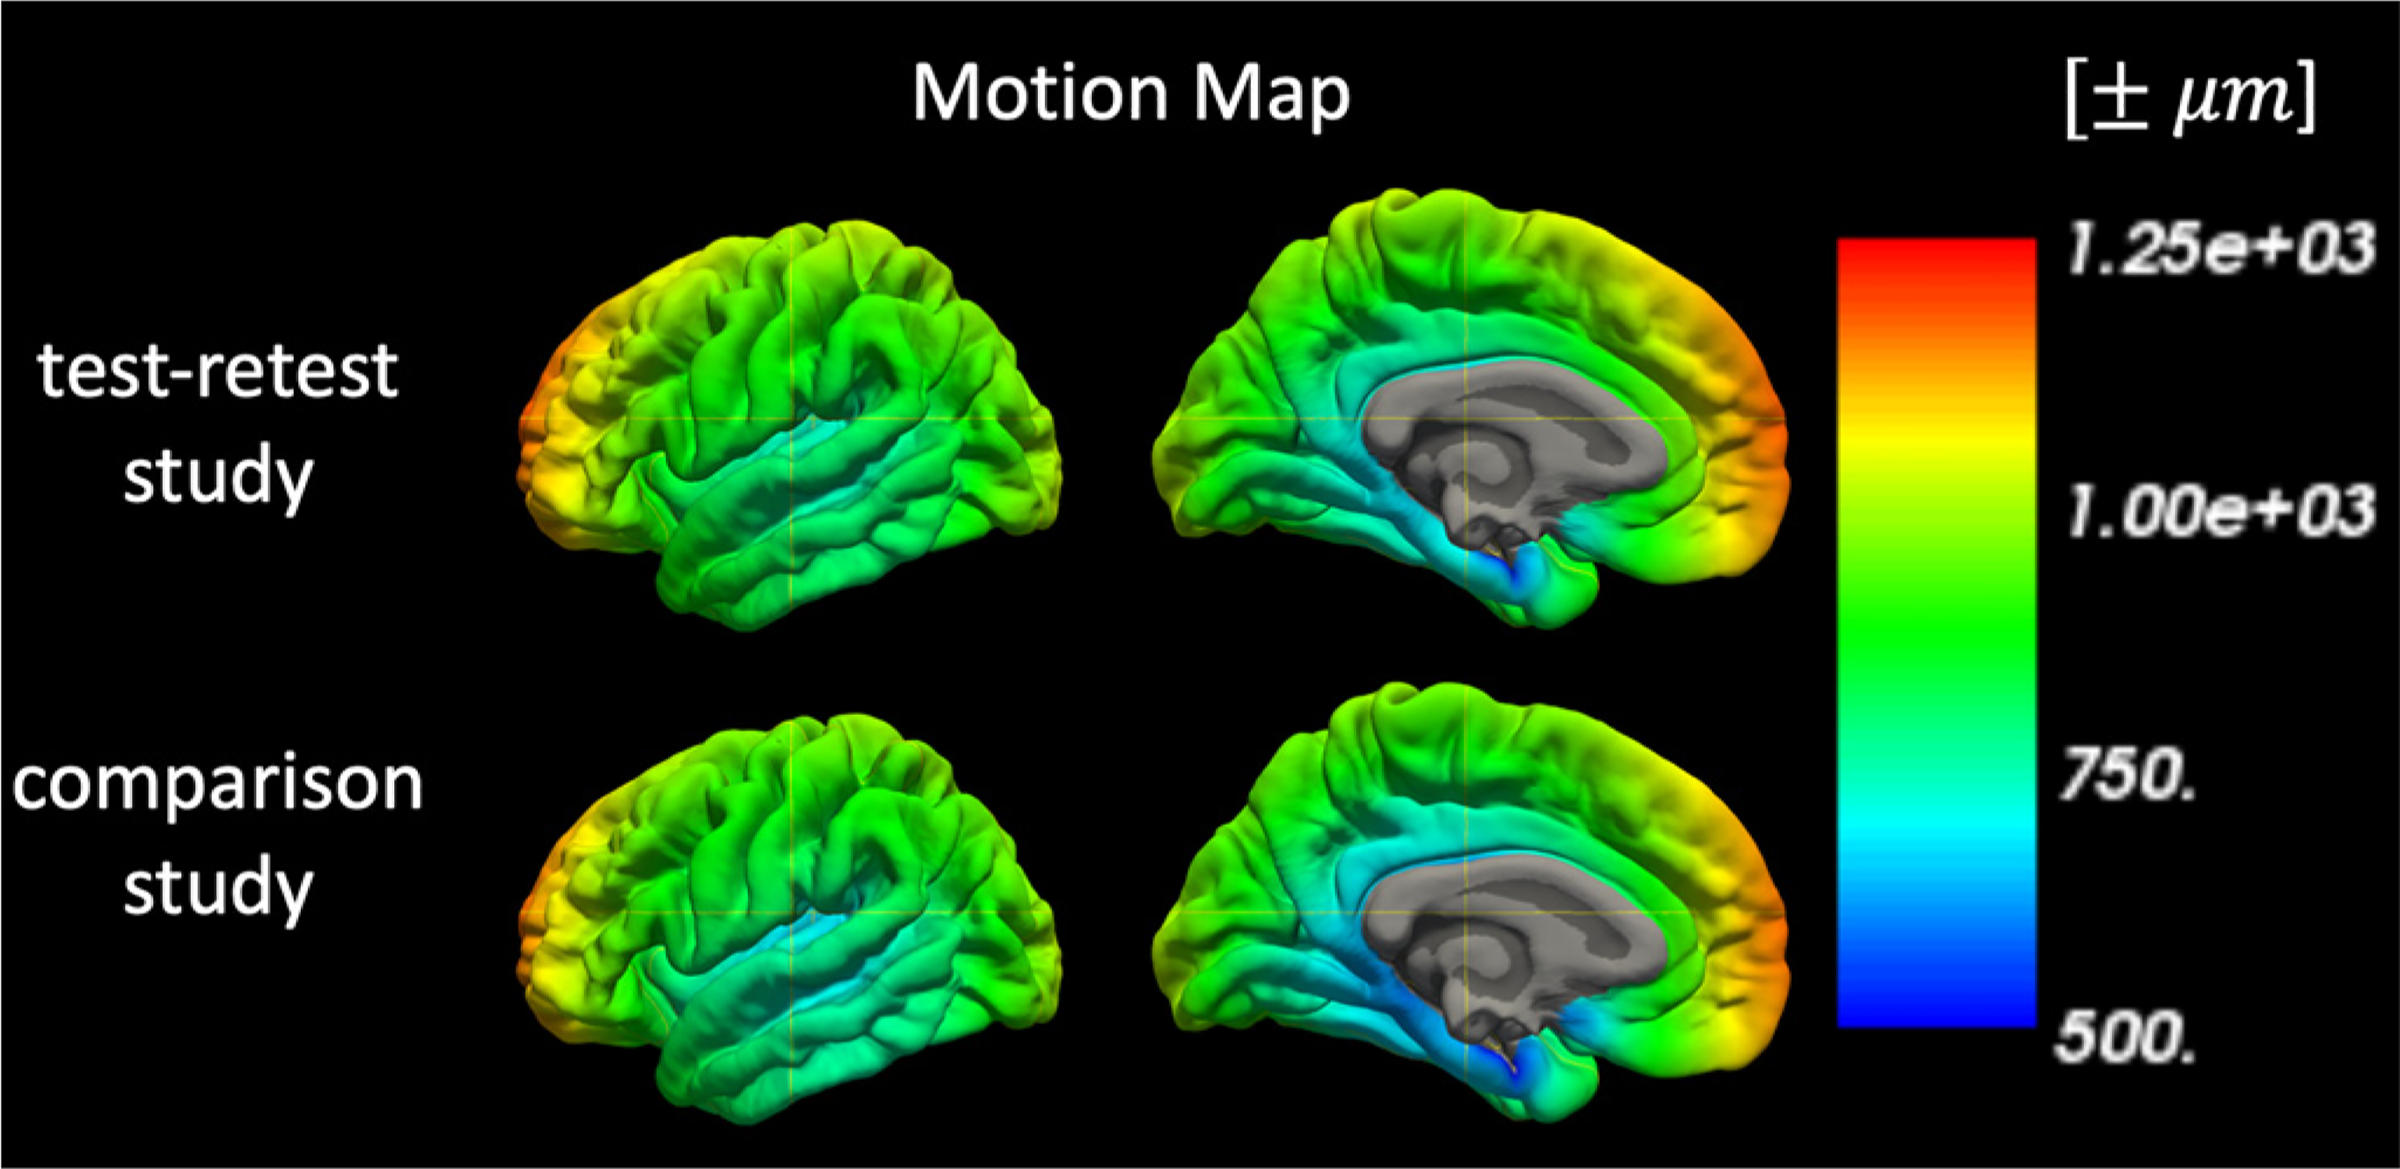
Population average motion maps of the test-retest and comparison studies showing the positional uncertainties (in micrometers) of each vertex of the cortical surface throughout the exam.
Fig. 10.
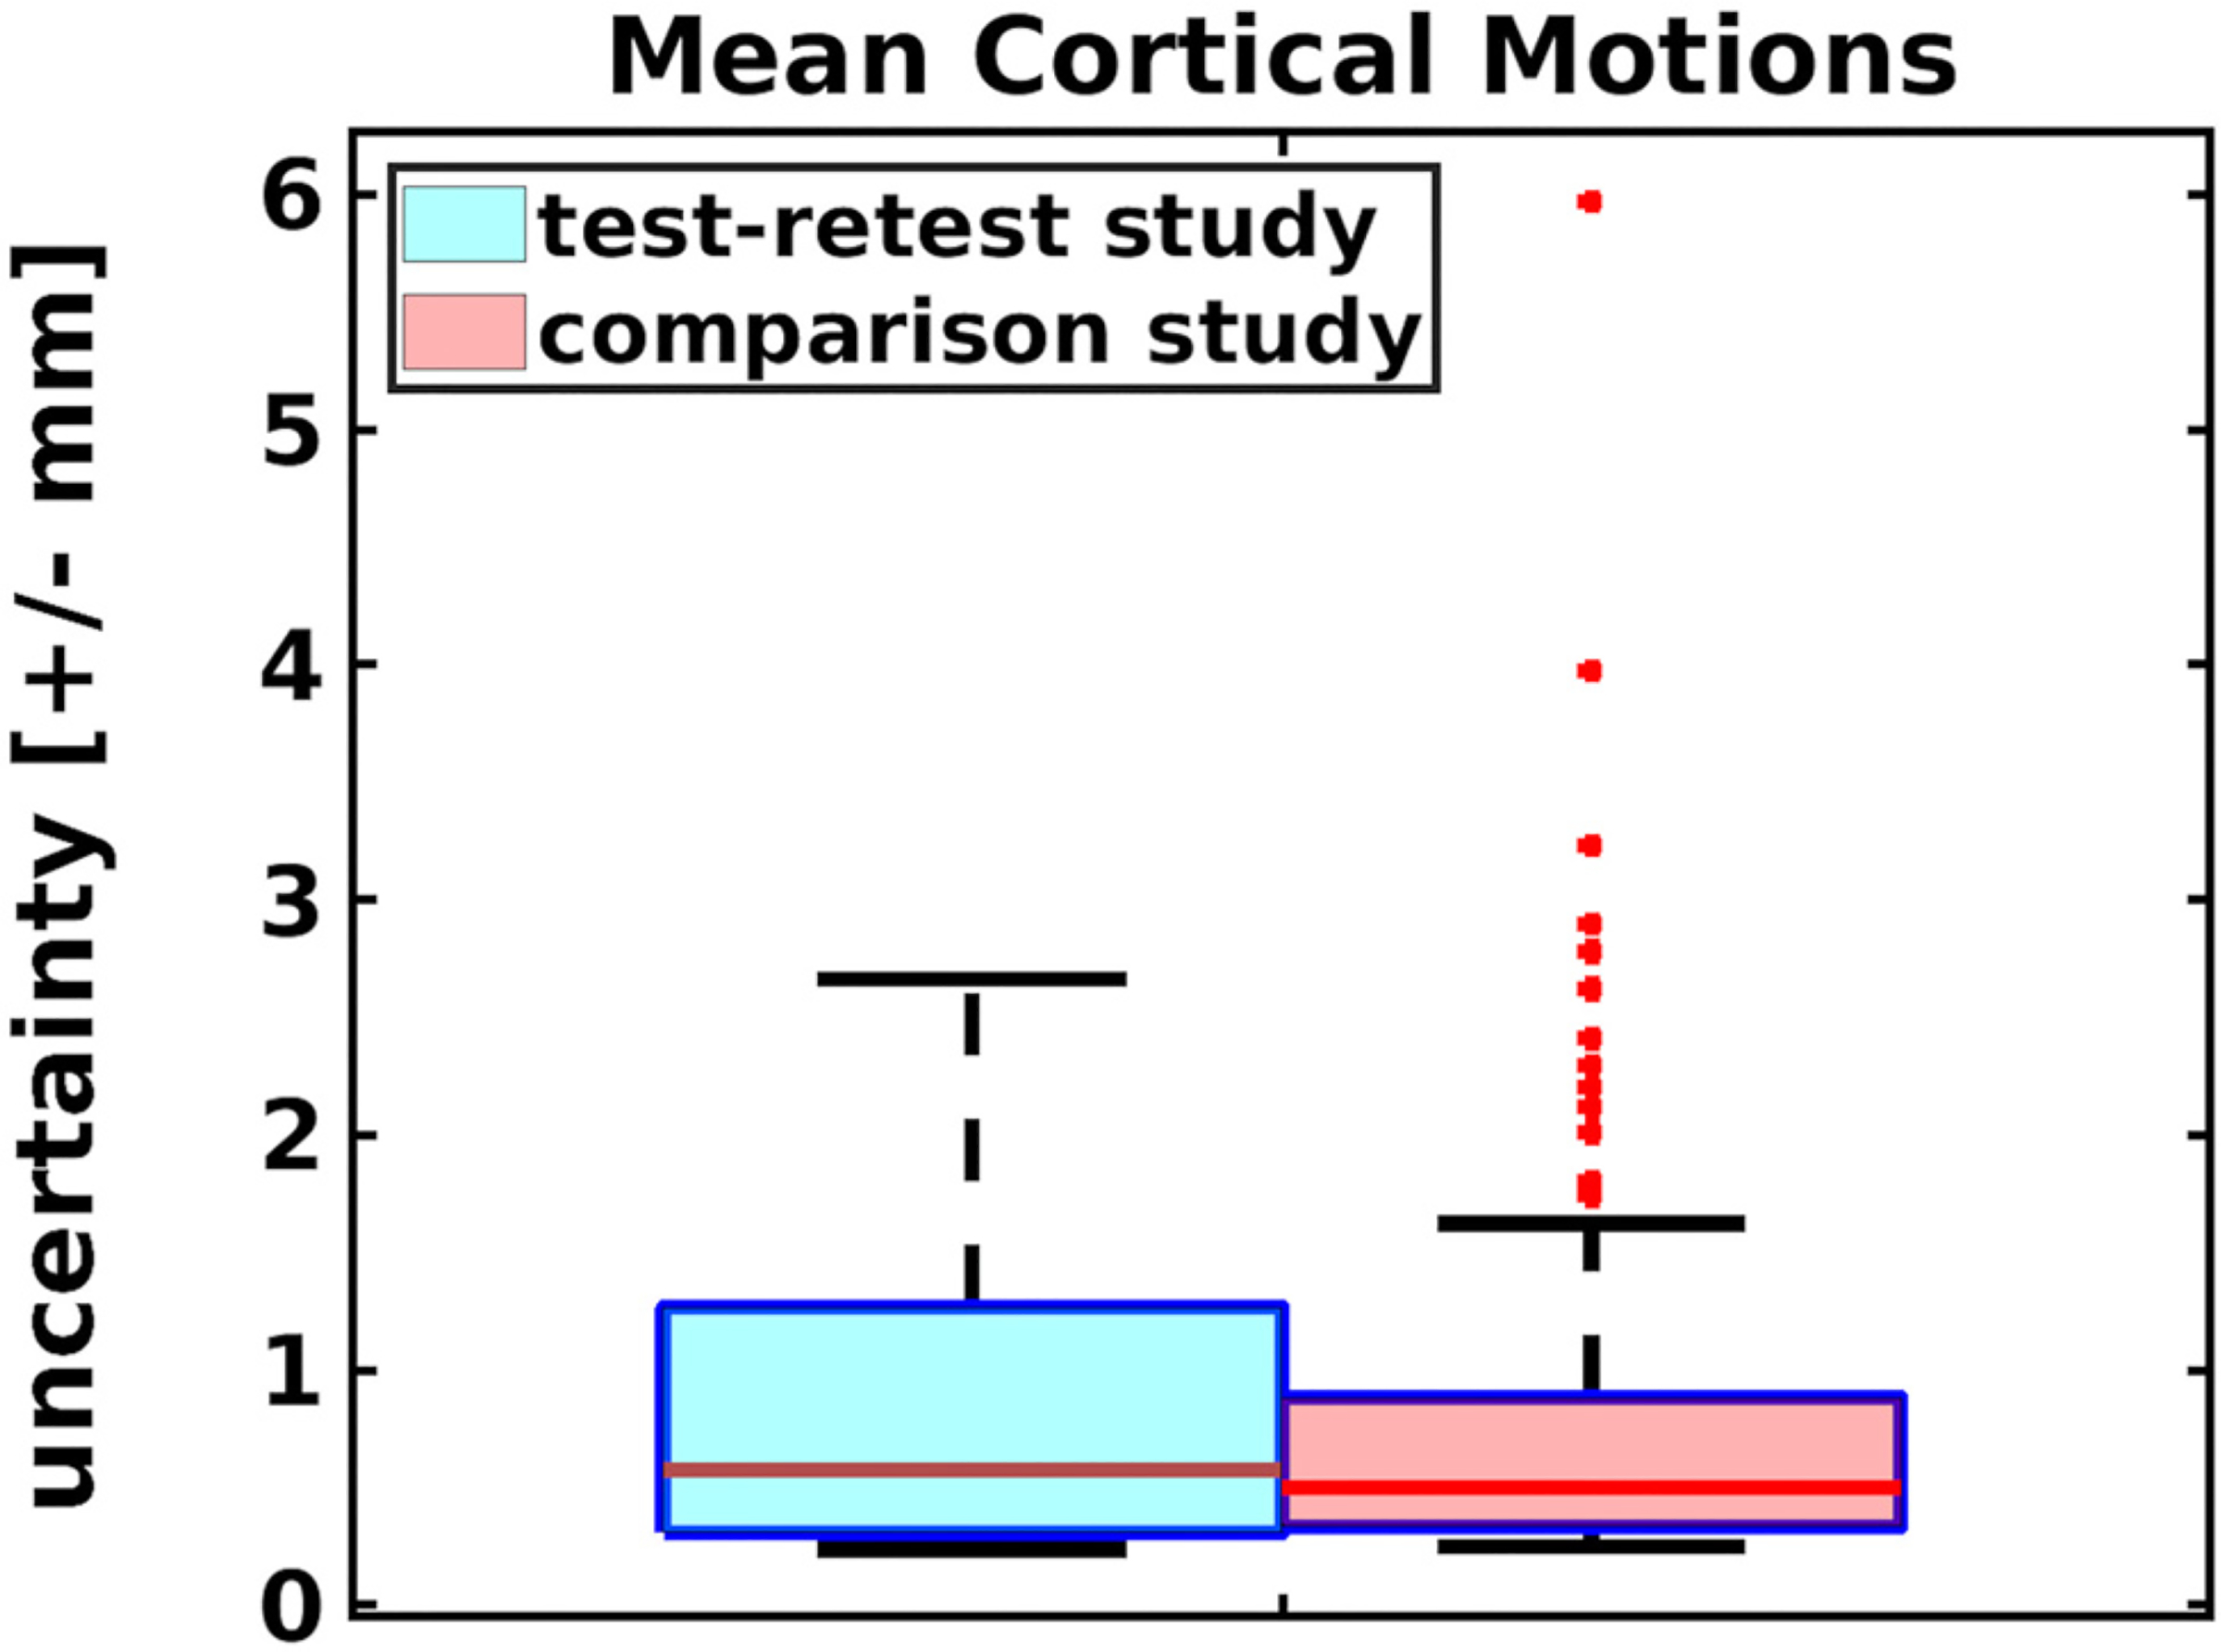
Box-and-whisker plots of the mean cortical motions (in mm) of the subjects in the test-retest and comparison study show that the smaller test-retest study provides a good representation of the range of motions encountered in a larger study.
Without motion correction, a strong (r2 > 0.69, p < 0.007) linear relationship with a positive slope was observed between the coefficients of variation of all four MPnRAGE measures and the motion metric across both the Destrieux and DK-Atlases. In the Destrieux atlas, after motion correction, the slope was no longer significant for thickness (p = 0.065), surface area (p = 0.13), and volume (p = 0.15) when corrections for false discoveries was performed with the Benjamini-Hochberg procedure (Benjamini & Hochberg, 1995) at the significance level of p = 0.05. The slope remained significant for R1 (p = 0.007), but the model only shows the coefficient of variation ranging from 0.6% to 1.3%, which makes it the best performing of all parameters in terms of coefficient of variation. Similarly, for the Destrieux Atlas, after motion correction, the slope was no longer significant for thickness (p = 0.04), surface area (p = 0.24), and volume (p = 0.19) when corrections for false discoveries was performed with the Benjamini-Hochberg procedure (Benjamini & Hochberg, 1995) at the significance level of p = 0.05. The slope remained significant for R1 (p = 0.005), but the model only shows the coefficient of variation ranging from 0.6% to 1.4%, which makes it the best performing of all parameters in terms of coefficient of variation. Moreover, Fig. 11 show that motion correction improved the coefficients of variation even when the total amount of motion was small. To provide an overview of how motion impacted the coefficients of variation, Fig. 12 shows a box-and-whisker plot of the coefficients of variation for regional cortical thickness measurements (Destrieux Atlas) for each subject using the same subject indexing as used in Fig. 8. This Fig. also shows that the PROMO MPRAGE results were heavily influenced by three subjects with large motions (subjects 6, 8, and 11) suggesting that a total of five of the original twelve subjects would need to be removed to have similar performance as the motion corrected MPnRAGE. Similarly, about six uncorrected MPnRAGE exams would need to be excluded to have similar performance as motion corrected MPnRAGE. When subjects with the most motion metric were gradually discarded, eight subjects needed to be discarded until the uncorrected MPnRAGE CoV was better than the original motion corrected CoV of all twelve subjects. At that point though, the motion corrected CoV of the remaining four subjects was smaller than the uncorrected MPnRAGE CoV. An additional two subjects (ten total) had to be removed until the CoV of uncorrected MPnRAGE was less than motion corrected MPnRAGE (0.97% vs 1.00%). A similar analysis for PROMO MPRAGE showed that even the best PROMO MPRAGE case had CoV higher than the original mean CoV for motion corrected MPnRAGE with all twelve subjects.
Fig. 11.
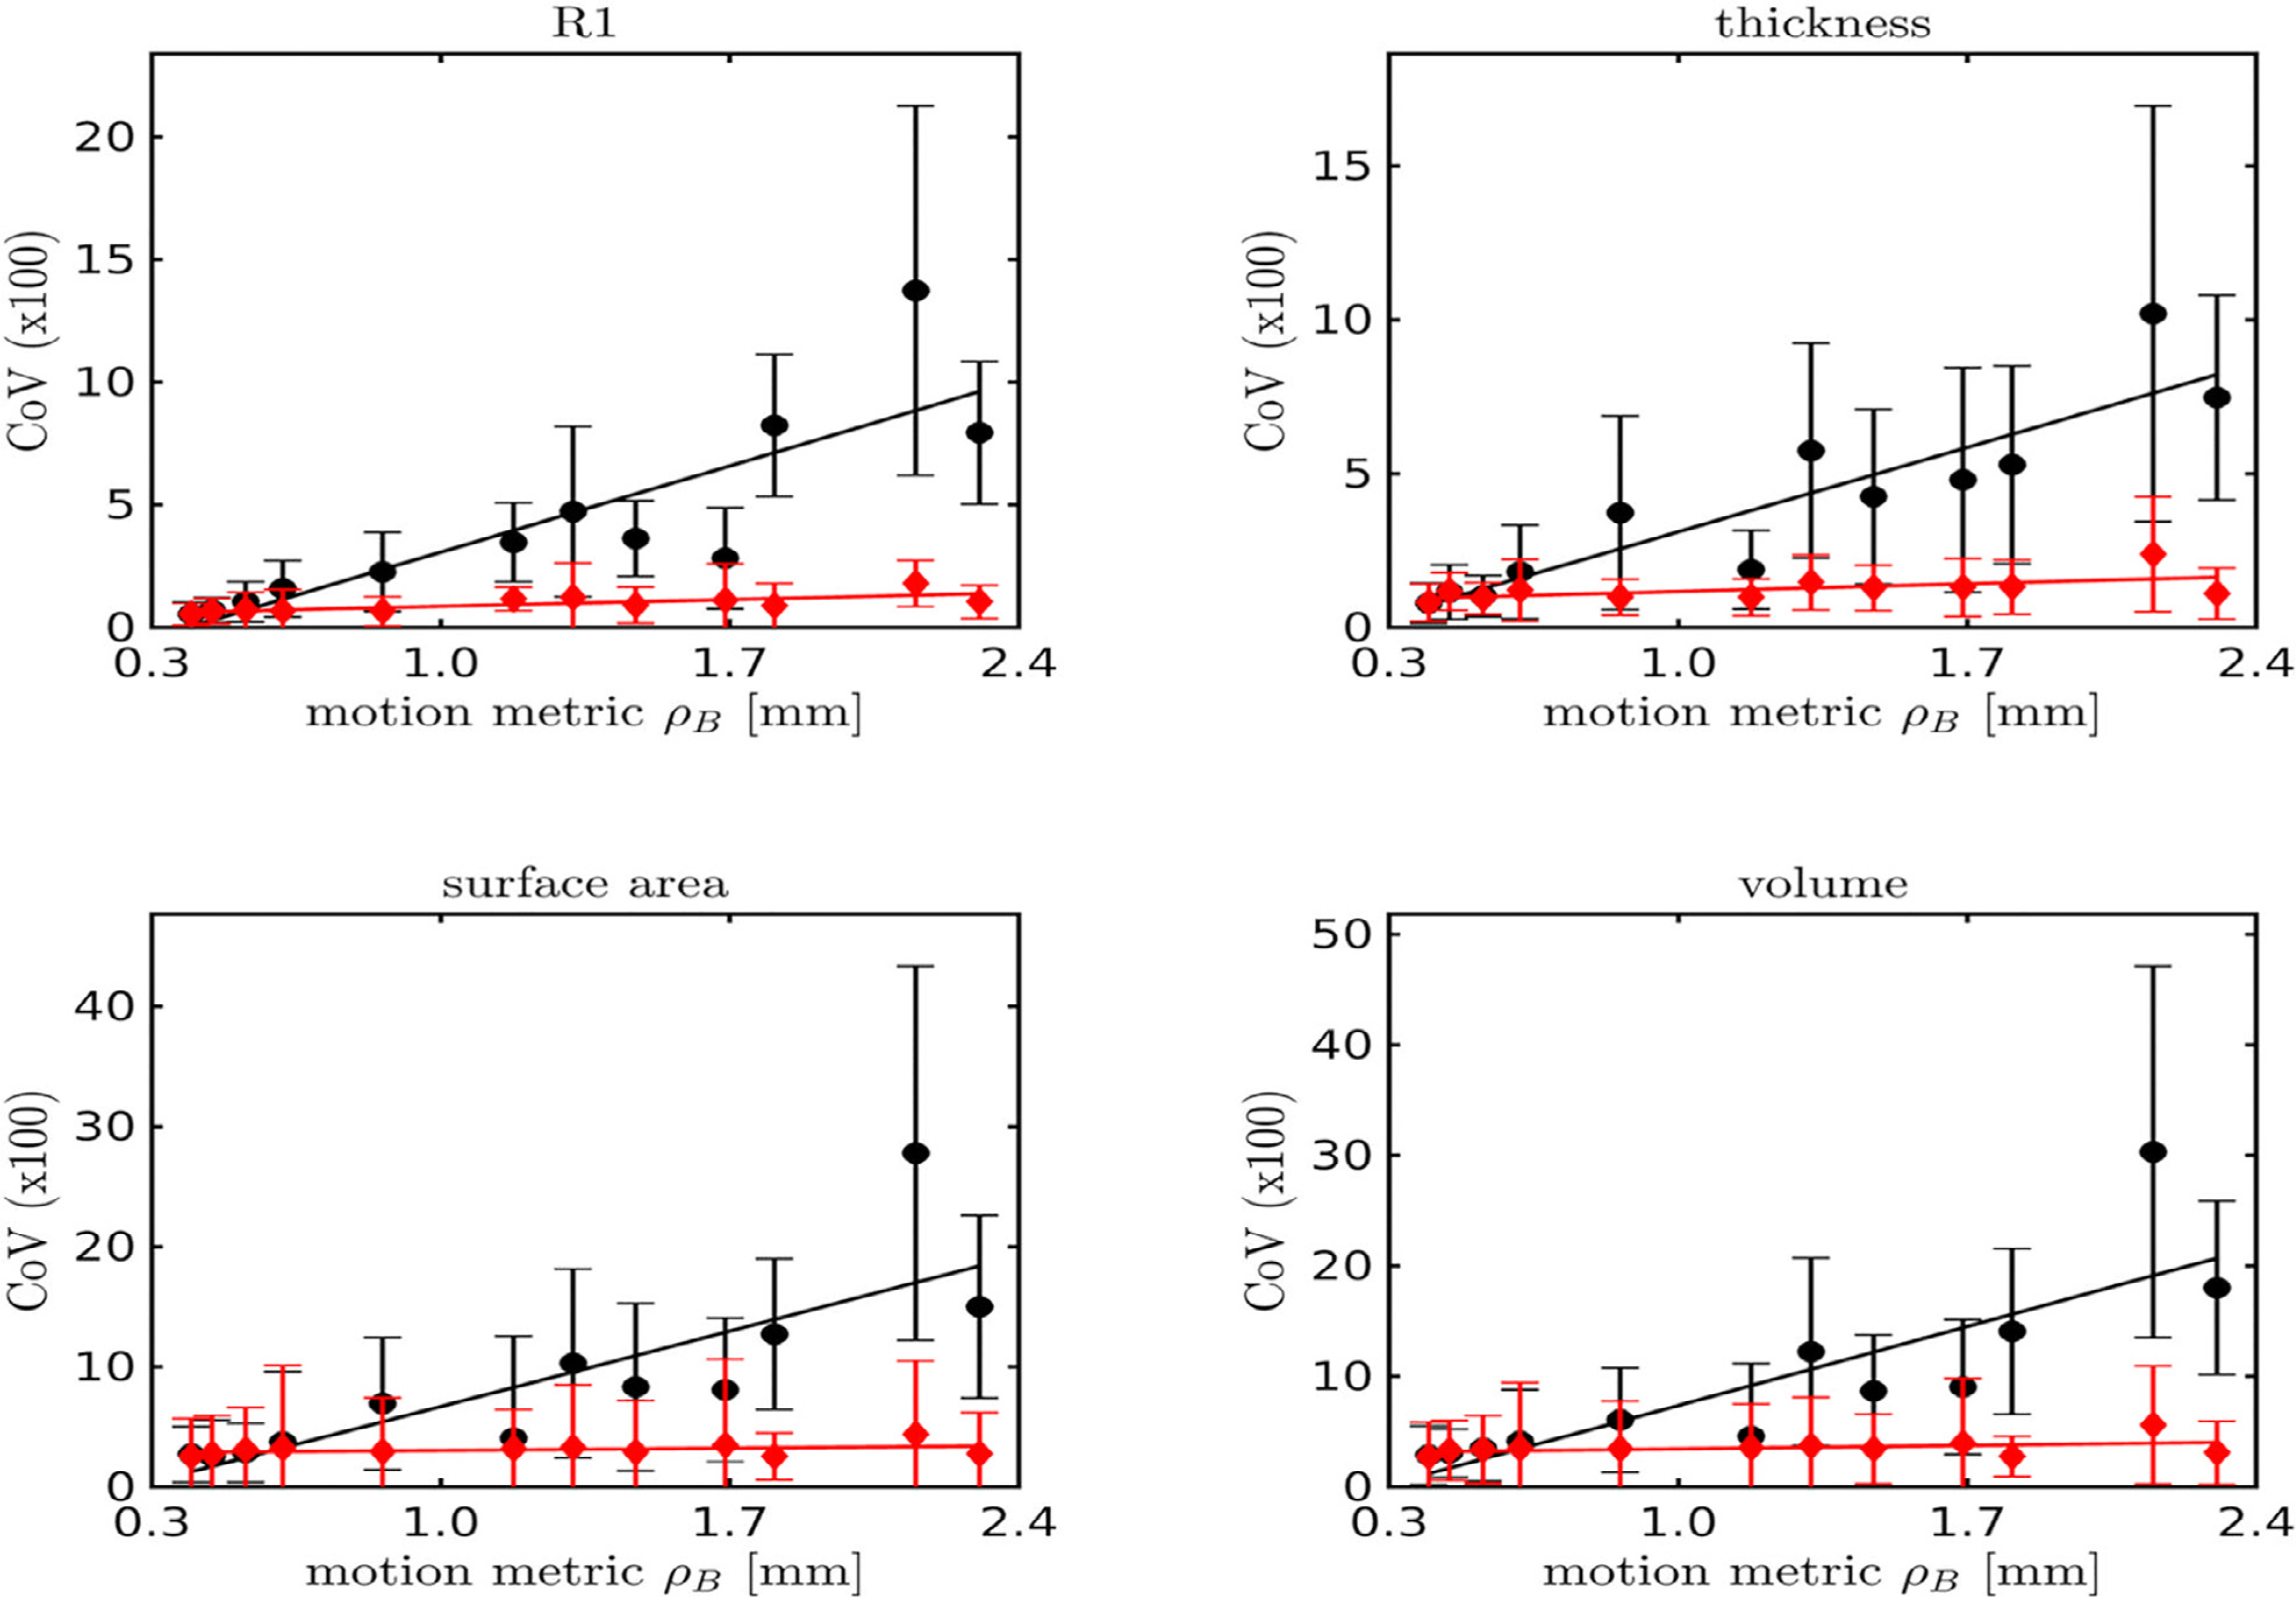
The relationship of the coefficients of variation versus motion metric is shown for uncorrected and motion corrected MPnRAGE.
Fig. 12.
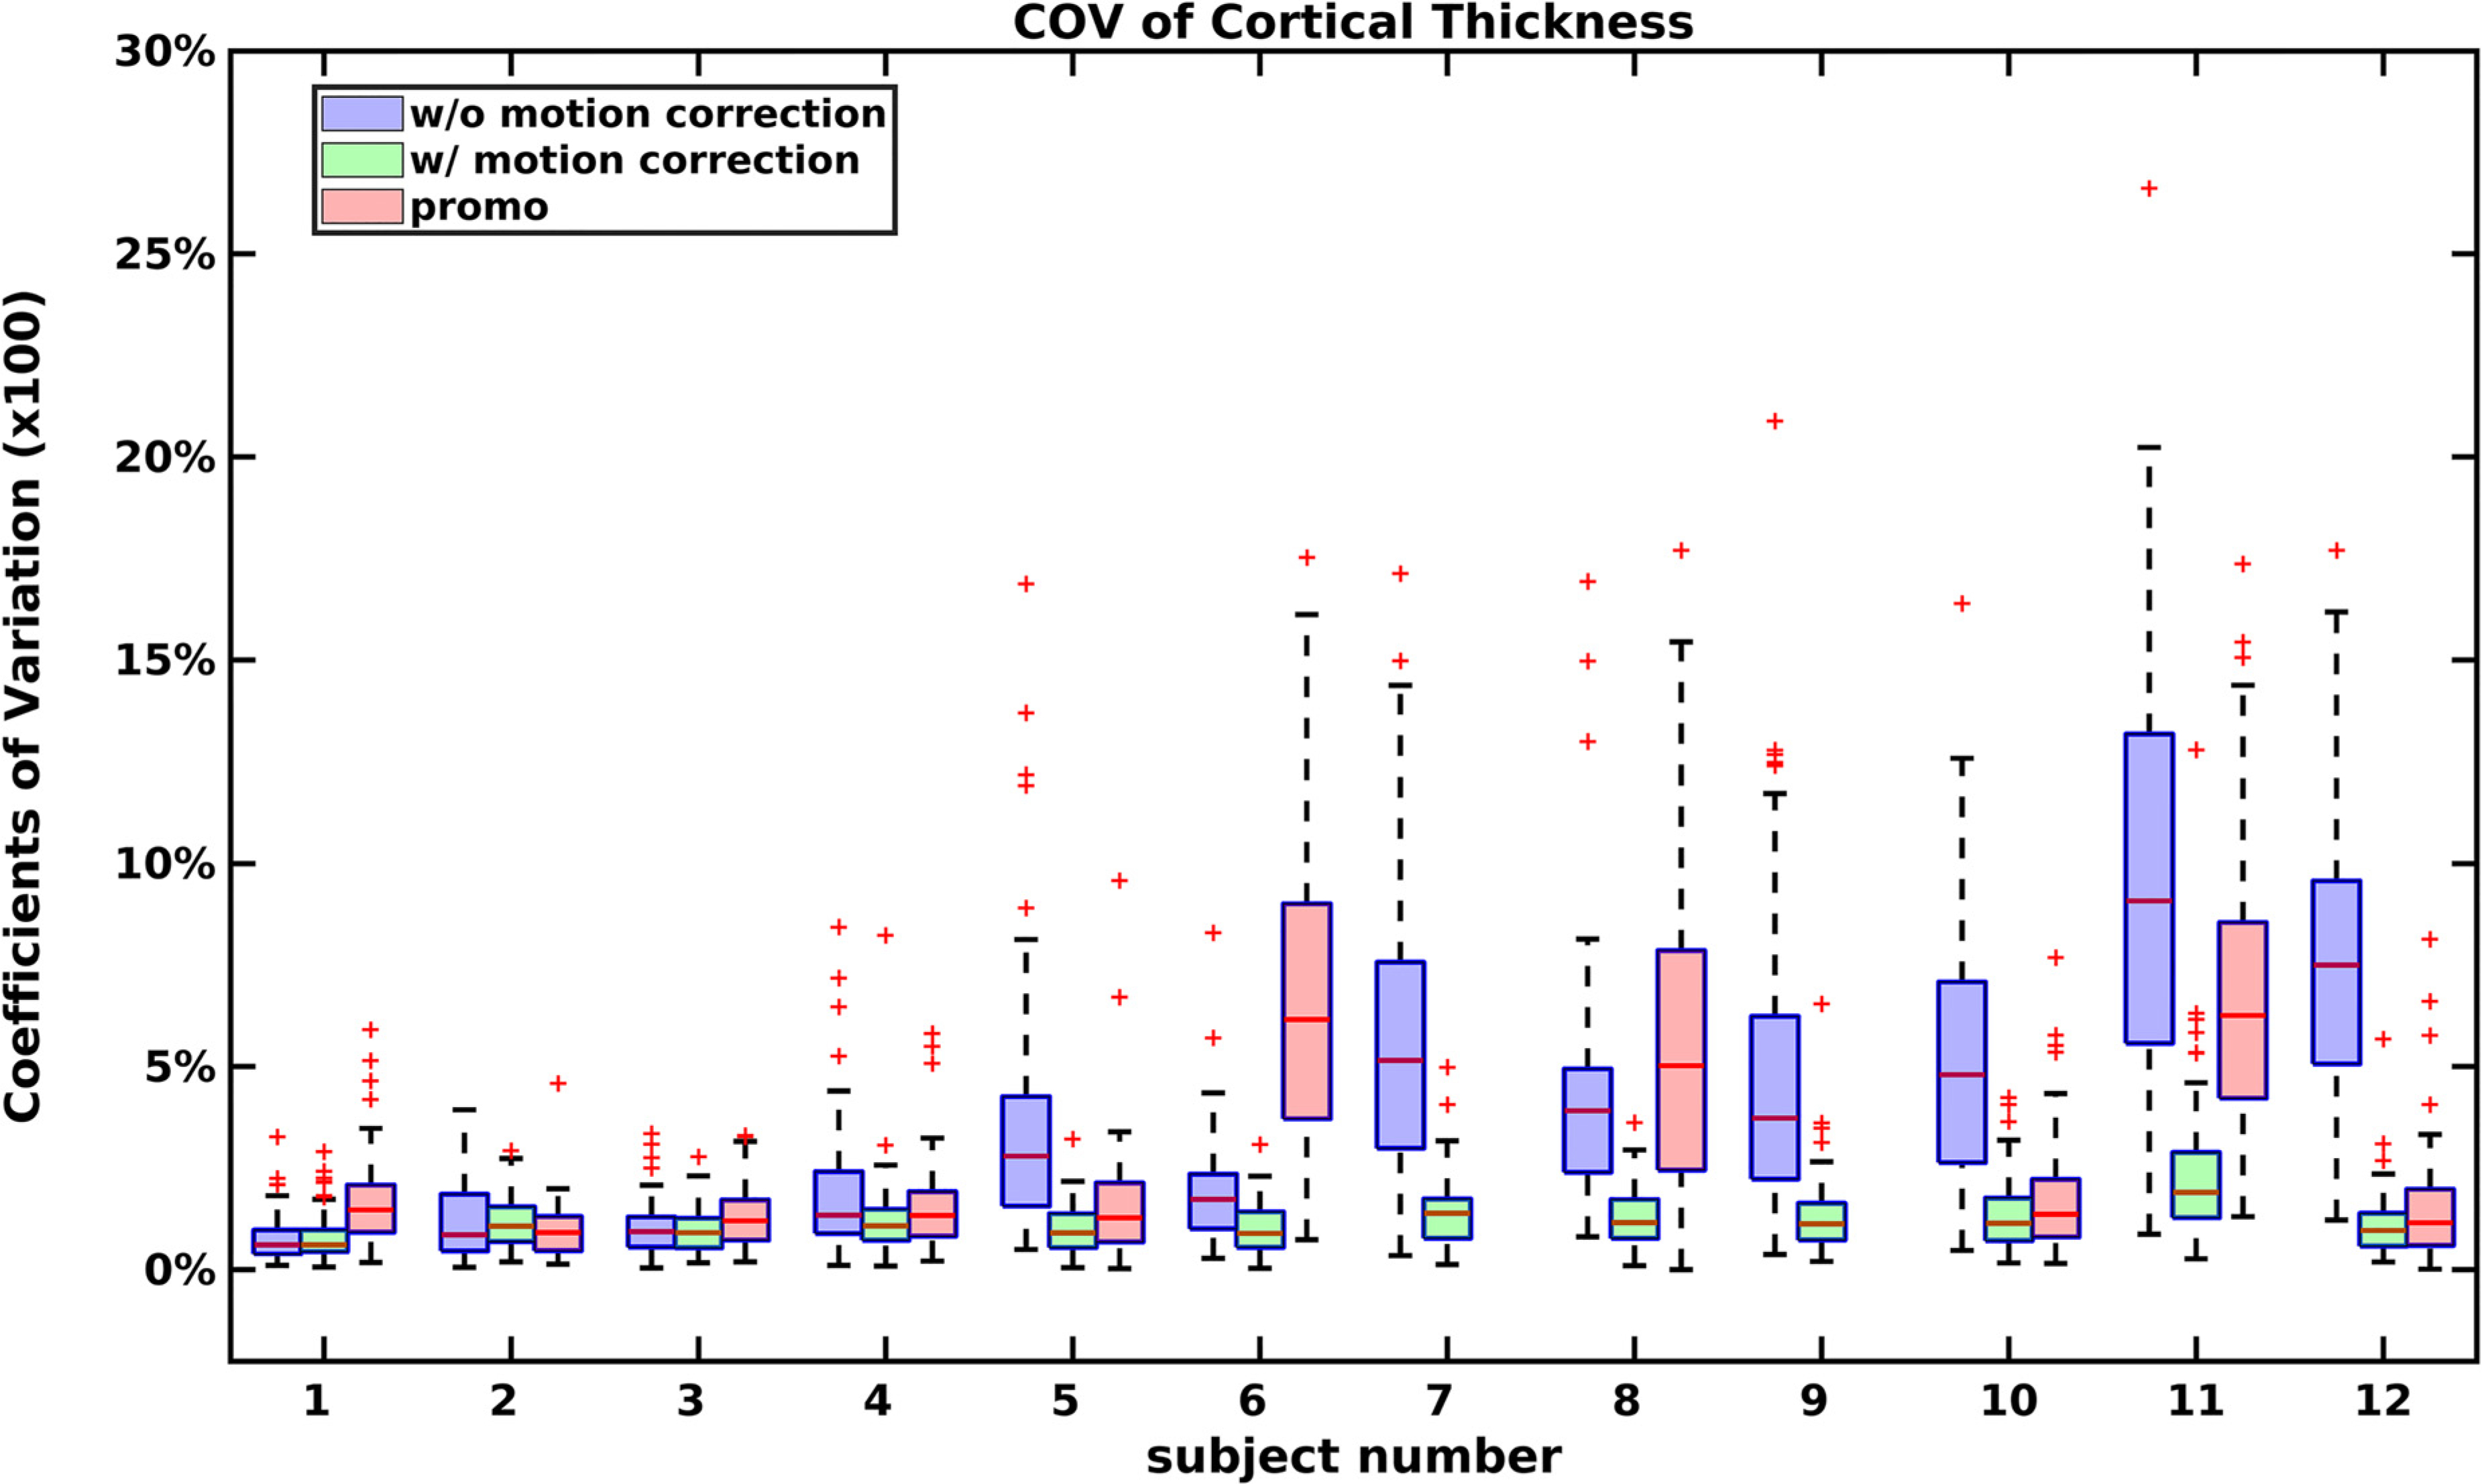
The coefficients of variation of regional cortical thickness for each subject for uncorrected and motion corrected MPnRAGE and PROMO MPRAGE for the Destrieux Atlas.
The relative bias of uncorrected motion artifacts on the measurements of R1, thickness, surface area, and volume are shown in Fig. 13 for the DK Atlas and demonstrate regional dependence of measurement bias due to motion. On average, regional values of quantitative R1 without motion correction were 5.8% ± 2.5% larger than those with motion correction, with the transverse temporal having the minimum bias of 2.9% and the rostral anterior cingulate having the maximum bias of 13.6%. Similarly, for cortical thickness the bias was −1.0% ± 3.1% with minimum biases of −0.2% at the parsorbitali and a maximum of 7.6% at the pericalcarine. Surface area had a bias of −6.5% ± 2.8% with minimum bias of −0.3% at the temporalpole and a maximum bias of −13.0% at the rostral anterior cingulate, while volume had a bias of −6.4% ± 3.4% with minimum bias of −1.0% at the pericalcarine and maximum bias of −14.8% at the rostral anterior cingulate.
Fig. 13.
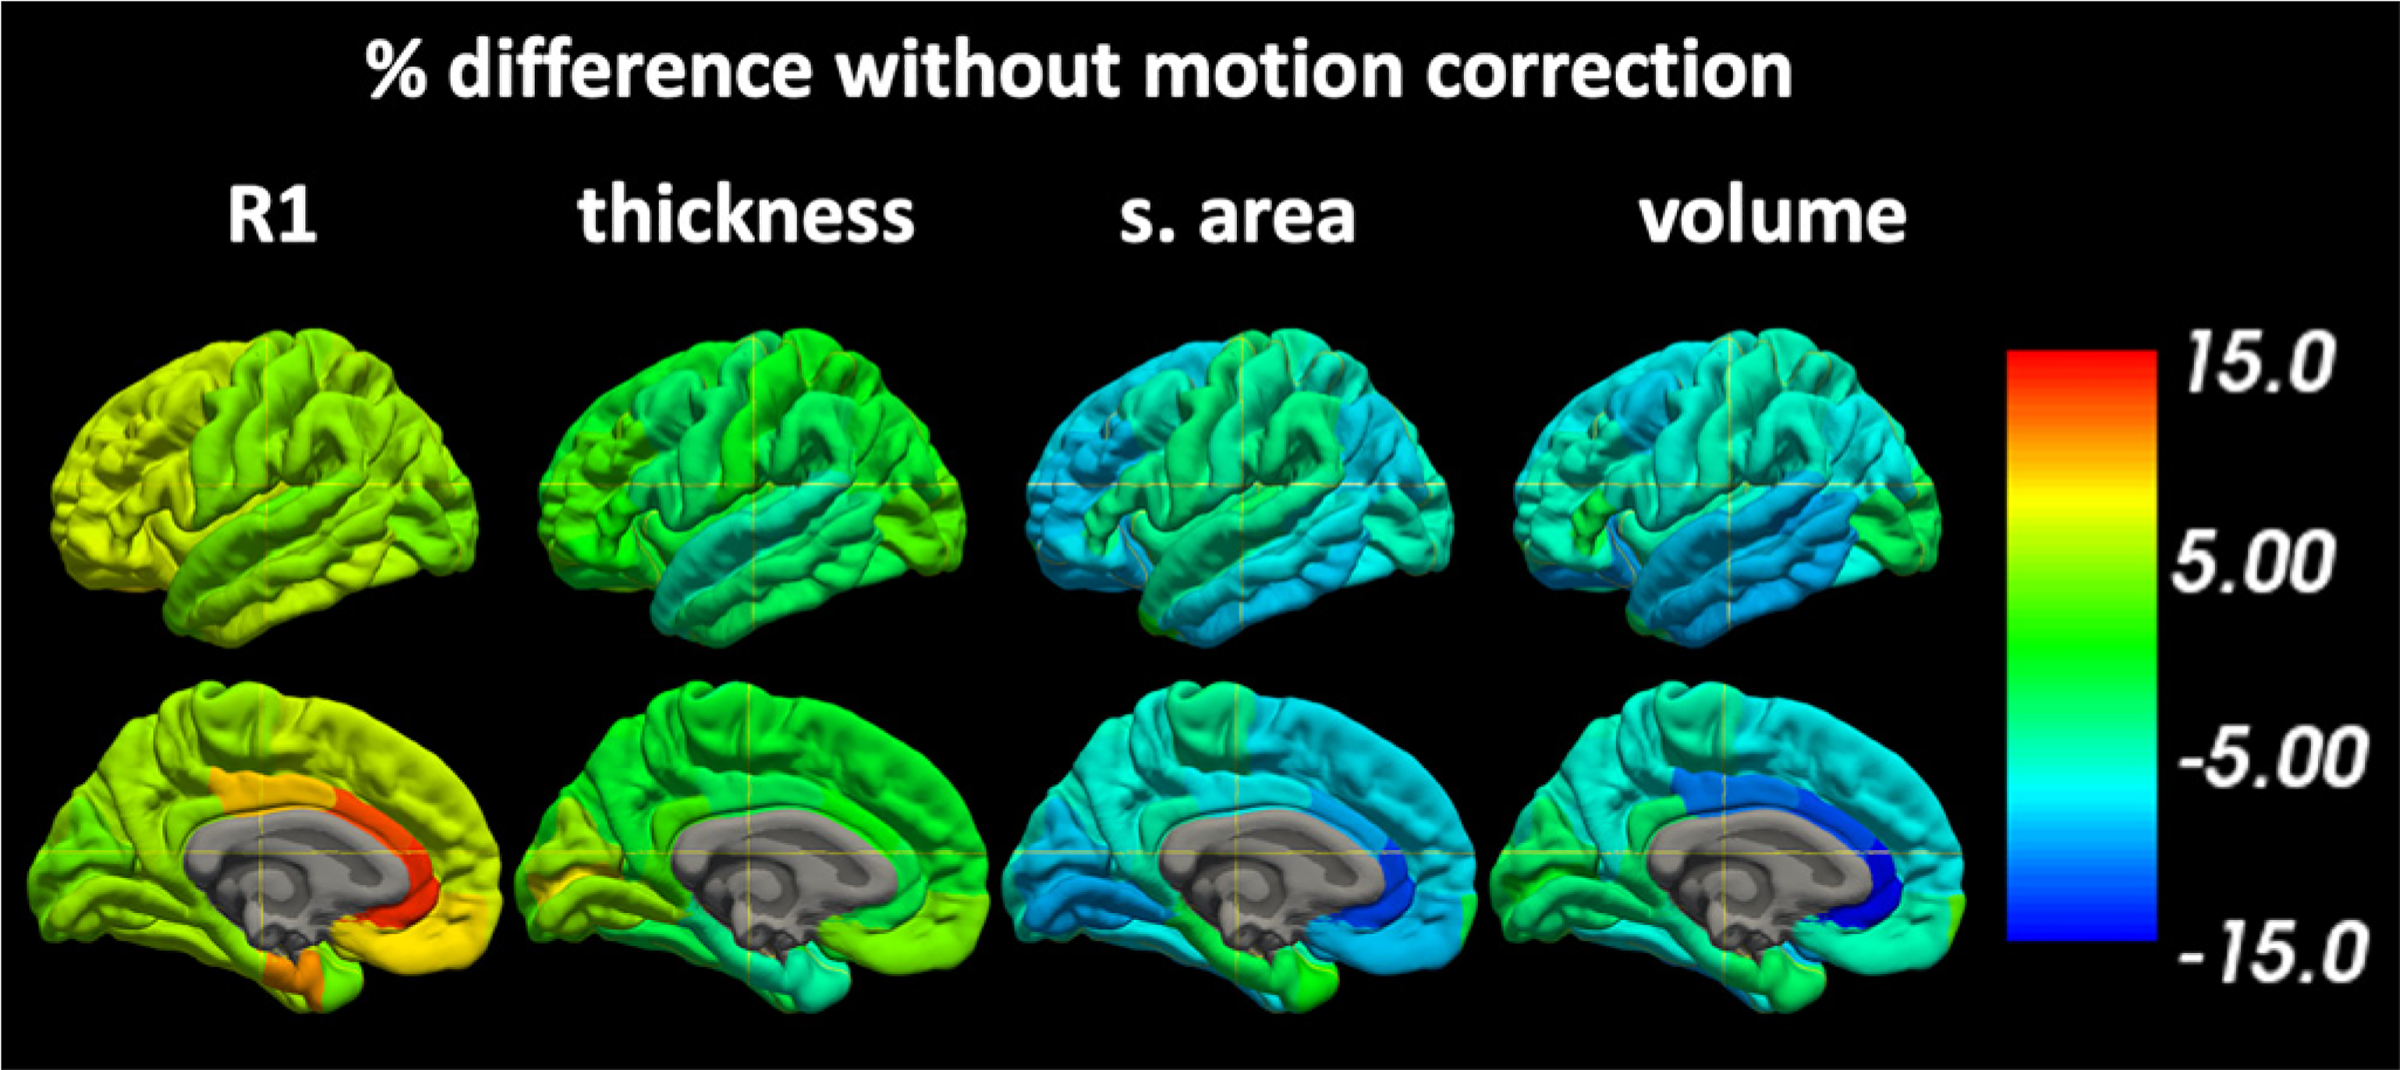
The relative bias of R1 and morphological measures when motion correction is not used. Uncorrected motion artifacts generally result in increased R1 and decreased thickness, surface area, and volume measurements.
The motion metric did not display significant interactions for age and gender (p = 0.08 and p = 0.62, adjusted r2 = 0.42). On the other hand, R1 and the morphological parameters all had regions where age, sex, and/or gender had significant interactions. The number of regions for each significant interaction are provided in Table 5. For cortical thickness, surface area, volume, and R1, significant motion interactions were observed in about 41%, 75%, 60%, and 98% of the regions of the DK and Destrieux atlases before motion correction, but only 1%, 0%, 6%, and 4% after motion correction. For the DK atlas, significant motion interactions after motion correction occurred in caudal middle frontal (volume), pericalcarine (volume), postcentral (volume), precental (volume), precuneul (R1), superior frontal (volume), temporalpole (thickness). For the Destrieux atlas, significant motion interactions after motion correction occurred in the transverse frontopolar gyri and sulci (R1), precuneus (R1), postcentral gyrus (volume), occipital pole (volume), and subparietal sulcus (R1). Motion correction also had marked effects on the number of regions with significant age interactions for R1 and to a lesser extent thickness. Before motion correction, only about 6% of the regions had significant age effects for R1, but 90% did after motion correction. For the DK atlas the only regions without significant age interactions for R1 after motion correction were the lingual and pericalcarine regions. For the Destrieux atlas, the corresponding regions without significant age interactions for R1 after motion correction were the long insular gyrus and central sulcus of the insula, lingual gyrus, subcallosal area /subcollosal gyrus, inferior temporal gyrus, occipital pole, inferior segment of the circular sulcus of the insula, superior segment of the circular sulcus of the insula, anterior transverse collateral sulcus, posterior transverse collateral sulcus regions. For thickness, only about 36% of the regions had significant age interactions before motion correction, but 67% did afterwards. There was a reduction of the number of regions with significant age interactions for surface area after motion correction (31% to 6%) and a slight increase (5% to 7%) for volume.
Table 5.
Cortical parameters estimated as a linear mixed effects model (1+age+gender+motion).
| Motion Dependencies of Parameters # of regions with significant at FDR corrected p<0.05 |
|||||||||
|---|---|---|---|---|---|---|---|---|---|
| Destrieux Atlas N=74 |
Desikan-Killian (DK) Atlas N =34 |
||||||||
| Thick. | s. area | volume | qR1 | Thick. | s. area | Volume | qR1 | ||
|
| |||||||||
| MPnRAGE w/o motion correction | |||||||||
| age | 27 | 18 | 2 | 6 | 12 | 15 | 3 | 0 | |
| sex | 6 | 53 | 23 | 0 | 6 | 27 | 13 | 0 | |
| motion | 29 | 55 | 43 | 73 | 15 | 26 | 21 | 33 | |
| MPnRAGE w/motion correction | |||||||||
| age | 47 | 3 | 4 | 65 | 25 | 3 | 4 | 32 | |
| sex | 7 | 28 | 5 | 5 | 7 | 17 | 0 | 1 | |
| motion | 0 | 0 | 2 | 3 | 1 | 0 | 5 | 1 | |
The number of regions with significant (FDR corrected at p<0.05) slopes for each variable are provided in the table.
4. Discussion
This study demonstrated that highly repeatable cortical FreeSurfer segmentations and cortical R1 relaxometry values from unsedated children can be obtained using MPnRAGE with SNARE self-navigated retrospective motion correction. Even though this study used a pediatric cohort, did not stabilize the children’s heads for the repeat scans, and did not reject any data, the reported region of interest ICC values for morphological measures were larger and had less variation than those from an adult cohort of conventional MPRAGE without motion correction that manually rejected over 1/3 of the data due to poor quality (Iscan et al., 2015). Similarly, the global ICC of cortical thickness in this study, 0.96 is considerably higher than the Centre for Cognition and Brain Disorders (N = 30 participants aged 20–30 years) (Chen et al., 2016) and the Brain Genome Superstruct Project, (N = 69 participants aged 18 to 25 years) (Holmes, Hollinshead, Roffman, Smoller, & Buckner, 2016) studies retrospectively analyzed in (Madan & Kensinger, 2017) with reported ICCs of 0.816 and 0.890 respectively.
In Iscan et al. (2015), the mean of the absolute percent differences (PD) between two measurements was used as opposed to the coefficient of variation. Assuming a normal distribution of measurement differences, a correction factor of sqrt(2) * (1 + 1/(4 * 2))/(1 + 1/(4 * 3)) ~ 1.47, can be applied to the PD factors to allow better comparisons with the coefficients of variation reported in this study. The result is that the regional measurements of thickness, surface area, and volume obtained with motion corrected MPnRAGE have similar coefficients of variation (average difference of −0.02% +/− 0.27% in favor of the Iscan 2015 results), and a larger ICC (average difference of + 0.08 +/−0.027 in favor of MPnRAGE). This is suggestive that MPnRAGE with motion correction and no visual inspection (100% data acceptance) may produce similar quality FreeSurfer results in pediatric populations as conventional MPRAGE with data from adult subjects that passed visual inspection.
Quantitative R1 relaxometry measures from MPnRAGE with motion correction had low coefficients of variation (about 1% for regional measurements and 2% for vertex based measurements) and high ICCs (> 0.8 for regional measurements and > 0.68 for vertex based measurements), suggesting its reliability is similar to cortical thickness. Some other works have examined test-retest of R1 from other relaxometry methods under motion challenges. For example, one approach used an optical system for prospective motion correction (Callaghan et al., 2015). In that work, the coefficients of variation were highly variable across the cortical gray matter and ranged from roughly 10% to 25% and image artifacts and biases were still highly noticeable in the relaxometry images. More recently, a magnetic resonance fingerprinting approach (Kurzawski et al., 2020) used a similar motion correction technique as in MPnRAGE (Kecskemeti et al., 2018) to increase the concordance correlation coefficient of R1. The coefficient of variation was not examined in that study, nor were the morphometric parameters from Freesurfer. A different manuscript featuring magnetic resonance fingerprinting approach did examine test-retest in a cohort of adult subjects scanned without a motion challenge and obtained a coefficient of variation of about 1.1% for R1 (Buonincontri et al., 2021). However, since that approach included both cortical and subcortical gray matter, used twice as much spatial filtering of the relaxometry maps, and used a three-dimensional volumetric filtering versus two-dimensional surface based smoothing, direct comparisons are not possible.
As expected, reliability for cortical thickness and R1 relaxometry was highest for global measures, then region of interest measures, and lastly vertex-based measures. In this study, thickness and R1 measures were smoothed along the surface with a Gaussian filter of 10mm at full width half max as larger filters offered diminishing returns (Fig 3). This amount of filtering is consistent with the value arrived at in (Han et al., 2006) and is commonly used for group analysis of cortical thickness. Future improvements in motion correction and image reconstruction may offer increased reliability with less spatial filtering by producing sharper and higher signal to noise ratio images, but are beyond the scope of this work.
Prospectively motion corrected MPRAGE and retrospectively motion corrected MPnRAGE performed quite differently under these test-retest conditions. This was not too unexpected based on the earlier findings studying subcortical segmentations (Kecskemeti & Alexander, 2019). There it was suggested that the differences may be due to how motion artifacts from uncorrected motion within a readout block manifest. In the Cartesian k-space trajectories that PROMO MPRAGE uses, artifacts typically occur as ghosting or ringing, while in the 3D radial k-space trajectories used for MPnRAGE, artifacts occur as spatial blurs which are generally tolerated better by automated segmentation tools. Note that while other works have demonstrated promising results with prospective motion correction, they used healthy young adult subjects who performed scripted motion of relatively short durations which makes data acquisition more favorable than this study that featured more continuous motions. For example, one case used scripted motions that lasted about 12–16% of the time, but used an unlimited data reacquisition window (Sarlls et al., 2018). Another case used scripted motions of about 8% and 25% total duration and about a 12% data reacquisition window (Tisdall et al., 2016). For the more continual types of motion present in this study, improvement by reacquisition of corrupt data is likely to offer diminishing returns for PROMO MPRAGE as subject compliance is not expected to improve with scan duration. See, for example the “Discussion” and Supplemental Fig. 2 of (Kecskemeti & Alexander, 2020).
This manuscript also offers insight into potential differences that motion artifacts have on the cortical measures themselves. Table 1 shows that images that have not been corrected for motion generally produce smaller morphological measures (thickness, surface area, and volume) but larger R1. Interestingly, this same trend of reduced morphological measures has also been observed when conventional Cartesian k-space encoded MPRAGE was used, despite the drastic differences in the way motion artifacts present (ghosting/ringing versus blurring of radial imaging) (Alexander-Bloch et al., 2016; Pardoe, Kucharsky Hiess, & Kuzniecky, 2016; Reuter et al., 2015). Thus, groups with more motion than the control group could have exaggerated, washed out, or even false effects if motion is not corrected. This could also lead to different biological interpretations beyond the morphological differences since increased myelin contents is expected to increase R1 (Lebel & Deoni, 2018). For example, false increases of R1 measurements due to uncorrected motion artifacts could be problematic for studies with significant age effects since R1 also increases with age (Watanabe, Liao, Jara, & Sakai, 2013). Although the current manuscript found only a weak relationship between motion and age, this may explain why many regions did not have significant relationships between R1 and age before motion correction, but did afterwards. Further populations where motion could introduce potential biases include autism spectrum disorder, attention deficit hyperactivity disorder, and schizophrenia as a recent study (Pardoe et al., 2016) of over 2000 participants showed that all those groups demonstrated increased motion compared to the control group. Thus, robust motion correction techniques are expected to be critical when studying such groups.
Moreover, this manuscript demonstrates that after motion correction is used, the coefficient of variation of the cortical thickness, cortical surface area, and cortical volume from Freesurfer segmentations no longer have any significant dependence on the amount of motion (as assessed with the motion metric) during the scans, at least within the ranges of motion observed in this test-retest study of young children. The range of motions observed in this test-retest study were within the 95% percentile of a larger study of young children with Autism spectrum disorder. Young age and Autism status have both been shown to increase participant motion compared to young adult control subjects with similar results found for subjects with attention deficit hyperactivity disorder and schizophrenia (Pardoe et al., 2016). We expect the test-retest results of this work to be applicable to other studies with similar or less motions. Moreover, retrospective motion correction provided high reliability for all parameters across the entire range of tested motion, including those cases with little or no observed motion artifacts, supporting the use of retrospective motion correction for all future participants.
5. Conclusion
In this work we examined the test-retest of cortical thickness, cortical surface area, and cortical volume from FreeSurfer reconstructions and quantitative R1 relaxometry of the cortex using self-navigated retrospectively motion corrected MPnRAGE images from a cohort of pediatric participants and used these results to approximate the number of subjects needed in future studies for a given effect power. When motion correction was used, all measures had high test-retest performance as assessed by coefficients of variation and intraclass correlation coefficients. The results of the geometric measures (thickness, surface area, and volume) were similar to those obtained in a previously report using visually inspected datasets for a study with normal adult subjects. Motion correction effectively removed motion related biases in nearly all regions for R1 and morphometric measures.
Supplementary Material
Fig. 5.
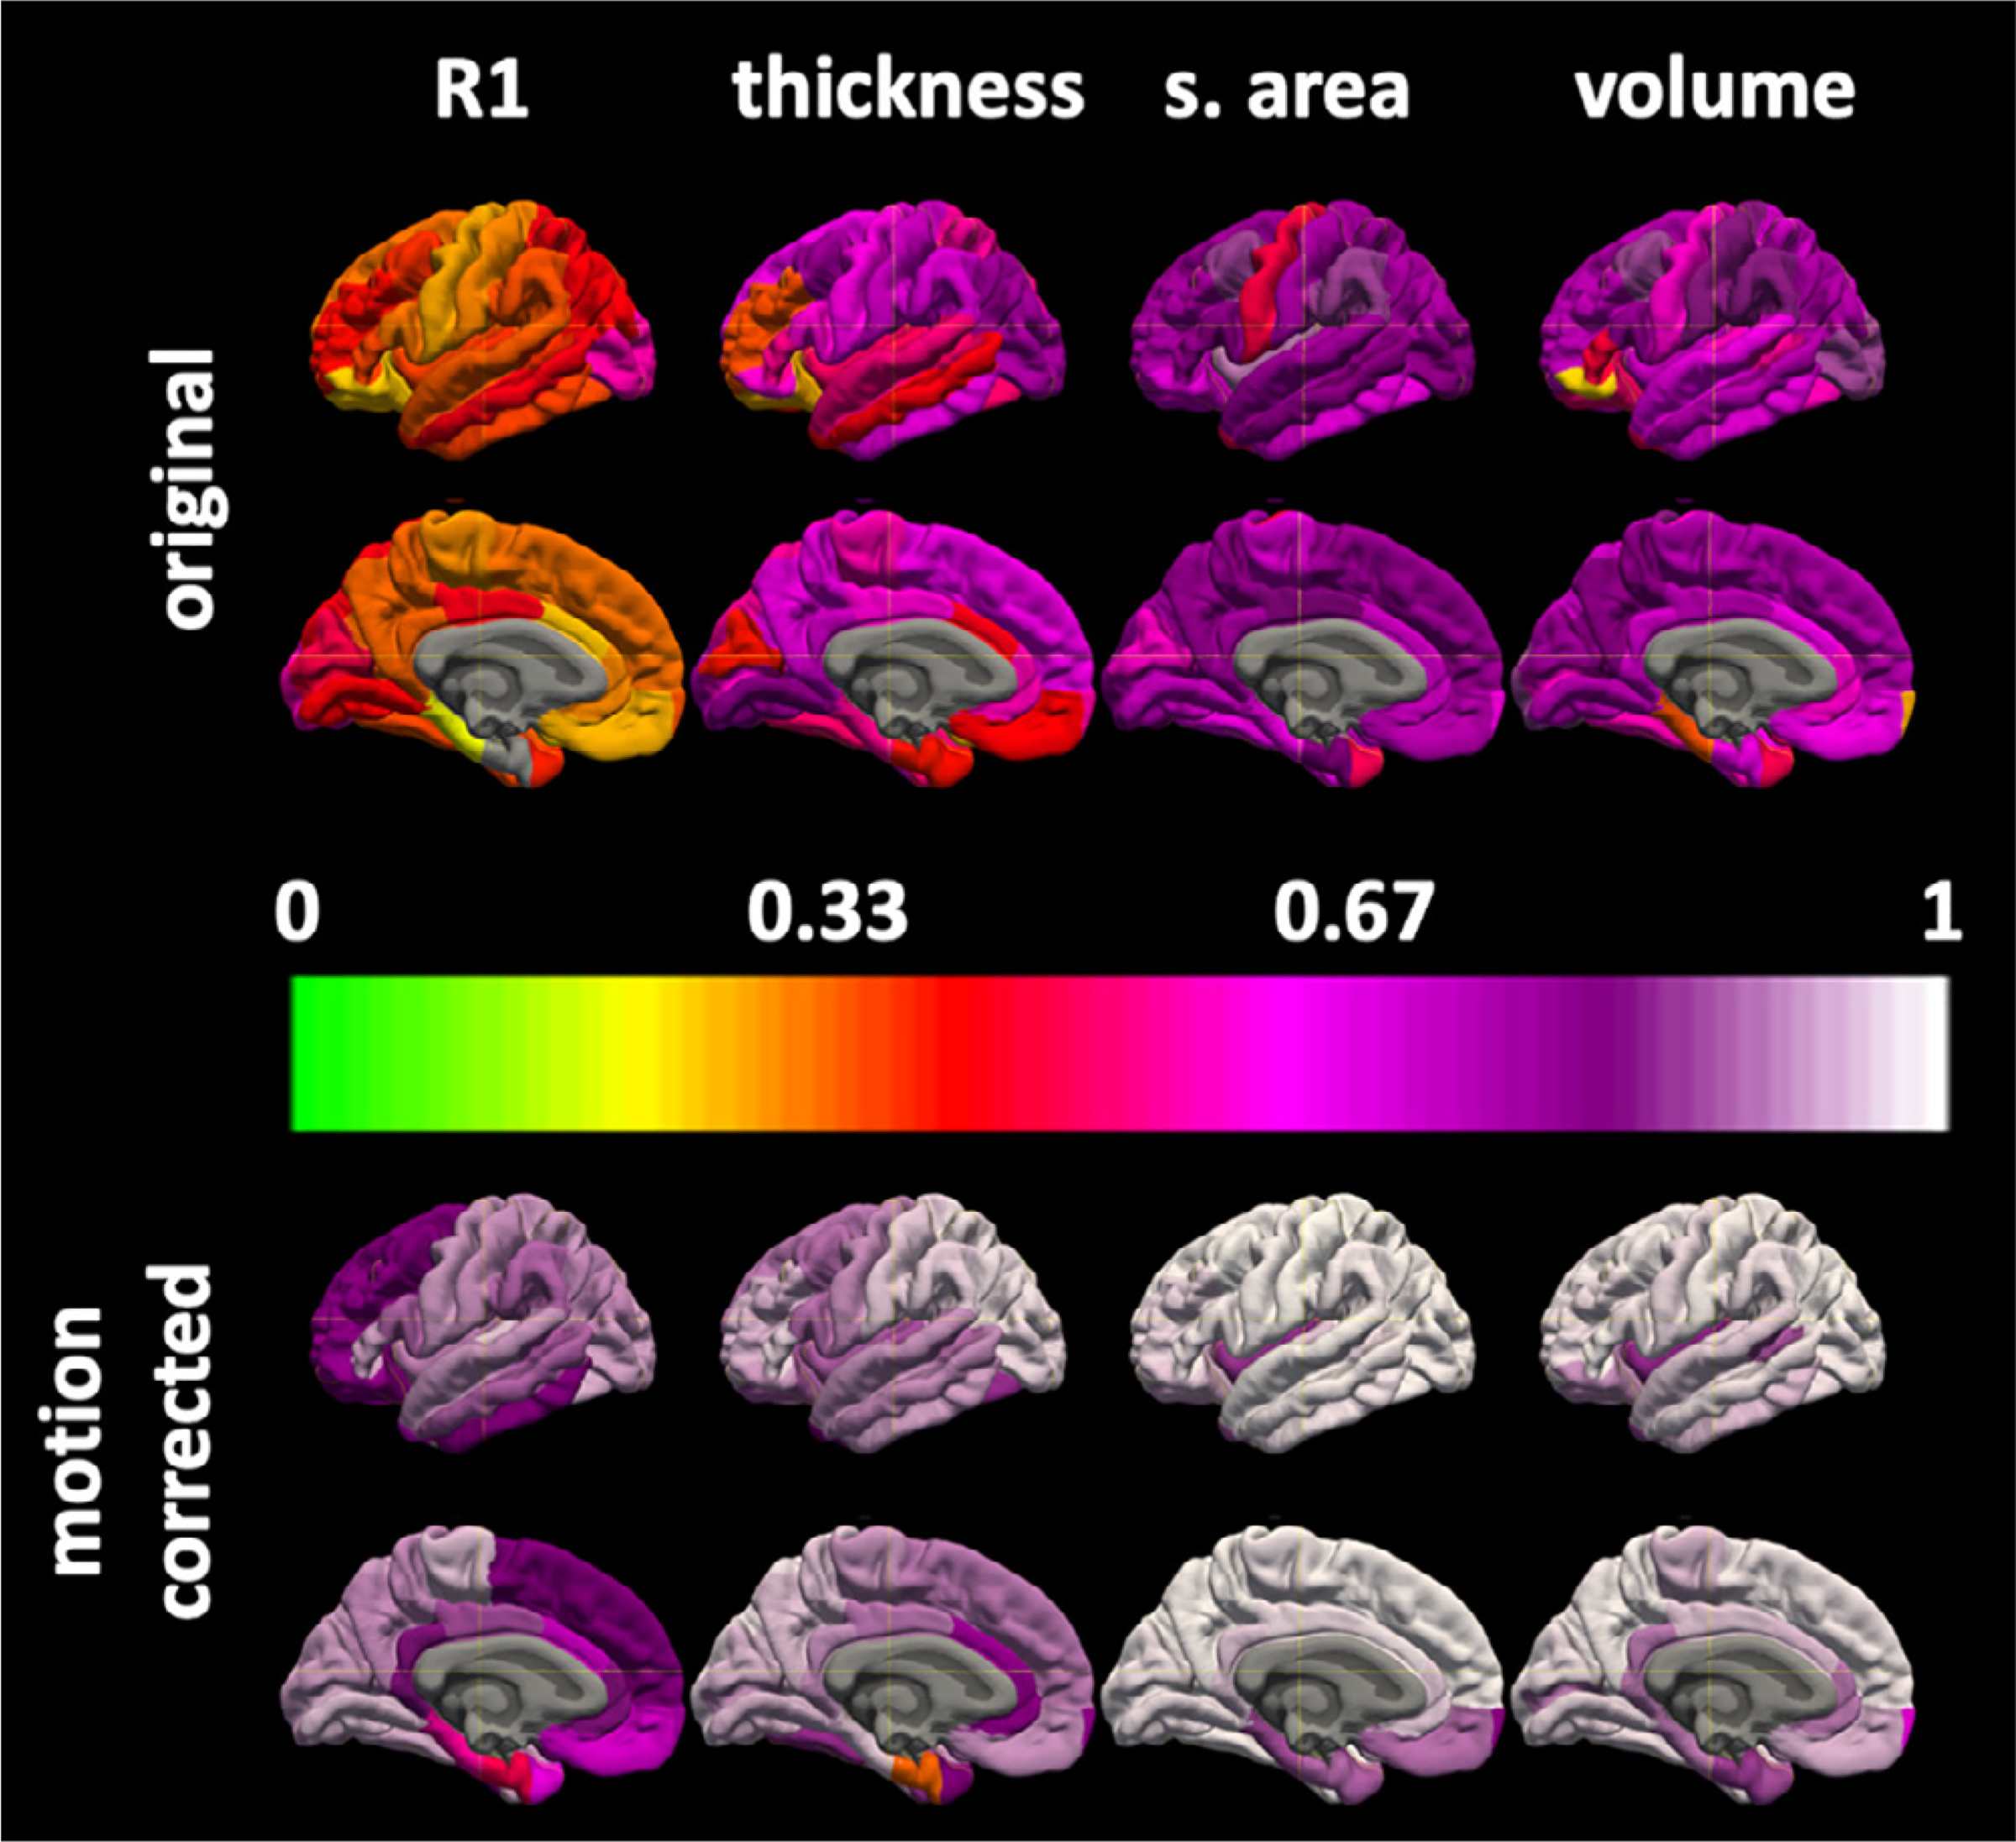
The regional surface maps for the intraclass correlation coefficients without (top) and with (bottom) motion correction for MPnRAGE.
Funding
National Institutes of Health, Grant/Award Number: AG051216, AG15001, DA050258, HD094715, MH097464, MH100031 and MH101504; Eunice Kennedy Shriver National Institute of Child Health and Human Development, Grant/ Award Number: IDDRC U54 HD090256; Department of Radiology, University of Wisconsin-Madison; Hartwell Foundation’s Individual Biomedical Award
Footnotes
Declaration of Competing Interest
Authors SK and AA have two patents on the MPnRAGE technique.
Ethics approval & Consent to participate
Imaging experiments were performed with institutional review board approval and informed consent/assent.
Availability of data and material
The data is not publicly available.
Code availability
There is no available code.
Supplementary materials
Supplementary material associated with this article can be found, in the online version, at doi:10.1016/j.neuroimage.2021.118447.
References
- Alexander-Bloch A, Clasen L, Stockman M, Ronan L, Lalonde F, Giedd J, Raznahan A, 2016. Subtle in-scanner motion biases automated measurement of brain anatomy from in vivo MRI. Hum. Brain Mapp 37 (7), 2385–2397. doi: 10.1002/hbm.23180. [DOI] [PMC free article] [PubMed] [Google Scholar]
- Bazin P-L, Nijsse HE, van der Zwaag W, Gallichan D, Alkemade A, Vos FM, Caan MWA, 2020. Sharpness in motion corrected quantitative imaging at 7T. Neuroimage 222, 117227. doi: 10.1016/j.neuroimage.2020.117227. [DOI] [PubMed] [Google Scholar]
- Benjamini Y, Hochberg Y, 1995. Controlling the false discovery rate: a practical and powerful approach to multiple testing. J. Royal Stat. Soc. Ser. B (Methodol.) 57 (1), 289–300. Retrieved from http://www.jstor.org/stable/2346101. [Google Scholar]
- Buonincontri G, Kurzawski JW, Kaggie JD, Matys T, Gallagher FA, Cencini M, Tosetti M, 2021. Three dimensional MRF obtains highly repeatable and reproducible multi-parametric estimations in the healthy human brain at 1.5T and 3T. Neuroimage 226, 117573. doi: 10.1016/j.neuroimage.2020.117573. [DOI] [PubMed] [Google Scholar]
- Callaghan MF, Josephs O, Herbst M, Zaitsev M, Todd N, Weiskopf N, 2015. An evaluation of prospective motion correction (PMC) for high resolution quantitative MRI. Front. Neurosci 9, 97. doi: 10.3389/fnins.2015.00097. [DOI] [PMC free article] [PubMed] [Google Scholar]
- Chen B, Xu T, Zhou C, Wang L, Yang N, Wang Z, Weng X-C, 2016. Individual variability and test-retest reliability revealed by ten repeated resting-state brain scans over one month. PLoS One 10 (12), e0144963. doi: 10.1371/journal.pone.0144963, Retrieved from. [DOI] [PMC free article] [PubMed] [Google Scholar]
- Dale AM, Fischl B, Sereno MI, 1999. Cortical surface-based analysis. I. Segmentation and surface reconstruction. Neuroimage 9 (2), 179–194. doi: 10.1006/nimg.1998.0395. [DOI] [PubMed] [Google Scholar]
- Glover GH, Pauly JM, 1992. Projection reconstruction techniques for reduction of motion effects in MRI. Magn. Reson. Med 28 (2), 275–289. doi: 10.1002/mrm.1910280209. [DOI] [PubMed] [Google Scholar]
- Han X, Jovicich J, Salat D, van der Kouwe A, Quinn B, Czanner S, Fischl B, 2006. Reliability of MRI-derived measurements of human cerebral cortical thickness: the effects of field strength, scanner upgrade and manufacturer. Neuroimage 32 (1), 180–194. doi: 10.1016/j.neuroimage.2006.02.051. [DOI] [PubMed] [Google Scholar]
- Holmes AJ, Hollinshead MO, Roffman JL, Smoller JW, Buckner RL, 2016. Individual differences in cognitive control circuit anatomy link sensation seeking, impulsivity, and substance use. J. Neurosci. : Offic. J. Soc. Neurosci 36 (14), 4038–4049. doi: 10.1523/JNEUROSCI.3206-15.2016. [DOI] [PMC free article] [PubMed] [Google Scholar]
- Iscan Z, Jin TB, Kendrick A, Szeglin B, Lu H, Trivedi M, DeLorenzo C, 2015. Test-retest reliability of freesurfer measurements within and between sites: Effects of visual approval process. Hum. Brain Mapp 36 (9), 3472–3485. doi: 10.1002/hbm.22856. [DOI] [PMC free article] [PubMed] [Google Scholar]
- Kecskemeti S, Alexander AL, 2020. Three-dimensional motion-corrected T1 relaxometry with MPnRAGE. Magn. Reson. Med doi: 10.1002/mrm.28283. [DOI] [PMC free article] [PubMed] [Google Scholar]
- Kecskemeti S, Samsonov A, Hurley SA, Dean DC, Field A, Alexander AL, 2016. MPnRAGE: a technique to simultaneously acquire hundreds of differently contrasted MPRAGE images with applications to quantitative T1 mapping. Magn. Reson. Med 75 (3), 1040–1053. [DOI] [PMC free article] [PubMed] [Google Scholar]
- Kecskemeti S, Samsonov A, Velikina J, Field AS, Turski P, Rowley H, Alexander AL, 2018. Robust motion correction strategy for structural MRI in unsedated children demonstrated with three-dimensional radial MPnRAGE. Radiology 289 (2), 509–516. doi: 10.1148/radiol.2018180180. [DOI] [PMC free article] [PubMed] [Google Scholar]
- Kecskemeti SR, Alexander AL, 2020. Test-retest of automated segmentation with different motion correction strategies: a comparison of prospective versus retrospective methods. Neuroimage 209. doi: 10.1016/j.neuroimage.2019.116494. [DOI] [PMC free article] [PubMed] [Google Scholar]
- Kecskemeti SR, Alexander AL, 2019. Test-retest of automated segmentation with different motion correction strategies: a comparison of prospective versus retrospective methods. Neuroimage 209, 116494. doi: 10.1016/j.neuroimage.2019.116494. [DOI] [PMC free article] [PubMed] [Google Scholar]
- Krotkov E, 1988. Focusing. Int. J. Comput. Vision 1 (3), 223–237. doi: 10.1007/BF00127822. [DOI] [Google Scholar]
- Kurzawski JW, Cencini M, Peretti L, Gómez PA, Schulte RF, Donatelli G, Buonincontri G, 2020. Retrospective rigid motion correction of three-dimensional magnetic resonance fingerprinting of the human brain. Magn. Reson. Med 84 (5), 2606–2615. doi: 10.1002/mrm.28301. [DOI] [PubMed] [Google Scholar]
- Lebel C, Deoni S, 2018. The development of brain white matter microstructure. Neuroimage 182, 207–218. doi: 10.1016/j.neuroimage.2017.12.097. [DOI] [PMC free article] [PubMed] [Google Scholar]
- Madan CR, Kensinger EA, 2017. Test–retest reliability of brain morphology estimates. Brain Informatics 4 (2), 107–121. doi: 10.1007/s40708-016-0060-4. [DOI] [PMC free article] [PubMed] [Google Scholar]
- Mugler JP, Brookeman JR, 1990. Three-dimensional magnetization-prepared rapid gradient-echo imaging (3D MP RAGE). Magn. Reson. Med 15 (1), 152–157. doi: 10.1002/mrm.1910150117. [DOI] [PubMed] [Google Scholar]
- Pardoe HR, Kucharsky Hiess R, Kuzniecky R, 2016. Motion and morphometry in clinical and nonclinical populations. Neuroimage 135, 177–185. doi: 10.1016/j.neuroimage.2016.05.005. [DOI] [PubMed] [Google Scholar]
- Patenaude B, Smith SM, Kennedy DN, Jenkinson M, 2011. A Bayesian model of shape and appearance for subcortical brain segmentation. Neuroimage 56 (3), 907–922. doi: 10.1016/j.neuroimage.2011.02.046. [DOI] [PMC free article] [PubMed] [Google Scholar]
- Reuter M, Tisdall MD, Qureshi A, Buckner RL, van der Kouwe AJW, Fischl B, 2015. Head motion during MRI acquisition reduces gray matter volume and thickness estimates. Neuroimage 107, 107–115. doi: 10.1016/j.neuroimage.2014.12.006. [DOI] [PMC free article] [PubMed] [Google Scholar]
- Roemer PB, Edelstein WA, Hayes CE, Souza SP, Mueller OM, 1990. The NMR phased array. Magn. Reson. Med. 16 (2), 192–225. [DOI] [PubMed] [Google Scholar]
- Rudin LI, Osher S, Fatemi E, 1992. Nonlinear total variation based noise removal algorithms. Physica D 60 (1), 259–268. doi: 10.1016/0167-2789(92)90242-F. [DOI] [Google Scholar]
- Sarlls JE, Lalonde F, Rettmann D, Shankaranarayanan A, Roopchansingh V, Talagala SL, 2018. Effectiveness of navigator-based prospective motion correction in MPRAGE data acquired at 3T. PLoS One 13 (6), 1–12. doi: 10.1371/journal.pone.0199372. [DOI] [PMC free article] [PubMed] [Google Scholar]
- Tisdall MD, Hess AT, Reuter M, Meintjes EM, Fischl B, van der Kouwe AJW, 2012. Volumetric navigators for prospective motion correction and selective reacquisition in neuroanatomical MRI. Magn. Reson. Med 68 (2), 389–399. doi: 10.1002/mrm.23228. [DOI] [PMC free article] [PubMed] [Google Scholar]
- Tisdall MD, Reuter M, Qureshi A, Buckner RL, Fischl B, van der Kouwe AJW, 2016. Prospective motion correction with volumetric navigators (vNavs) reduces the bias and variance in brain morphometry induced by subject motion. Neuroimage 127, 11–22. doi: 10.1016/j.neuroimage.2015.11.054. [DOI] [PMC free article] [PubMed] [Google Scholar]
- Tustison NJ, Avants BB, Cook PA, Zheng Y, Egan A, Yushkevich PA, Gee JC, 2010. N4ITK: improved N3 bias correction. IEEE Trans. Med. Imaging 29 (6), 1310–1320. doi: 10.1109/TMI.2010.2046908. [DOI] [PMC free article] [PubMed] [Google Scholar]
- Watanabe M, Liao JH, Jara H, Sakai O, 2013. Multispectral quantitative MR imaging of the human brain: lifetime age-related effects. Radiographics 33 (5), 1305–1319. doi: 10.1148/rg.335125212. [DOI] [PubMed] [Google Scholar]
- White N, Roddey C, Shankaranarayanan A, Han E, Rettmann D, Santos J, Dale A, 2010. PROMO: real-time prospective motion correction in MRI using image-based tracking. Magn. Reson. Med 63 (1), 91–105. [DOI] [PMC free article] [PubMed] [Google Scholar]
- Zhang Y, Brady M, Smith S, 2001. Segmentation of brain MR images through a hidden Markov random field model and the expectation-maximization algorithm. IEEE Trans. Med. Imaging 20 (1), 45–57. doi: 10.1109/42.906424. [DOI] [PubMed] [Google Scholar]
Associated Data
This section collects any data citations, data availability statements, or supplementary materials included in this article.


