Abstract
Outbreaks from choir performances, such as the Skagit Valley Choir, showed that singing brings potential risk of COVID-19 infection. There is less known about the risks of airborne infection from other musical performances, such as playing wind instruments or performing theater. In addition, it is important to understand methods that can be used to reduce infection risk. In this study, we used a variety of methods, including flow visualization, aerosol and CO2 measurements, and computational fluid dynamics (CFD) modeling to understand the different components that can lead to transmission risk from musical performance and risk mitigation. This study was possible because of a partnership across academic departments and institutions and collaboration with the National Federation of State High School Associations and the College Band Directors National Association. The interdisciplinary team enabled us to understand the various aspects of aerosol transmission risk from musical performance and to quickly implement strategies in music classrooms during the COVID-19 pandemic. We found that plumes from musical performance were highly directional, unsteady and varied considerably in time and space. Aerosol number concentration measured at the bell of the clarinet was comparable to that of singing. Face and bell masks attenuated plume velocities and lengths and decreased aerosol concentrations measured in front of the masks. CFD modeling showed differences between indoor and outdoor environments and that the lowest risk of airborne COVID-19 infection occurred at less than 30 min of exposure indoors and less than 60 min outdoors.
Keywords: Aerosol transmission, Aerosol concentration, Aerosol size distribution, Wind instruments, Singing, Theatre, Computational fluid dynamics, Flow visualization, Schlieren imaging, Laser sheet imaging
1. Introduction
The significance of infectious disease transmission by inhalation of airborne respiratory particles (also commonly referred to as “aerosol”) has been intensely discussed in the context of the coronavirus disease (COVID-19) worldwide pandemic, caused by the severe acute respiratory syndrome coronavirus 2 (SARS-CoV-2),1 and there is strong empirical evidence for airborne transmission of SARS-CoV-2. Several studies have detected and/or cultured SARS-CoV-2 in air samples and found virus on the surfaces of ventilation exhaust vents.2−9 SARS-CoV-2 virus has also been reported detected in exhaled breath of infected individuals10 and has been shown to transmit disease via aerosol inhalation in animals.11 Outbreak investigations reported transmission by aerosol to be the most plausible explanation of a large number of exposed individuals not located directly near the index case.1,12
Because of this risk of infection via inhalation of aerosol, many activities that occurred prior to the pandemic have been modified, especially those that have the potential to generate respiratory airborne particles. These activities include singing, performing theater, and playing band instruments. Singing has been implicated in several outbreaks.12,13 There have been no reports yet implicating the playing of instruments, but there have been reports of musicians spreading the virus in a bar outbreak in Hong Kong.14 However, the potential for wind instrument spread is likely. In one study, the number of particles emitted while playing plastic blowing horns called vuvuzelas (used by sports fans) was 658 particles cm–3 compared to 3.7 particles cm–3 for shouting. The majority of these particles were between 0.5 and 5 μm in diameter.15 Loudon and Roberts reported that, for singing, the count median diameter was 68 μm with a geometric standard deviation of 3.3; 34% of the particles were smaller than 3 μm, and 33% were between 3 and 114 μm.16 After a 30 min settling period, 36% of the emitted droplets were still airborne. Asadi et al. showed that the rate of aerosol emission during vocal activities increases with the loudness of the sound.17 Measurements of aerosol number concentrations released during sustained vocalization were shown to be comparable to those of voluntary coughing and higher than those of speaking.18 Alsved et al. conducted a study of 12 singers utilizing an aerodynamic particle sizer (APS) and a high-speed camera and showed that singing produced more aerosol compared to normal talking and breathing, and that singing or talking louder also generated more aerosol.19 He et al. recently conducted a study of various musical instruments and found that aerosol generation can vary substantially across musical instruments and can be affected by dynamic level, articulation, and individual performers.20
The singing outbreaks and the published data on plastic horn playing suggest that further investigation is warranted into the possibility of infectious aerosol generated from playing wind instruments. Concern has been expressed specifically regarding woodwind and brass instruments because the sound is produced by a controlled flow of exhaled air. The objective of this study was to better understand aerosol production in wind instrument playing, singing, and acting so that musicians, performers, and students of music could resume playing in rehearsal and public spaces in a safer manner for the nearby musicians and audience during the COVID-19 pandemic. We approached this problem by using fluid flow visualization techniques to first understand the respiratory flow patterns from these activities. Based on these results, we measured the aerosol and CO2 produced in the major flow fields while performing. We also modeled the aerosol production using computational fluid dynamics (CFD) to predict risk of infection. Finally, mitigation strategies were developed and investigated through modeling and measurements.
2. Methods
Research teams at the University of Colorado Boulder and at the University of Maryland worked collaboratively and in parallel on different aspects of the project. The University of Colorado Boulder team conducted flow visualization and aerosol experiments, and the University of Maryland also conducted aerosol experiments and CFD modeling.
2.1. Scripted Activities and Study Subjects
Activities performed for this study incorporated instrument playing as well as vocal performances, including five woodwind instruments (three flute, two clarinet, one oboe, one saxophone, and one bassoon player), four brass instruments (one French horn, one trumpet, one trombone, and one tuba), two vocal ranges (one female soprano, one male baritone), and one theater performer.
Each wind instrument player was asked to perform the same piece of music four times in a row, totaling 4–5 min of almost continuous playing with short rest breaks in between. The piece of music was “Holt in E-flat for COVID-19 Study,” which was selected specifically for this study and consisted of a slurred chromatic scale encompassing each instrument’s normal range, and “Holt in Eb.” The singers were asked to perform a warm-up, a hymn piece, and a musical theater piece. The theater performer was asked to recite two monologues from memory. All participants were asked to read a standard text used in speech pathology practice called “The Caterpillar,” which is a simple reading designed for a wide range of ages that contains a variety of consonants and vowels of English speech.21
Data collection occurred during summer and fall 2020, and subjects were recruited for their ability to play an instrument, sing, or perform, proximity to campus during the data collection period, and availability. Musicians in this study were upper-level undergraduate or graduate students aged 20–30 years old studying music at the University of Colorado Boulder. The theater performer was a male professor and was >30 years old. Participants filled out a health questionnaire before coming to the lab. No participants showed symptoms of sickness during the course of the experiments. This study was reviewed and approved by the Institutional Review Board at the University of Colorado at Boulder (Protocol #20-0281).
2.2. Aerosol Testing Room
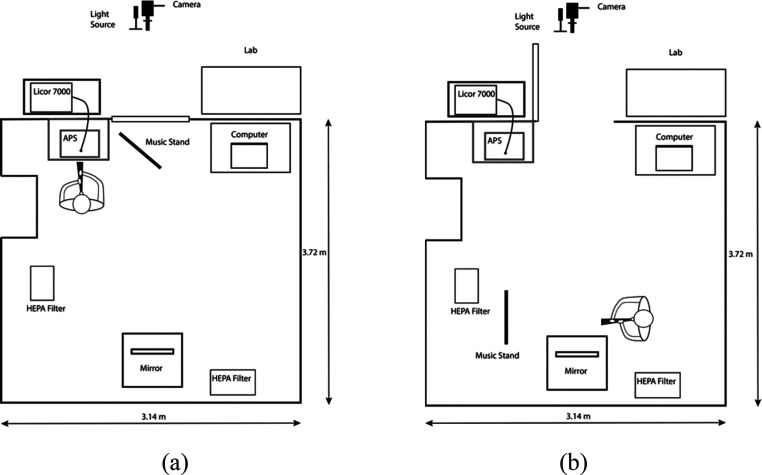
Flow characterization and exhaled aerosol plume measurements were conducted in a 37.8 m3 (3.1 m × 3.7 m × 3.3 m with a pillarlike structure on one of the walls) aerosol testing room at the University of Colorado Boulder. This room has no supply ventilation but a dedicated ventilation exhaust, with a ventilation damper that can be opened or closed on demand by the room operator, from outside of it. When the exhaust damper is opened, the slight vacuum caused by this exhaust system results in laboratory air being pulled into the testing room and the air within the test room being exhausted outdoors. This exhaust system was operated in between experiments to remove any emitted aerosol from the room. During experiments, the test room was operated with the exhaust damper closed and at a slight positive pressure (∼2 Pa). Blue painter’s tape was used to limit infiltration through the cracks around the test room door. Figure 1 shows the position of instrumentation during flow characterization and aerosol plume measurements.
Figure 1.
Top-down schematic view of test room set up for aerosol measurements (a) and flow characterization through schlieren imaging (b). Not drawn to scale. The test room has a glass window, allowing a researcher to monitor activities performed by subjects indoors. The door was kept open during flow characterization experiments to accommodate the light source and camera setup.
This test room is not a certified clean room and has a changing background concentration of particles over time, likely due to infiltration through the exhaust damper. To reduce background particle concentrations to the lowest possible level for these experiments, two portable air cleaners outfitted with HEPA filters (Air Response Air Purifier, Oreck), supplying a total effective particulate air exchange rate of 15 h–1, were run to decrease the background levels of airborne particles between test runs. Background measurements were also performed for each participant in which the participant turned the HEPA filters off and sat within the test room, without performing any activities, for ∼4 min. The total particle number background concentration in the chamber reported by the APS was 0.03–0.1 # cm–3.
During the experiments, a researcher stood outside the testing room to monitor the participant through a window in the chamber door. Participants were asked to not leave the testing room after the start of the experiment. The researcher communicated with the participant over video call while the participant was in the testing room to relay information to the participant about what to do. The floor and other surfaces of the testing chamber were cleaned with soap and water before and after each experiment.
A 0.58 × 0.41 × 0.31 m3 (53 L) polypropylene box was used to measure aerosol emissions directly from the bell of select musical instruments. The interior surfaces were lined with aluminum foil and grounded to minimize electrostatic losses. This box was operated inside the aerosol test room, and sampling inlets to all aerosol and gas-phase instruments were moved to this box during its use. HEPA filtered air was supplied to the box at 16 L min–1 to maintain a slight positive pressure of ∼1 Pa.
2.3. Mitigation Strategies
During aerosol measurements, we evaluated three mitigation strategies, specific to the type of performer: (1) surgical mask wearing by the singer and theater performer, (2) a surgical mask placed directly over the bell of woodwind instruments, and (3) a cover made of MERV-13 filter material inside of a Spandex layer, placed over the bell of the brass instruments. Using CFD modeling, we also estimated the effects of different ventilation strategies, length of performance time, and indoors versus outdoors location.
2.4. Flow Characterization
Prior to aerosol measurements, the subject came into the lab for flow visualization of their musical or vocal performance. The flow visualization was used to determine where the air flow escapes the instrument or mouth of each performer, the velocities of these plumes, and the length and width of the plumes. An aerosol plume was defined as located where the highest temperature/velocity flow field was identified and where the aerosol concentrations were highest. Flow visualization information guided researchers on where to position each participant (and their instrument) to collect aerosol and CO2 measurements from the plumes. Flow visualization experiments were performed through schlieren technique and laser sheet imaging, while velocity measurements were made with a hot wire anemometer (405i, Testo Inc., Lenzkirch, Germany). Flow videos were recorded at high speed (120 fps, at 1080 p resolution) and at regular speed (30 fps, at 4 K resolution) using two cameras (EOS 90D and EOS T3i, Canon, Tokyo, Japan) with a 300 mm focal length lens. The images were also analyzed quantitatively to calculate flow velocities. Velocity data was subsequently used for boundary conditions in CFD simulations.
2.4.1. Schlieren Imaging
The schlieren system used in this study consisted of a single mirror system as shown in Figure 2. The mirror was parabolic with a focal length of 2.44 m and a diameter of 0.3048 m. The light source was a MiniMag LED flashlight with the lens removed. The schlieren stop was a vertical razor edge. Estimates of jet velocity were made from the schlieren videos by manual frame-to-frame tracking of jet features. There are some limitations to schlieren imaging; e.g., it is difficult to differentiate between the air currents generated by body heat and the plumes from playing the instrument, particularly when imaging close to the body.
Figure 2.
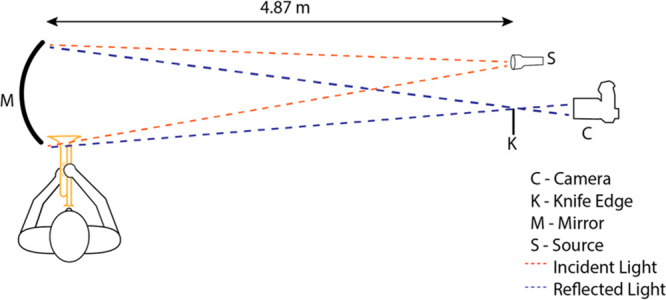
Top-down schematic of the schlieren setup.
Participants stood in front of the mirror and were asked to play the chromatic scale in whole notes with various locations of their instruments in view of the mirror: the bell, mouthpiece, and keys of the instruments. Musicians playing instruments were asked to tongue each note so that there would be adequate separation between the notes, and each note was recorded on video. The participant and researcher identified notes that produced exceptionally large or fast plumes.
2.4.2. Laser Sheet Imaging
For laser sheet imaging, the test room was filled with stage fog and circulated throughout the room. A 0.8 W blue continuous wave diode laser (assembled in house) was formed into a sheet by a 12.7 mm cylindrical lens to illuminate the fog. Although subjects inhaled the fog, their exhalations through the musical instruments were free of fog and showed as dark regions in images of the laser sheet. The same cameras as above were used to record images and videos, using a 24–105 mm lens. The laser sheet was alternately oriented perpendicular (front view) and parallel (side view) to the axis of each instrument’s bell. For cross-sectional images of the plume, the bell was typically 50–100 mm from the vertical sheet. To measure plume extent, the participant was positioned in the laser sheet. They were given opaque eye masks and swathed in black velvet, excepting only the opening a few inches into the bell, as shown in Figure 3. This both protected the participant and minimized stray reflections of the laser. However, draping the performer does disrupt the buoyant plume that normally surrounds the human body. At the same time, instruments are generally played while angled away from the body, minimizing the interaction of the instrument’s exhalation jets with the body’s thermal plume. Thus, the loss of the plume in the laser sheet imaging was deemed acceptable. In both orientations, movement of the musician while playing made these alignments approximate. Singers and theater performers were not imaged using this technique due to safety precautions. Subjects were asked to play the chromatic scale and a musical piece from memory. Spatial calibration images were also acquired for each setup.
Figure 3.
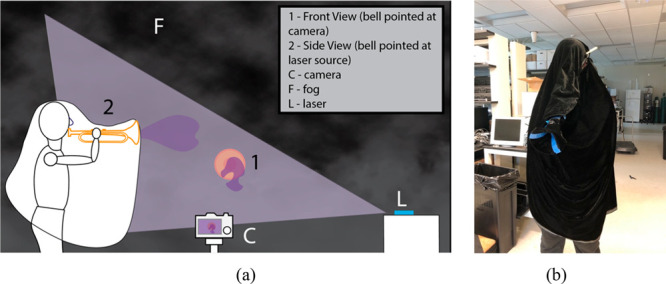
Laser sheet imaging: (a) schematic figure describing the experimental setup and (b) photo of the trumpet player prepared for imaging. The blue tape identifies the trumpet bell.
2.4.3. Velocities from Image Analysis
The schlieren and laser sheet videos were subject to video analysis. At the beginning of a note, the leading edge of the plume was manually tracked frame-to-frame for 1 s, from the bell of the instrument or mouth of the singer. Distance over time provided velocity. Distances were calibrated from frames showing a known scale, typically a U.S. letter (216 × 279 mm2) sheet of paper. The uncertainties for the schlieren velocities were ±15% and ±10% for the laser sheet values. These estimates account for the motion of the bell during the performance and the ability to accurately identify the edge of the plume front.
2.4.4. Anemometer Measurements
A hot wire anemometer was also used to measure the peak velocity of the principal flows in multiple locations for each musical instrument (e.g., bell, fipple, keys etc.) during notes that were identified through schlieren imaging to be especially fast or have a large extent coming from the bell. The subject played an extended note, and the researcher moved the anemometer probe around the bell and recorded the highest velocity measurement while the participant exhaled. Uncertainty was estimated at 20%, or 0.10 m s–1, primarily due to the variability of positioning.
2.5. Aerosol and Gas-Phase Plume-Level Measurements
An APS (APS 3321, TSI), a Licor (LI-7000, Li-Cor, Lincoln, NE), and an ultra high sensitivity aerosol spectrometer (UHSAS, Droplet Measurement Technologies, Boulder, CO) were used for plume-level measurements in the chamber. Total particle concentrations (∼0.5–10 μm) and particle size distributions (∼0.5–20 μm) were monitored using the APS. The APS was placed inside the test room using a 0.15 m straight conductive silicone inlet (3.18 mm inner diameter) sampling at 1 L min–1 to minimize particle losses. The APS measured one particle size distribution every minute. A limitation to using the APS is the ability to measure liquid particles close to or greater than 10 μm in diameter. Volckens and Peters found that efficiencies of liquid droplets progressively decreased from 75% for liquid droplets of 8 μm to 25% for 10 μm droplets.22
Particle size distribution (∼200–1000 nm) was monitored using the UHSAS, which was placed outside of the test room using a 1-m conductive silicone inlet (3.18 mm inner diameter). The overlapping size ranges of the UHSAS and APS were checked against each other.
Carbon dioxide (CO2) was used as a marker for respiratory activity, measured using the CO2/H2O nondispersive infrared spectrometer (Licor). The Licor and UHSAS sampled from the same line, with exhaust air from the UHSAS fed into the Licor. The Licor and UHSAS were placed outside the chamber to minimize noise, heat load, and particle emissions from associated pumps and sampled through a conductive silicone inlet (1 m length, 3.18 mm inner diameter), fed through a sampling port in the wall next to the APS inlet. The inlets for the Licor/UHSAS and APS were placed next to each other. Inlets were positioned based on flow visualizations results but also in part to accommodate the height of each musician, approximately 15–20 cm from the bell of the instrument or the mouth of the performer. For some musical instruments, the APS was placed on its side to minimize particle losses by avoiding bends in the inlet tube.
The Licor and UHSAS sampled CO2 and particle size distribution once per second. The Licor and UHSAS data were averaged to every minute. Aerosol measurements and CO2 were also averaged over the duration of each test from some of the analyses, and averaging times were usually around 4 min. The background particle concentration recorded during each experiment was subtracted from all of the data.
2.6. Aerosol and Gas-Phase Measurements from Individual Clarinet Keyholes
The clarinet was played into the small polypropylene box. Particle size distributions and CO2 concentrations were measured using the APS, UHSAS, and Licor with sampling ports on the backside of the box. The supply air to the box had 0 particles cm–3 particles and 0 ppm of CO2. The background concentration inside the box was approximately 0 particles cm–3 prior to each test. The same note, a “C” on the clarinet, was played for 4 min with and without a bell mask. A middle “C” on the clarinet (concert Bb) has one keyhole open near the bell of the clarinet when played. The three different tests performed in the box were as follows: playing with no bell mask, playing with a bell mask with the uncovered keyhole in the box, and playing with a bell mask with the uncovered keyhole outside of the box. These experiments were done to better understand emissions from the keyholes of the clarinet. The box was assumed to become well-mixed rapidly, so sampling was not done in the aerosol plume from the instrument’s bell, but rather from the mixed air in the box.
2.7. CFD Modeling of Singing and Clarinet Playing Rehearsals
Computational fluid dynamics was used to simulate the spread of the SARS-CoV-2 virus from the mouth of a singer and the bell of a clarinet while performing indoors and outdoors. Based on the concept of infectious quanta,23 CFD simulations used a passive scalar to represent the viral aerosol and then implemented the Well–Riley equation24 to estimate the infection risk of COVID-19. Quanta represent an infectious dose of respiratory aerosol when the viral dose to cause infection in people is unknown.12 The measured data from the aerosol emission experiments served as inputs into the CFD simulations as boundary conditions. This approach characterized the risk to musicians of potential airborne infection transmission under realistic music rehearsal scenarios.
2.7.1. Modeling of Indoor Environment
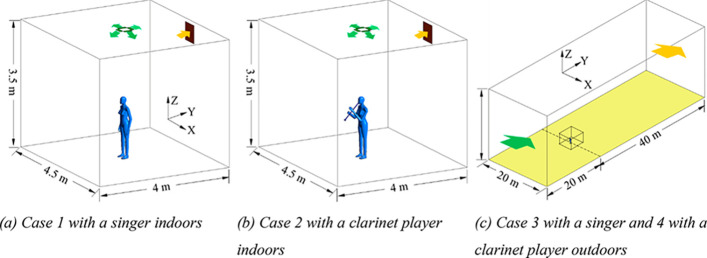
CFD modeling for a rehearsal room is shown in Figure 4(a) and (b). The information on indoor climate was provided by the facilities management about the University of Colorado Boulder rehearsal rooms. Virus-free air was supplied from the inlets at a spreading angle of 30° downward. The singer or clarinet player stood under the air supply diffuser, with a convective heat loss of 33.8 W from skin surface. For singing, air of 32 °C25 was exhaled at a speed of 0.56 m s–1.26 Based on measurements with a clarinet player in the aerosol testing room, the clarinet’s bell with a 6 cm diameter had air of 23.7 °C coming out at a speed of 0.9 m s–1, which is characteristic of an initial jet from the clarinet leading to a conservative estimate of risk. Moreover, the clarinet was positioned at 45° downward to represent a typical instrument position. The detailed CFD boundary conditions are listed in Table 1. We used the fine grid systems with around 1.654 and 1.8 M spatial cells in Case 1 and 2, respectively, and around 55 000 triangle meshes to capture the curved features of human body surfaces. As a result, the grid quality was ensured with aspect ratio under 8, and skewness equiangle under 0.8.
Figure 4.
Simulation domains for CFD modeling of indoor and outdoor music performances.
Table 1. Boundary Conditions for Indoor/Outdoor Domains and the Musician Body.
| indoor air inlets | size: 0.25 m × 0.1 m (4); ventilation rate: 3ACH; velocity inlet; V: 0.909 m s–1 at ±x or ±y direction and 0.525 m s–1 at −z direction; T: 22 °C, |
| outdoor air inlet | as given in eq 1 |
| air outlets | outflow; free slip |
| mouth opening | area: 3.8 cm2; velocity inlet; V: 0.56 m s–1; T: 32 °C |
| body surface | area: 1.47 m2; convective heat transfer: 33.8 W |
| room walls | adiabatic wall; no slip |
| bell opening | d: 6 cm; velocity inlet; V: 0.9 m s–1; T: 23.7 °C |
| sides and sky | symmetry |
| other wall surfaces | adiabatic wall; no slip |
2.7.2. Modeling of Outdoor Environment
Figure 4c gives the CFD modeling for the singing and clarinet playing cases outdoors. The surface meshes, geometry, and boundary conditions for the musician’s body and clarinet were the same as those used in the indoor cases. The singer/clarinet player was located in the middle of the ground plane and 20 m away from the inlet. At the inlet, the logarithmic wind profile U(z), the turbulence specification method, including turbulent kinetic energy (κ) and the turbulent dissipation rates (ε), and the temperature T were given as follows:27−30
| 1 |
where k is the von Karman constant (= 0.41), u* is the friction velocity, and z0 is the roughness length (= 0.003 m). The velocity at the height of 10 m (U10) is the bulk velocity, which was 1 m s–1. The details of other boundary conditions are given in Table 1. To save computational time, a small box of X6 m × Y6 m × Z3 m was created with the human body (with clarinet) standing at its center. We created the fine grid systems in the small box with around 2.64 and 2.69 M spatial cells in Cases 3 and 4, respectively. As a result, the quality of meshes in the small box was ensured with an aspect ratio under 7.2 and skewness equiangle under 0.82. A structured grid was employed for the space outside of the small box with a total number of 904 000 meshes.
2.7.3. CFD Numerical Methods and COVID-19 Risk Assessment
The CFD simulation used the Renormalization Group (RNG) κ–ε turbulent model,31 which solved the governing equations of mass conversation, momentum, energy, κ, and ε using the finite volume method.32 The Boussinesq assumption was applied considering buoyancy forces on the warm free convective airflow around the musician’s body. The PRESTO algorithm for pressure–velocity coupling was used, with the second-order upwind spatial discretization for other variables. The above CFD methods have been validated with the comparison to the experimental data of velocity, air temperature, and contaminant concentration distributions.33 The convergence criterion was 1 × 10⁻⁶ for energy, and 4 × 10⁻⁴ for the indoor cases and 1 × 10⁻⁴ for the outdoor cases for other variables.
The viral aerosol was expressed with infectious quanta (Wells, 1955) and represented by a passive scalar.23 For such small particles, evaporation would be completed in 0.03s with little influence from the environmental humidity and temperature;34 moreover, this small-sized bioaerosol is carried and spread by air currents.25 Quanta generation rate was set to be 48 quanta h–1.35 The convergence was satisfied with the residual reduced to under 1 × 10⁻⁶. We calculated using eq 2 the probability of aerosol COVID-19 infection, P, by applying the Wells–Riley equation24 with the CFD calculated quantum concentration distribution in the horizontal section at the height of mouth.
| 2 |
where P is the infection probability, p is the breathing rate (= 8 L min–1), N is the concentration of quanta (quanta m–3), which is the infectious dose of SARS-CoV-2, and t is the total exposure time that an occupant is exposed in the air mixed with the infectious aerosol.
3. Results and Discussion
In this section, we present results for a clarinet and a singing performer. Additional results for all other instruments and performers investigated in this study can be found in the Supporting Information (SI).
3.1. Flow Characterization
Figure 5 compares the maximum velocity measurements across the different methods used. Reasonable agreement can be seen despite the somewhat crude techniques and high uncertainty. These measurements were not designed to be comprehensive but were made to guide the plume measurements and initial CFD modeling. Detailed particle image velocity measurements are in progress.
Figure 5.
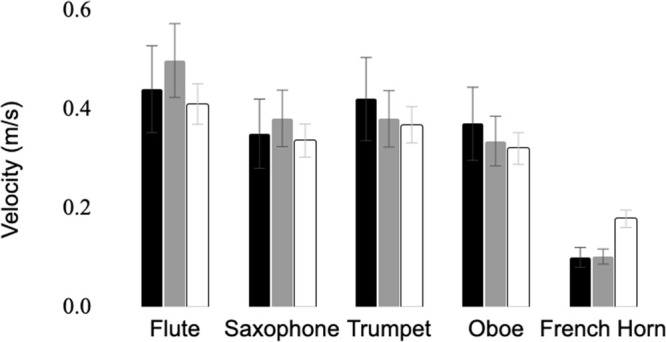
Maximum measured velocities and estimated uncertainties using hot wire anemometry (black), schlieren (gray), and laser sheet imaging (white).
We found that musicians and performers produce prominent jets. The jets are complex, unsteady, and highly three-dimensional as demonstrated by laser sheet images from the clarinet. Video S1 (clarinet B flat major scale) of the side view as scales are played shows disorganized vortices, although the flow is not truly turbulent, having a limited range of length scales. At a Reynolds number of 540 based on the bore diameter of d0 = 21 mm (measured at the junction between the bell and the lower joint) and an average speed of 0.4 m s–1, the flow is transitional at most. Note that the air in the chamber was not stagnant during filming due to filters running and a small laser cooling fan. The video also shows that notes in the upper register overall produce jets of higher velocities out of the instrument’s bell compared to most notes in the lower register. Anemometer measurements confirmed this, as well as showing that the lower registers have higher velocities out of the keyholes. The diameter of the jet from the clarinet was measured from the side view laser sheet videos at the plane of the bell. The initial jets ranged from 0.37 to 0.95d0, depending on the note played. The jet diameter was dependent upon how many key holes were closed, and how fast the jet was traveling.
Using a bell mask substantially decreased the speed and extent of the jet coming from the bell of the instrument (Video S2: clarinet side with and without (w-wo) mask, 1/4 speed recorded at 120 fps; Video S3, clarinet front w-wo mask, normal speed). The maximum horizontal velocity coming from the bell of the clarinet was 0.4 m s–1 without a bell mask and 0.06 m s–1 with a bell mask made out of two layers of 80 denier pantyhose. The maximum jet length measured from the bell observed in the side view laser sheet from the clarinet was 15d0 (317.5 mm) without a bell mask and 4d0 (80 mm) when a bell mask was utilized.
An even more dramatic reduction in jet speed and extent was seen in the case of the singer. The maximum horizontal velocity for singing was 0.78 m s–1 without a mask and 0.01 m s–1 with a mask. This finding is comparable to previous studies. A preprint study of 3 professional singers found a maximum singing velocity of 0.7 m s–1.36 Giovanni et al. found that air velocity varied from 0.28 to 1.8 m s–1 depending on the vocal exercise that was performed.37 The velocity for singing from this study was lower than what was found by Chao et al. for talking and coughing (3.9 and 11.7 m s–1 respectively).38 Without a mask, the direction of the jets produced by the singer varies dramatically depending on the consonant or vowel sounds that are being spoken as the alphabet is recited, as seen in the schlieren imaging of Figure 6 (Video S4: voice alphabet, 1/2 speed), played back at half speed. A jet interaction between mouth and nose can be seen during several letters, including J, L, N, U and Y. Again, although there is a prominent jet and the flow appears well-mixed, a Reynolds number estimate for the letter F is still only 260, based on a diameter of 0.5 cm and a velocity of 0.8 m s–1, indicating that viscous effects are important. For singing, using a mask almost completely blocked air flow in the horizontal direction as shown in Figure 7 (Video S5: singing w-wo mask). The schlieren imaging also indicated vertical air leaks at the top of the mask despite our attempts to properly fit it. The leakage flow was measured to be 0.3 m s–1.
Figure 6.
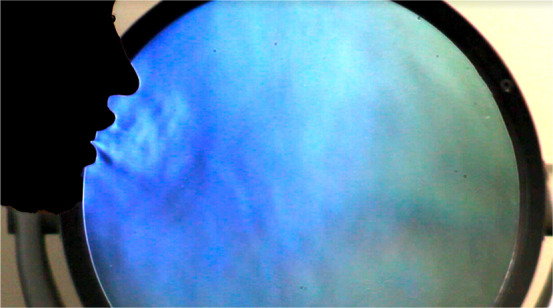
Schlieren image during speaking.
Figure 7.
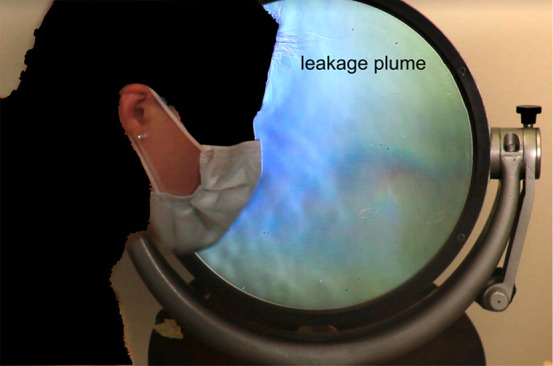
Observed leakage plume.
Figure 8 summarizes jet velocity measurements with and without masks, showing that masks are effective at reducing potentially infective plumes. The maximum estimated error in our measurements is 0.1 m s–1.
Figure 8.
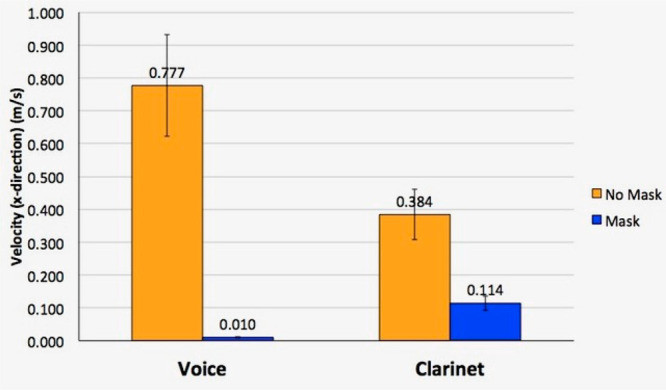
Average horizontal velocities (from schlieren imaging) are drastically reduced with mask.
3.2. Aerosol Emissions from Singing and Playing Clarinet
Particle concentrations measured in the plume as a function of time and activity are shown in Figures 9 and 10. Noticeable spikes in aerosol production correspond with performance activity not utilizing mitigation measures. When masks were used by performers, the particle number concentration was comparable with background levels and levels measured while reading. The majority of aerosol number emitted from playing the clarinet and singing were particles with diameters less than 2.5 μm in diameter. The clarinet player produced a higher number of sub-micrometer sized particles compared to the singer. There were noticeable spikes in the number of particles < 1 μm in the same time periods for both the singer and clarinet player (Figures 9 and 10). Liu et al. mainly found SARS-CoV-2 in two size ranges, 0.25–1 and >2.5 μm.7 Particles less than 200 nm in diameter are not shown in the figure as they are less likely to contain SARS-CoV-2.
Figure 9.
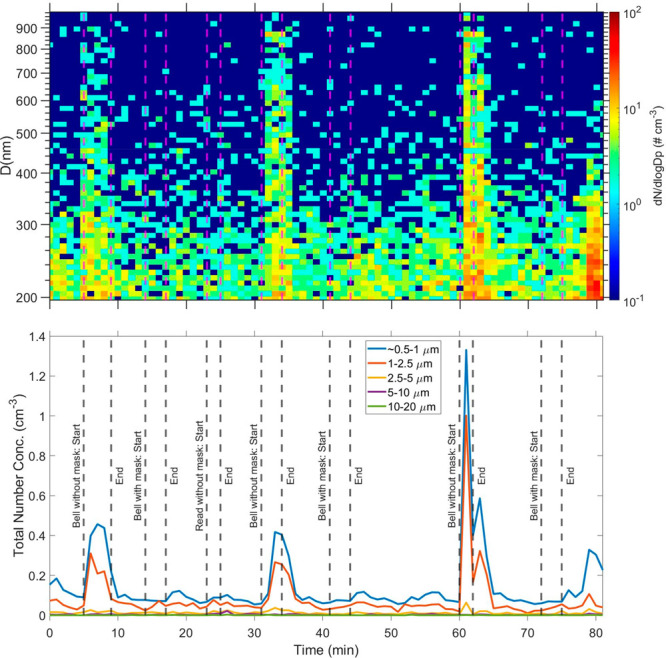
UHSAS size-resolved number concentration over time from 400 to 1000 nm for clarinet player (top). The UHSAS particle concentrations were averaged over 1 min. APS size-resolved number concentrations over time of clarinet player (bottom) for particles in the ranges: 0.523–1, 1–2.5, 2.5–5, 5–10, and 10–20 μm. Sampling was done at the bell of the instrument.
Figure 10.
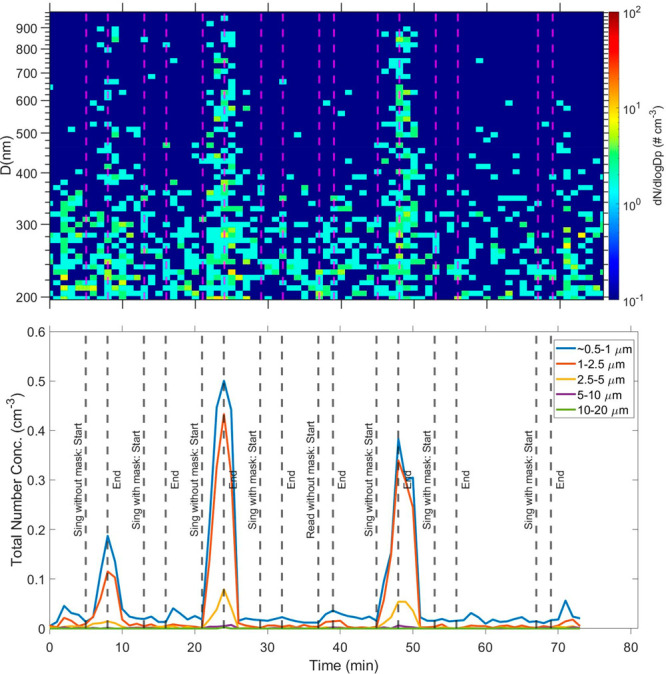
UHSAS size-resolved number concentration over time from 400 to 1000 nm for singer (top). The UHSAS particle concentrations were averaged over 1 min. APS size-resolved number concentrations over time of singer (bottom) for particles in the ranges: 0.523–1, 1–2.5, 2.5–5, 5–10, and 10–20 μm. Sampling was done at the bell of the instrument.
Aerosol measurements from APS and UHSAS showed good agreement in their overlapping size range of ∼540–980 nm for total number concentration (Figure 11).
Figure 11.
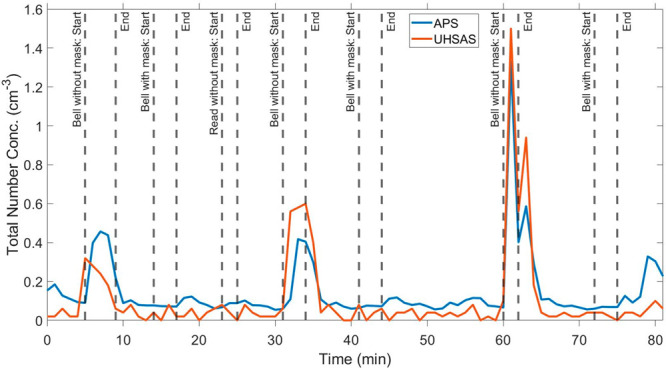
UHSAS and APS total number concentration for clarinet player for the overlapping size range common between the two instruments, ∼540–980 nm. Time series of total concentrations played on the clarinet.
Exhaled aerosol concentrations measured in this study are comparable to prior literature, although we note that observed aerosol concentrations vary with the distance measured from the source, the loudness of the musician’s playing, and the notes that the musician plays. In addition, various experimental designs were used across studies, which will lead to different aerosol losses. We also expect differences because of relative humidity and other environmental factors. A prior study utilizing an APS in which participants performed into a conical inlet found aerosol concentrations measured at the bell of the instrument ranging from 0.02–2.4 particles cm–3.20 He et al. found that the clarinet generated approximately ∼ 0.1–0.3 particles cm–3.20 The data from this study, however, showed that the aerosol concentration measured at the clarinet’s bell to be upward of 2.4 particles cm–3, comparable in magnitude to singing rather than normal speaking levels. McCarthy et al. found that the clarinet generated approximately 0.1 particles cm–3 in the low note range, comparable to what they found for breathing, and approximately 2 particles cm–3 in the high note range.39 The plume generated by playing the clarinet was highly directional, had high velocity, and dispersed quickly, which may lead to discrepancies between the studies. Our results that singing produced more aerosol compared to normal speaking levels are in agreement with Alsved et al.19
3.3. Aerosol and CO2 Results
CO2 can be used as a tracer for breathing and has a concentration of approximately 38 000 ppm in breath.40 As the breath mixes into the ambient air, the CO2 concentration decreases, which happens with both time and distance from a breath plume event. We used CO2 as a tracer for the plume and calculated a particle-CO2 emission factor (EF), that is the total number concentration of particles of a certain size per ppm of CO2 increased above the background CO2 concentration. This ratio enabled us to normalize for the plume’s dispersion into the ambient air for small particles. We estimate for the singer for particles > 0.5 μm an EF of (1.1 ± 0.2) × 10–4 cm–3 per ppm of CO2, and for the clarinet player 1.6 × 10⁻⁴ (±6.7 × 10⁻⁵) cm–3 per ppm of CO2 after removing one outlier point with a much higher ratio of 7.4 × 10⁻⁴ cm–3 per ppm of CO2. This outlier occurred at the beginning of the last test when the instrument was warm and wet. It is likely that there was resuspension of particles within the clarinet during this sample.
There was a steady rise in CO2 concentration of approximately Δ300–500 ppm in the room during the singer and clarinet player’s performances as the participant respired. The distinct peaks of CO2 occurred during activities where the participant was close to the inlet and the plume was sampled, including when they were performing and speaking. There were noticeably large peaks in CO2 when each participant was asked to read the passage at normal speaking levels; however, there were no similar peaks in particle emissions during the same interval (Figures 12 and 13). This is contrasted with the times when the participants played the clarinet or sang with no mask, in which there was a significant peak in both particle and CO2 emissions above background levels.
Figure 12.
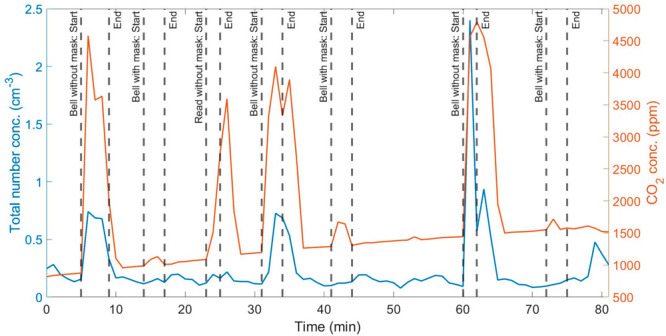
Total APS particle concentration over time (left axis) and total CO2 concentration over time (right axis) for clarinet player.
Figure 13.
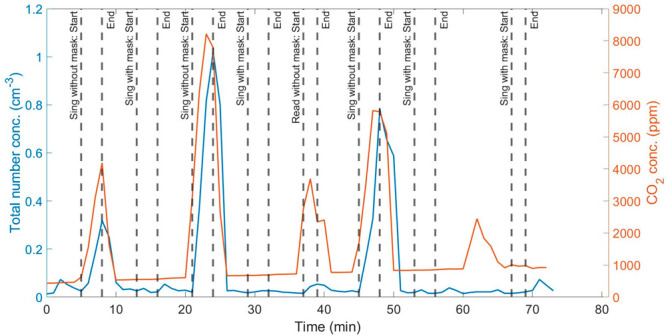
Total APS particle concentration over time (left axis) and total CO2 concentration over time (right axis) for singer.
By measuring CO2 and aerosol simultaneously, we can compare plumes from a variety of human-generated sources. For example, the large peak in CO2 without a correspondingly large peak in aerosol suggested that the emission rate of small particles when speaking at a normal level was low compared to singing or playing the clarinet (Figure 12). In addition, the ratio of total particle number concentration per ppm of CO2 was similar for singing and playing the clarinet, suggesting similar particle emission rates. Particle emission rate can be estimated from these ratios when the volumetric flow rate of playing the instruments is known.
We can also compare this EF to one estimated for breathing from the median number concentration of particles produced while breathing of 0.28 cm–3 (0.07, 0.64 interquartile range) measured by Gregson et al.41 and the volume fraction added to exhaled breath during breathing of 0.038 estimated by Rudnick and Milton.40 From the above values, we get a median EF of 7.4 × 10⁻⁶ (1.8 × 10⁻⁶, 1.7 × 10⁻⁵ interquartile range) cm–3 per ppm of CO2, which is 2 orders of magnitude lower than that for singing and clarinet playing.
Combining CO2 concentrations with flow visualization is also a powerful tool. For example, aerosol number concentrations decreased significantly in front of the emission source when a mask was used but so too did the flow velocities and CO2 concentrations. A decrease in both CO2 concentration and flow velocity together showed that flow is became attenuated and well-mixed as it passed through the mask. The aerosol concentration measured in front of the mask compared to without it thus was not just due to the efficiency of the mask, for the mask also dispersed the plume’s flow.
3.4. Aerosol Emissions from Open Clarinet Keyhole
The purpose of these experiments was to elucidate to what extent the particles leaking from keyholes contribute to emissions, especially when a surgical mask is used to cover the clarinet’s bell (Figure 14; Table 2).
Figure 14.
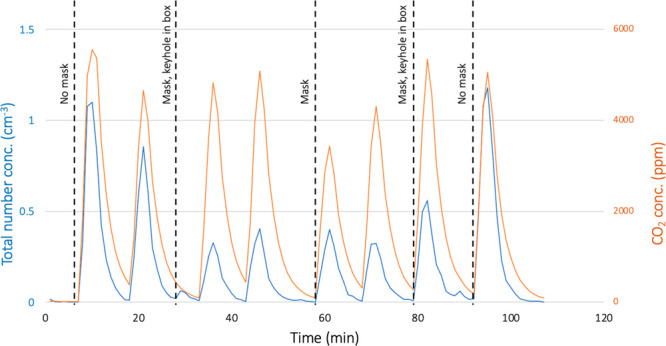
Clarinet played into a 53 L box. Samples include the clarinet without a bell mask, the clarinet with a bell mask in which the open keyhole is not contained in the box, and the clarinet with a bell mask in which the open keyhole is contained in the box. Total number concentration of particles with diameters > 0.5 μm (left axis), CO2 concentration, ppm (right axis).
Table 2. Average Peak Total Aerosol Concentration of Particles with Diameters > 0.5 μm, Average Peak CO2 Concentration, and Total Particle Concentration > 0.5 μm per ppm of CO2 Measured during Experiments Playing a Clarinet into the Box (±1 SD).
| avg peak total aerosol concn (cm–3) | avg peak ΔCO2 concn (ppm) | total particle concn (cm–3) obsd per ppm of CO2 | |
|---|---|---|---|
| no bell mask | 1.0 (±0.17) | 4900 (±630) | 2.2 × 10⁻⁴ (±3.0 × 10⁻⁵) |
| bell mask and open keyhole inside box | 0.42 (±0.12) | 4800 (±230) | 9.9 × 10⁻⁵ (±2.9 × 10⁻⁵) |
| bell mask and open keyhole outside box | 0.36 (±0.06) | 3700 (±470) | 1.0 × 10⁻⁴ (±1.6 × 10⁻⁵) |
All the particles and CO2 in this enclosure are emitted by the musician or may have shed from the bell mask.
A Student’s t test showed no significant difference in peak CO2 concentration when the bell was uncovered compared to when the bell was covered with a surgical mask and the open keyhole was contained in the box (p = 0.84). However, there is a significant decrease in the peak change in CO2 concentration when the clarinet was played with the covered bell contained in the box without contribution of the open keyhole (p = 0.044), indicating that respiratory emissions do exit the open keyhole.
The EF was calculated during the times when the clarinet was played and emitting particles. We conducted a Student’s t test between each of the EF ratios. The EF is higher when the clarinet’s bell is not covered compared to when it is covered with a surgical mask (p < 0.0001). There was no difference between the EF when the open keyhole was contained in the box compared to when it was not enclosed (p = 0.74). This keyhole is always slightly obstructed by a small key of cork and metal on which moisture collects over time, and so while CO2 escaped the keyhole, respiratory aerosol did not.
The experiments with the clarinet being played into the box is an integrated signal of the plume-level measurements with rapid dispersion into a small well-mixed volume. The concentration of CO2 in the box can be related to the amount of air the musician breathed into it. We found that the total aerosol concentration per ppm of CO2 when a bell mask was used was approximately half the total aerosol concentration per ppm of CO2 when no bell mask was used. This suggests that the aerosol emissions fell by approximately 50% for the same amount of respiration when a bell mask was used. Aerosol decreased more rapidly in the box compared to CO2 due to surface losses.
3.5. Effect of Control Measures across Different Types of Musical Performance
Aerosol measurements taken near the instrument’s bell or in front of a singer’s mouth were decreased when a face or bell mask is worn (Figure 15). There was a large standard deviation for each of the noncontrol tests without masks due to variability in plumes of relatively low aerosol concentrations.
Figure 15.
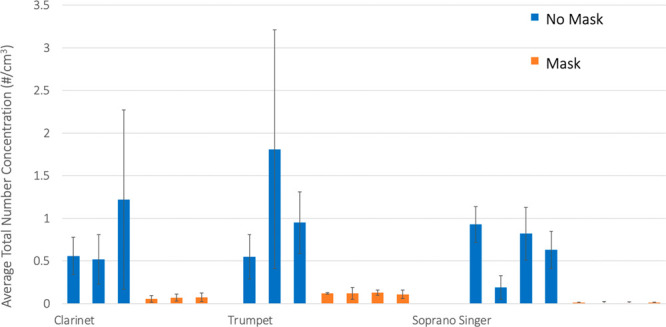
Average total particle number concentration (>0.5 mm in diameter) above background levels for clarinet, trumpet, and soprano singer with and without masks; surgical mask material, MERV-13 and Spandex material, and surgical mask for clarinet, trumpet, and singer, respectively. The error bars are ±1 SD. Each test was 4–5 min in length.
The plume measurements we collected should be understood in the context of the flow imaging. Because the plumes were highly directional, variable, had significant velocity, and dispersed rapidly, small differences in the participant’s plume location impacted aerosol measurements, leading to high variability in the plume-level aerosol measurements. We measured CO2 to account for variability in plume-level measurements because the plumes disperse rapidly in time and space.
This study agrees with previous work that control measures such as masks when singing or speaking decrease the aerosol released into a room42−44 and that mask fit is important.45
We saw almost no fluctuations in CO2 concentrations in front of the face when a mask was worn compared to background increases in CO2, suggesting little breath from the participant was passing through the mask but was instead passing out the top and sides between the face and the mask. Likewise, total aerosol concentration measured in front of the singer’s mask were similar to background levels. As an exploratory measure to understand gaps in masks, we probed gaps around the surgical mask and saw high aerosol and CO2 concentrations at the gap between the mask and face near the singer’s ear, a location not easily seen through schlieren imaging. This showed that aerosol easily escaped through gaps in a mask following streamlines about the face indicating which indicates the importance of fit.
3.6. Computational Fluid Dynamics
The CFD results shown here are local air velocities, concentrations of emitted respiratory particles, and risk of airborne transmission integrated over different time periods. These results provided the basis for an analysis of trade-offs between risk to musicians and time spent in rehearsals. All the following results show a singer or clarinet player performing without masks.
3.6.1. Velocity Distribution
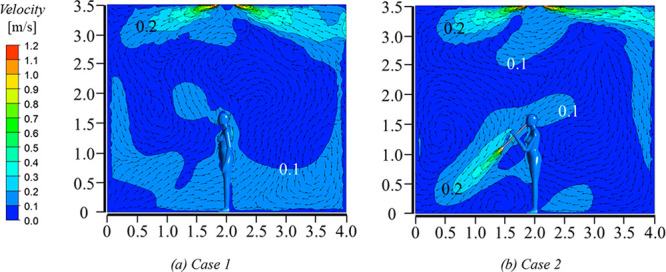
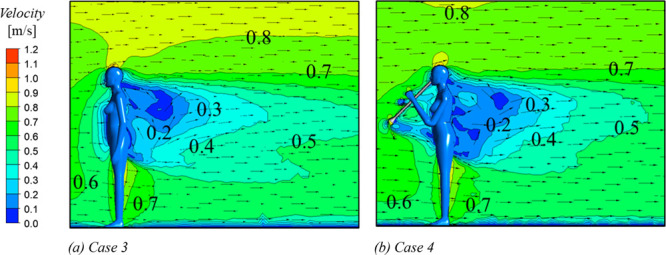
Figures 16 and 17 present the spatial velocity distributions in the vertical section across the middle plane of the musician’s body in indoor and outdoor environments, respectively. The air velocities are similar in the wake of the musician’s body in both indoor and outdoor environments. Additionally, the outdoor airflow pattern was primarily driven by incoming wind, while the airflow pattern in the indoor rehearsal room was driven by both the musician’s activities and air supply into that confined space. Figure 16 shows that the fluid field is relatively weak indoors and air movement was determined by the interactions of ventilation airflow, thermal plume around the musician’s body, and exhaled airflow from the mouth or clarinet’s bell opening.
Figure 16.
Flow field in the vertical section through the middle of musician’s body in an indoor environment. X and Y axes show distances in meters.
Figure 17.
Flow field in the vertical section through the middle of the musician’s body in an outdoor environment.
In Case 1 with a singer, air in the lower portion of the room was attracted and accelerated by the thermal plume around the musician’s body, which was impacted by the exhaled airflow with a high momentum. The mixing of exhaled air with the thermal plume potentially enhanced the spread of exhaled aerosol at the height of mouth. In Case 2 with a clarinet player, the posture of playing the clarinet impedes the rising thermal plume. In addition, the expelled airflow from the bell’s opening attracted the surrounding air and formed two air circulations above and below the expelled airflow, which may trap the expelled particles. The wind speed around the musician’s body is higher outdoors compared to indoors. As a result, in both the cases, ambient wind demonstrates an overwhelming superiority in its interruption with exhaled airflow and thermal plumes around the musician’s body, resulting in a similar flow field in the vicinity of the musician’s body, especially the wake flow behind the body. It is notable that, except in the area with wake flow, air is moved in the horizontal direction, with rare vertical mixing. Moreover, in the indoor environment, playing the clarinet weakens the thermal plume around the musician’s body, resulting in a slightly higher velocity above the head.
3.6.2. COVID-19 Quanta Concentration Distribution
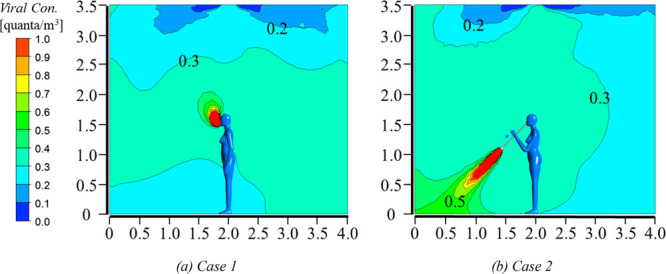
Figures 18 and 19 present the spatial distributions of viral quanta concentrations in the vertical section across the middle of the musician’s body in indoor and outdoor environments, respectively. In the indoor environment with a singer (Figure 18a), because exhaled air has a higher temperature than the ambient temperature, exhaled respiratory particles spread upward due to the buoyancy effect soon after being exhaled from the mouth. High concentrations of >1 quanta m–3 are limited in a narrow range close to the face. Because of the mixing of thermal plume and exhaled airflow, the quanta concentration is relatively higher throughout the middle portion of the room, including the breathing zones. In the indoor environment with a clarinet player (Figure 18b), there are high concentrations at the left lower corner. Due to the air circulation patterns, aerosol is spread through the whole room after the mixing of airflows. The high concentrations of >1 quanta m–3 are only distributed in front of the bell opening.
Figure 18.
Quanta concentration distribution in the vertical section across the middle plane of the musician’s body in the indoor environment. X and Y axes show distances in meters.
Figure 19.
Quanta concentration distribution in the vertical section across the middle plane of the musician’s body in the outdoor environment. X and Y axes show distances in meters.
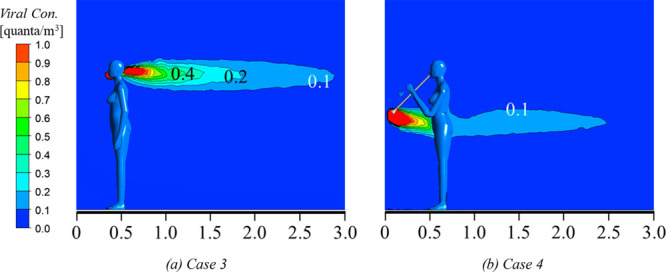
As shown in Figure 19, in the outdoor environment, dominated by the ambient wind, the mixing of aerosol around the musician’s body is not as evident as it is indoors, especially in the vertical direction; and the airborne particles are brought away soon after being expelled. In Case 3, the quanta concentrations of >0.1 quanta m–3 only exist in a narrow area behind the head. In Case 4, the high quanta concentrations of >0.2 quanta m–3 are restricted in a narrow area between the bell and musician’s body. Importantly, the quanta concentration is <0.1 quanta m–3 at the height of mouth when playing clarinet outdoors.
3.6.3. COVID-19 Infection Risk by the Wells–Riley Equation
An infection risk assessment is the final step in the CFD analyses of music rehearsal events. Figures 20 and 21 show the distributions of COVID-19 infection risk by viral aerosol in the vertical section across the middle plane of the performer’s body, after 30 and 60 min exposures, which are calculated by the quanta concentrations with eq 2, both indoors and outdoors, respectively. In the indoor environment, infection risk is mostly below 0.1 (<10% chance of infection) except for a small area around the mouth in Case 1 with a singer or the left lower corner in Case 2 with a clarinet player after a 30 min performance. However, the risk increases to above 0.1 across the section after a 60 min exposure in both indoor cases.
Figure 20.
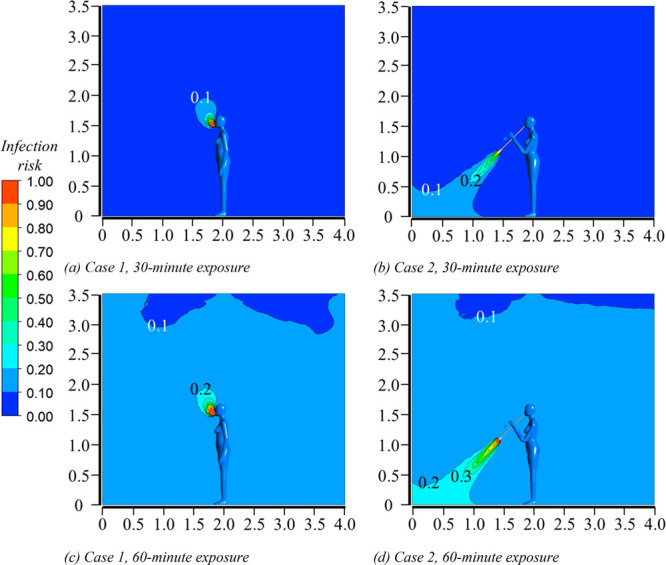
Quanta concentration distribution in the vertical section across the middle plane of the musician’s body in the outdoor environment. X and Y axes show distances in meters.
Figure 21.
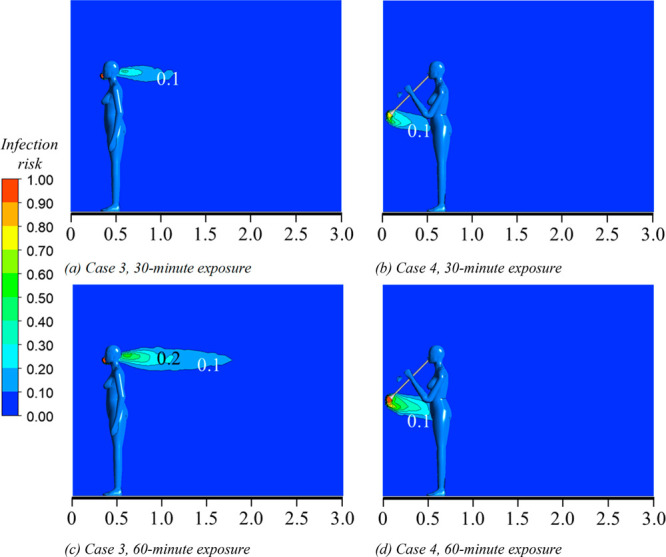
Infection risk distributions in the vertical section across the middle plane of the musician’s body in the outdoor environment. X and Y axes show distances in meters.
As shown in Figure 21a and b, in the case with a singer, the infection risk is only higher than 0.1 within 1.0 m behind the musician’s body at the height of breathing zone after a 30 min performance, but this range is extended to 1.5 m behind the musician’s body after 60 min of singing. In the case with a clarinet player, infection risk is only higher than 0.1 between the clarinet’s bell and musician’s body at the height of the bell.
A previous study found that the influence of an air distribution system on exposure risk is generally the same regardless of the duration of an event, after steady-state conditions have been achieved, although the turbulence can contribute to some dynamic uncertainties.46 The steady-state CFD simulations in this study for the indoor environment show that, even abiding by the 1.83 m (6 ft) social distance rule, the infection risk continuously increases with the duration regardless of the distance to the singer or clarinet player. The infection risk can be confined to under 0.1 with a 30 min performance. Moreover, due to mixing from the ventilation flow, the infection risk is similar regardless if the aerosol are comes from mouth or from the clarinet’s bell opening. When playing the clarinet, the clarinet’s angle has little influence on the resulting infection risk for an audience staying 6 ft away from the player, under such a ventilation and air mixing condition.
The outdoor environment was simulated at an ideal steady-state, without changes in wind speed and direction. However, the simulation results show a difference between indoor and outdoor wind conditions, as well as the differences in the spread of exhaled aerosol. In the outdoor environment, the ambient wind shows an overwhelming effect on the spread of exhaled aerosol, and the particles are soon dispersed far away. Therefore, the distribution of quanta concentration and infection risk will be qualitatively similar to a general wind environment experienced outdoors. Moreover, the simulation represents a single wind direction, so considering that the wind often changes its direction, the presented quanta concentrations and infection risk will likely occur in a radius around the musician’s body, rather than just behind the musician’s body. For the case of the clarinet player, the quanta concentrations and infection risk may be slightly different due to the relative position to the musician’s body, but it is conceivable that most likely they will be distributed at a height lower than the breathing zone. Infection risk is confined under 0.1 for the audience with a social distance of 1.83 m (6 ft) to the singer after a performance of 60 min, and playing the clarinet may not cause remarkable infection risk under horizontal airflow.
4. Conclusions
While to date there have been no large outbreaks reported from playing musical wind instruments, there have been recorded outbreaks from choirs.12 Our study showed that performing with musical instruments produced a greater number of airborne particles compared to normal speaking levels and comparable levels to singing and theater performances. Using masks greatly reduced the aerosol concentration measured in front of the source. Plumes from talking, singing, and performing musical instruments were highly three-dimensional and varied considerably in time and space. The plumes decay rapidly and are highly unsteady, which leads to large variations in our plume-level measurements. In addition, our flow characterization data show that when masks were used, plumes were shorter and plume velocities decreased, which decreased the trajectory of highly concentrated jets of aerosol.
Previous studies have included schlieren imaging, high-speed cameras to count particles, and aerosol measurements from singers and various musical instruments.15,19,20 When sampling aerosol, other studies have sampled via a cone connected to capture the aerosol from the source.19,20 We instead first visualized the airflow and then measured aerosol in these airflows by probing the plume created by the performance with multiple inlets positioned near each other, one inlet for particles > 0.5 μm in diameter using an APS and the other for particles < 1 μm in diameter using a UHSAS and CO2 concentration using a Licor 7000. Measuring CO2 enabled us to calculate an emission factor of the number of particles generated per ppm of CO2, which can be used to compare aerosol generation rates across respiratory particle-generating activities. Flow visualization and plume-level measurements both showed that masks attenuated flow of the plumes generated when playing musical instruments and singing. Through testing the clarinet in a small well-mixed box, we were able to integrate the signal of the plume measurement within a smaller volume. We found that the surgical mask was effective at decreasing aerosol emissions from the clarinet by approximately 50% and that the keyhole did not significantly contribute to aerosol generation.
CFD modeling showed differences between outdoor and indoor environments of singing and playing the clarinet without masks. In an outdoor environment, ambient wind breaks the musician’s thermal plume and expelled airflow and accelerates the dilution of aerosol. In an indoor environment, the musician’s thermal plume and expelled airflow contribute to the spread of aerosol due to space confinement. In addition, the indoor walls force the formation of smaller eddies and the consequent distribution of the particles. To minimize infection risk to musicians and audiences via aerosol, this study showed the lowest risk with an exposure duration of less than 30 min for indoor singing and clarinet playing and an exposure duration of less than 60 min for an outdoor performance.
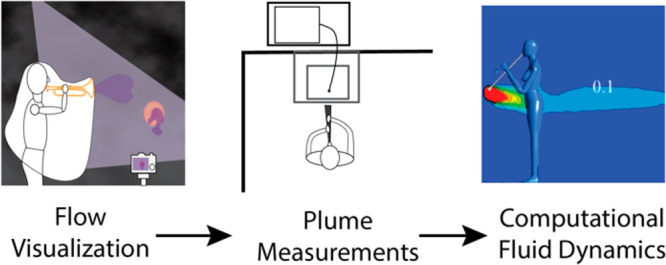
By combining flow visualization, plume-level measurements, and computational fluid dynamics, we were able to combine our understanding from one method in order to inform another and develop a holistic understanding of the potential risks of musical performance.
Acknowledgments
We would like to thank all of the music organization supporters for their enthusiastic contributions to our study. We would also like to thank the CU Boulder music program for helping us find participants, and to the many musicians who came to our lab and played for us in this study. We also thank our colleagues across the world who are studying aerosol emissions from playing musical instruments and singing for their valuable contributions to the design, execution and data interpretation of this study.
Supporting Information Available
The Supporting Information is available free of charge at https://pubs.acs.org/doi/10.1021/acsenvironau.1c00007.
Recommendations for musicians based on our study findings and results for additional musical instruments tested (PDF)
Side view of clarinet B flat major scale as scales are played (MP4)
Side view of clarinet side with and without a mask, 1/4 speed recorded at 120 fps (MP4)
Front view of clarinet with and without a mask, normal speed (MP4)
Subject reciting alphabet, no mask, 1/2 speed (MP4)
Subject singing scales with and without a mask (MP4)
This work was supported by an international coalition comprising the following organizations: College Band Directors National Association (CBDNA), National Association of Music Merchants (NAMM), National Federation of State High School Associations (NFHS), D’Addario Foundation, Alabama Music Educators Association, American Choral Directors Association (ACDA), American School Band Directors Association (ASBDA), Arts Ed NJ, Athletes and the Arts, Association for Body Mapping Education, Association of Anglican Musicians (AAM), Association of Concert Bands, Barbershop Harmony Society, California Youth Symphony Association, Canadian Band Association (CBA), Choral Canada, Church Music Publishers Association (CMPA), College Orchestra Directors Association (CODA), Country Music Association Foundation, Fargo-Moorhead Orchestral Association, Florida Music Education Association (FMEA), French Musical Instrument Organisation (La Chambre Syndicale de la Facture Instrumentale, CSFI), Gala Choruses, Halifax Concert Band Society, Indiana Choral Directors Association, Indiana State School Music Association, Indianapolis Children’s Choir, International Double Reed Society (IDRS), International Music Council, Kansas Bandmasters Association (KBA), Kappa Kappa Psi, Kentucky Music Educators Association (KMEA), Lakeville Area Community Band, League of American Orchestras, Lesbian & Gay Band Association, Maine Music Educators Association (MMEA), Manitoba Band Association, Mid Penn Band Organization, Music Association of California Community Colleges (MACCC), Music for All, Music Learning Band Program, Music Teachers National Association (MTNA), Music Publishers Association, National Association for Music Education (NAfME), National Association of Teachers of Singing (NATS), National Collegiate Choral Organization (NCCO), National Guild for Community Arts Education, National Music Council of the US, National Speech and Debate Association (NSDA), New Horizons International Music Association (NHIMA), New York State Band Directors Association, New York State School Music Association (NYSSMA), North Carolina Music Educators Association, Nova Scotia Band Association, Oahu Band Directors Association, Ohio Foundation for Music Education (OFME), Ohio Music Education Association (OMEA), Opera America, Orcas Island Community Band, Orchestras Canada/Orchestras Canada, Organization of American Kodály Educators (OAKE), Performing Arts Medicine Association (PAMA), Phi Mu Alpha Sinfonia, Quadrant Research, Saskatchewan Band Association, Sigma Alpha Iota Philanthropies, Sing A Mile High International Children’s Choral Festival, Slate Valley Singers, Songwriters Guild of America (SGA), South Dakota Bandmasters Association, South Dakota Music Education Association, Surrey Music Educators Association, Sweet Adeline’s International (SAI),Tau Beta Sigma, Tennessee Music Education Association (TMEA), Texas Bandmasters Association, Texas Music Educators Association (TMEA), The College Music Society and The CMS Fund, The Main Street Singers, Inc. (Main Street Children’s Choir), The National Catholic Band Association, The Sinfonia Educational Foundation, The Voice Foundation, Virginia Music Educators Association, Voice and Speech Trainers Association (VASTA), Wisconsin School Music Association, Women Band Directors International (WBDI), World Association for Symphonic Bands and Ensembles (WASBE), Young Voices of Colorado, ACC Band Directors Association, Big 12 Band Directors Association, Big 10 Band Directors Association, PAC 12 Band Directors Association, SEC Band Directors Association, Clemson University Bands, Linn-Benton Community College Bands, UCLA Bands, Utah State University Bands.
The authors declare no competing financial interest.
Supplementary Material
References
- Morawska L.; Cao J. Airborne Transmission of SARS-CoV-2: The World Should Face the Reality. Environ. Int. 2020, 139, 105730. 10.1016/j.envint.2020.105730. [DOI] [PMC free article] [PubMed] [Google Scholar]
- Chia P. Y.; Coleman K. K.; Tan Y. K.; Ong S. W. X.; Gum M.; Lau S. K.; Sutjipto S.; Lee P. H.; Son T. T.; Young B. E.; Milton D. K.; Gray G. C.; Schuster S.; Barkham T.; De P. P.; Vasoo S.; Chan M.; Ang B. S. P.; Tan B. H.; Leo Y. S.; Ng O.-T.; Wong M. S. Y.; Marimuthu K. Detection of air and surface contamination by SARS-CoV-2 in hospital rooms of infected patients. Nat. Commun. 2020, 11, 2800. 10.1038/s41467-020-16670-2. [DOI] [PMC free article] [PubMed] [Google Scholar]
- Ding Z.; Qian H.; Xu B.; Huang Y.; Miao T.; Yen H.-L.; Xiao S.; Cui L.; Wu X.; Shao W.; Song Y.; Sha L.; Zhou L.; Xu Y.; Zhu B.; Li Y. Toilets dominate environmental detection of severe acute respiratory syndrome coronavirus 2 in a hospital. Sci. Total Environ. 2021, 753, 141710. 10.1016/j.scitotenv.2020.141710. [DOI] [PMC free article] [PubMed] [Google Scholar]
- Guo Y.; Wei J.; Ou C.; Liu L.; Sadrizadeh S.; Jin T.; Tang L.; Zhang Y.; Li Y. Deposition of Droplets from the Trachea or Bronchus in the Respiratory Tract during Exhalation: A Steady-State Numerical Investigation. Aerosol Sci. Technol. 2020, 54 (8), 869–879. 10.1080/02786826.2020.1772459. [DOI] [Google Scholar]
- Jiang Y.; Wang H.; Chen Y.; He J.; Chen L.; Liu Y.; Hu X.; Li A.; Liu S.; Zhang P.; Zou H.; Hua S.. Clinical Data on Hospital Environmental Hygiene Monitoring and Medical Staff Protection during the Coronavirus Disease 2019 Outbreak. medRxiv, March 2, 2020. 10.1101/2020.02.25.20028043 (accessed 2021-07-27). [DOI] [Google Scholar]
- Lednicky J. A.; Lauzardo M.; Fan Z. H.; Jutla A.; Tilly T. B.; Gangwar M.; Usmani M.; Shankar S. N.; Mohamed K.; Eiguren-Fernandez A.; Stephenson C. J.; Alam M. M.; Elbadry M. A.; Loeb J. C.; Subramaniam K.; Waltzek T. B.; Cherabuddi K.; Morris J. G.; Wu C.-Y. Viable SARS-CoV-2 in the Air of a Hospital Room with COVID-19 Patients. Int. J. Infect. Dis. 2020, 100, 476–482. 10.1016/j.ijid.2020.09.025. [DOI] [PMC free article] [PubMed] [Google Scholar]
- Liu Y.; Ning Z.; Chen Y.; Guo M.; Liu Y.; Gali N. K.; Sun L.; Duan Y.; Cai J.; Westerdahl D.; Liu X.; Xu K.; Ho K.; Kan H.; Fu Q.; Lan K. Aerodynamic Analysis of SARS-CoV-2 in Two Wuhan Hospitals. Nature 2020, 582, 557–560. 10.1038/s41586-020-2271-3. [DOI] [PubMed] [Google Scholar]
- Ong S. W. X.; Tan Y. K.; Chia P. Y.; Lee T. H.; Ng O. T.; Wong M. S. Y.; Marimuthu K. Air, Surface Environmental, and Personal Protective Equipment Contamination by Severe Acute Respiratory Syndrome Coronavirus 2 (SARS-CoV-2) From a Symptomatic Patient. JAMA 2020, 323 (16), 1610. 10.1001/jama.2020.3227. [DOI] [PMC free article] [PubMed] [Google Scholar]
- Santarpia J. L.; Rivera D. N.; Herrera V. L.; Morwitzer M. J.; Creager H. M.; Santarpia G. W.; Crown K. K.; Brett-Major D. M.; Schnaubelt E. R.; Broadhurst M. J.; Lawler J. V.; Reid S. P.; Lowe J. J. Aerosol and Surface Contamination of SARS-CoV-2 Observed in Quarantine and Isolation Care. Sci. Rep. 2020, 10 (1), 1–8. 10.1038/s41598-020-69286-3. [DOI] [PMC free article] [PubMed] [Google Scholar]
- Ma J.; Qi X.; Chen H.; Li X.; Zhang Z.; Wang H.; Sun L.; Zhang L.; Guo J.; Morawska L.; Grinshpun S. A.; Biswas P.; Flagan R. C.; Yao M. COVID-19 Patients in Earlier Stages Exhaled Millions of SARS-CoV-2 per Hour. Clin. Infect. Dis. 2021, 72, e652–e654. 10.1093/cid/ciaa1283. [DOI] [PMC free article] [PubMed] [Google Scholar]
- Sia S. F.; Yan L.-M.; Chin A. W. H.; Fung K.; Choy K.-T.; Wong A. Y. L.; Kaewpreedee P.; Perera R. A. P. M.; Poon L. L. M.; Nicholls J. M.; Peiris M.; Yen H.-L. Pathogenesis and Transmission of SARS-CoV-2 in Golden Hamsters. Nature 2020, 583 (7818), 834–838. 10.1038/s41586-020-2342-5. [DOI] [PMC free article] [PubMed] [Google Scholar]
- Miller S. L.; Nazaroff W. W.; Jimenez J. L.; Boerstra A.; Buonanno G.; Dancer S. J.; Kurnitski J.; Marr L. C.; Morawska L.; Noakes C. 2021. Transmission of SARS-CoV-2 by inhalation of respiratory aerosol in the Skagit Valley Chorale superspreading event. Indoor Air 2021, 31 (2), 314–323. 10.1111/ina.12751. [DOI] [PMC free article] [PubMed] [Google Scholar]
- Gu Y.; Lu J.; Su W.; Liu Y.; Xie C.; Yuan J. Transmission of SARS-CoV-2 in the Karaoke Room: An Outbreak of COVID-19 in Guangzhou, China, 2020. J. Epidemiol. Glob. Health 2021, 11, 6–9. 10.2991/jegh.k.201007.001. [DOI] [PMC free article] [PubMed] [Google Scholar]
- Adam D. C.; Wu P.; Wong J. Y.; Lau E. H. Y.; Tsang T. K.; Cauchemez S.; Leung G. M.; Cowling B. J. Clustering and Superspreading Potential of SARS-CoV-2 Infections in Hong Kong. Nat. Med. 2020, 26, 1714–1719. 10.1038/s41591-020-1092-0. [DOI] [PubMed] [Google Scholar]
- Lai K.-M.; Bottomley C.; McNerney R. Propagation of Respiratory Aerosols by the Vuvuzela. PLoS One 2011, 6 (5), e20086 10.1371/journal.pone.0020086. [DOI] [PMC free article] [PubMed] [Google Scholar]
- Loudon R. G.; Roberts M. R. Singing and the Dissemination of Tuberculosis. Am. Rev. Respir. Dis. 1968, 98, 297–300. [DOI] [PubMed] [Google Scholar]
- Asadi S.; Wexler A. S.; Cappa C. D.; Barreda S.; Bouvier N. M.; Ristenpart W. D. Aerosol Emission and Superemission during Human Speech Increase with Voice Loudness. Sci. Rep. 2019, 9, 2348. 10.1038/s41598-019-38808-z. [DOI] [PMC free article] [PubMed] [Google Scholar]
- Johnson G. R.; Morawska L.; Ristovski Z. D.; Hargreaves M.; Mengersen K.; Chao C. Y. H.; Wan M. P.; Li Y.; Xie X.; Katoshevski D.; Corbett S. Modality of Human Expired Aerosol Size Distributions. J. Aerosol Sci. 2011, 42 (12), 839–851. 10.1016/j.jaerosci.2011.07.009. [DOI] [PMC free article] [PubMed] [Google Scholar]
- Alsved M.; Matamis A.; Bohlin R.; Richter M.; Bengtsson P.-E.; Fraenkel C.-J.; Medstrand P.; Löndahl J. Exhaled Respiratory Particles during Singing and Talking. Aerosol Sci. Technol. 2020, 54 (11), 1245–1248. 10.1080/02786826.2020.1812502. [DOI] [Google Scholar]
- He R.; Gao L.; Trifonov M.; Hong J. Aerosol Generation from Different Wind Instruments. J. Aerosol Sci. 2021, 151, 105669. 10.1016/j.jaerosci.2020.105669. [DOI] [PMC free article] [PubMed] [Google Scholar]
- Patel R.; Connaghan K.; Franco D.; Edsall E.; Forgit D.; Olsen L.; Ramage L.; Tyler E.; Russell S. The Caterpillar”: A Novel Reading Passage for Assessment of Motor Speech Disorders.. Am. J. Speech Lang. Pathol. 2013, 22 (1), 1–9. 10.1044/1058-0360(2012/11-0134). [DOI] [PubMed] [Google Scholar]
- Volckens J.; Peters T. M. Counting and Particle Transmission Efficiency of the Aerodynamic Particle Sizer. J. Aerosol Sci. 2005, 36 (12), 1400–1408. 10.1016/j.jaerosci.2005.03.009. [DOI] [Google Scholar]
- Wells W. F. Airborne Contagion and Air Hygiene: An Ecological Study of Droplet Infections. J. Am. Med. Assoc. 1955, 159, 90. 10.1001/jama.1955.02960180092033. [DOI] [Google Scholar]
- Riley E. C.; Murphy G.; Riley R. L. Airborne Spread of Measles in a suburban Elementary School. Am. J. Epidemiol. 1978, 107 (5), 421–432. 10.1093/Oxfordjournals.Aje.A112560. [DOI] [PubMed] [Google Scholar]
- Zhu S.; Kato S.; Yang J.-H. Study On Transport Characteristics Of Saliva Droplets Produced By Coughing In A Calm Indoor Environment. Build. Environ. 2006, 41 (12), 1691–1702. 10.1016/j.buildenv.2005.06.024. [DOI] [Google Scholar]
- Bouhuys A.; Proctor D. F.; Mead J. Kinetic Aspects of Singing. J. Appl. Physiol. 1966, 21 (2), 483–496. 10.1152/jappl.1966.21.2.483. [DOI] [PubMed] [Google Scholar]
- Blocken B.; Stathopoulos T.; Saathoff P.; Wang X. Numerical Evaluation of Pollutant Dispersion in the Built Environment: Comparisons between Models and Experiments. 4th Int. Symp. Comput. Wind Eng. CWE2006 2008, 96 (10), 1817–1831. 10.1016/j.jweia.2008.02.049. [DOI] [Google Scholar]
- Defraeye T.; Blocken B.; Carmeliet J. CFD Analysis of Convective Heat Transfer at the Surfaces of a Cube Immersed in a Turbulent Boundary Layer. Int. J. Heat Mass Transfer 2010, 53 (1), 297–308. 10.1016/j.ijheatmasstransfer.2009.09.029. [DOI] [Google Scholar]
- Liu J.; Heidarinejad M.; Pitchurov G.; Zhang L.; Srebric J. An Extensive Comparison of Modified Zero-Equation, Standard k-ε, and LES Models in Predicting Urban Airflow. Sustain. Cities Soc. 2018, 40, 28–43. 10.1016/j.scs.2018.03.010. [DOI] [Google Scholar]
- Blocken B.; Defraeye T.; Derome D.; Carmeliet J. High-Resolution CFD Simulations for Forced Convective Heat Transfer Coefficients at the Facade of a Low-Rise Building. Build. Environ. 2009, 44 (12), 2396–2412. 10.1016/j.buildenv.2009.04.004. [DOI] [Google Scholar]
- Yakhot V.; Orszag S. A.; Thangam S.; Gatski T. B.; Speziale C. G. Development of Turbulence Models for Shear Flows by a Double Expansion Technique. Phys. Fluids A 1992, 4 (7), 1510–1520. 10.1063/1.858424. [DOI] [Google Scholar]
- Zhu S.; Dalgo D.; Srebric J.; Kato S. Cooling Efficiency of a Spot-Type Personalized Air-Conditioner. Build. Environ. 2017, 121, 35–48. 10.1016/j.buildenv.2017.05.007. [DOI] [Google Scholar]
- Srebric J.; Vukovic V.; He G.; Yang X. CFD Boundary Conditions for Contaminant Dispersion, Heat Transfer and Airflow Simulations around Human Occupants in Indoor Environments.. Indoor Air 2005 Model. Assess. Control Indoor Air Qual. 2008, 43 (3), 294–303. 10.1016/j.buildenv.2006.03.023. [DOI] [Google Scholar]
- Chen C.; Zhao B. Some Questions on Dispersion of Human Exhaled Droplets in Ventilation Room: Answers from Numerical Investigation. Indoor Air 2010, 20 (2), 95–111. 10.1111/j.1600-0668.2009.00626.x. [DOI] [PubMed] [Google Scholar]
- Dai H.; Zhao B. Association of the Infection Probability of COVID-19 with Ventilation Rates in Confined Spaces. Build. Simul. 2020, 13 (6), 1321–1327. 10.1007/s12273-020-0703-5. [DOI] [PMC free article] [PubMed] [Google Scholar]
- Richter B.; Hipp A.; Schubert B.; Axt M. R.; Stratmann M.; Schmölder C.; Spahn C.. From Classic to Rap: Airborne Transmission of Different Singing Styles, with Respect to Risk Assessment of a SARS-CoV-2 Infection. medRxiv, March 26, 2021. 10.1101/2021.03.25.21253694 (accessed 2021-07-27). [DOI] [Google Scholar]
- Giovanni A.; Radulesco T.; Bouchet G.; Mattei A.; Révis J.; Bogdanski E.; Michel J. Transmission of Droplet-Conveyed Infectious Agents Such as SARS-CoV-2 by Speech and Vocal Exercises during Speech Therapy: Preliminary Experiment Concerning Airflow Velocity. Eur. Arch. Otorhinolaryngol. 2021, 278 (5), 1687–1692. 10.1007/s00405-020-06200-7. [DOI] [PMC free article] [PubMed] [Google Scholar]
- Chao C. Y. H.; Wan M. P.; Morawska L.; Johnson G. R.; Ristovski Z. D.; Hargreaves M.; Mengersen K.; Corbett S.; Li Y.; Xie X.; Katoshevski D. Characterization of Expiration Air Jets and Droplet Size Distributions Immediately at the Mouth Opening. J. Aerosol Sci. 2009, 40 (2), 122–133. 10.1016/j.jaerosci.2008.10.003. [DOI] [PMC free article] [PubMed] [Google Scholar]
- McCarthy L. P.; Orton C. M.; Watson N. A.; Gregson F. K. A.; Haddrell A. E.; Browne W. J.; Calder J. D.; Costello D.; Reid J. P.; Shah P. L.; Bzdek B. R. Aerosol and Droplet Generation from Performing with Woodwind and Brass Instruments. Aerosol Sci. Technol. 2021, 1–11. 10.1080/02786826.2021.1947470.34732970 [DOI] [Google Scholar]
- Rudnick S. N.; Milton D. K. Risk of Indoor Airborne Infection Transmission Estimated from Carbon Dioxide Concentration. Indoor Air 2003, 13 (3), 237–245. 10.1034/j.1600-0668.2003.00189.x. [DOI] [PubMed] [Google Scholar]
- Gregson F.; Watson N.; Orton C.; Haddrell A.; McCarthy L.; Finnie T.; Gent N.; Donaldson G.; Shah P.; Calder J.; Bzdek B.; Costello D.; Reid J. Comparing aerosol concentrations and particle size distributions generated by singing, speaking and breathing. Aerosol Sci. Technol. 2021, 55, 681–691. 10.1080/02786826.2021.1883544. [DOI] [Google Scholar]
- Leung N. H. L.; Chu D. K. W.; Shiu E. Y. C.; Chan K.-H.; McDevitt J. J.; Hau B. J. P.; Yen H.-L.; Li Y.; Ip D. K. M.; Peiris J. S. M.; Seto W.-H.; Leung G. M.; Milton D. K.; Cowling B. J. Respiratory Virus Shedding in Exhaled Breath and Efficacy of Face Masks. Nat. Med. 2020, 26, 676–680. 10.1038/s41591-020-0843-2. [DOI] [PMC free article] [PubMed] [Google Scholar]
- Milton D. K.; Fabian M. P.; Cowling B. J.; Grantham M. L.; McDevitt J. J. Influenza Virus Aerosols in Human Exhaled Breath: Particle Size, Culturability, and Effect of Surgical Masks. PLoS Pathog. 2013, 9 (3), e1003205. 10.1371/journal.ppat.1003205. [DOI] [PMC free article] [PubMed] [Google Scholar]
- Wood M. E.; Stockwell R. E.; Johnson G. R.; Ramsay K. A.; Sherrard L. J.; Jabbour N.; Ballard E.; O’Rourke P.; Kidd T. J.; Wainwright C. E.; Knibbs L. D.; Sly P. D.; Morawska L.; Bell S. C. Face Masks and Cough Etiquette Reduce the Cough Aerosol Concentration of Pseudomonas Aeruginosa in People with Cystic Fibrosis. Am. J. Respir. Crit. Care Med. 2018, 197 (3), 348–355. 10.1164/rccm.201707-1457OC. [DOI] [PubMed] [Google Scholar]
- Xu C.; Wu C.-Y.; Yao M. Fluorescent Bioaerosol Particles Resulting from Human Occupancy with and Without Respirators. Aerosol Air Qual. Res. 2017, 17 (1), 198–208. 10.4209/aaqr.2016.09.0400. [DOI] [Google Scholar]
- Ai Z.; Hashimoto K.; Melikov A. K. Airborne Transmission between Room Occupants during Short-Term Events: Measurement and Evaluation. Indoor Air 2019, 29 (4), 563–576. 10.1111/ina.12557. [DOI] [PubMed] [Google Scholar]
Associated Data
This section collects any data citations, data availability statements, or supplementary materials included in this article.


