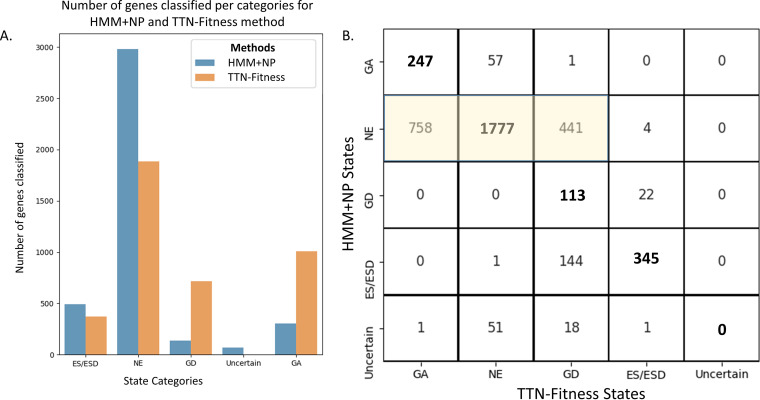
FIG 11.
Distribution of HMM+NP and TTN-Fitness states for genes provided in the M. tuberculosis H37Rv data set. Panel A shows the distribution of classification of genes by the two methods. Panel B shows the confusion matrix of the classification of genes in the two methodologies. Most of the genes are labeled NE in both models. Genes determined to be ‘Uncertain’ in the HMM+NP model are assigned other states in the TTN-Fitness method. A fraction of genes labeled ‘NE’ (Non-Essential) in the HMM+NP model (highlighted matrix components) are reassigned as ‘GA’ (Growth Advantage) or ‘GD’ (Growth Defect) using the TTN-Fitness method, indicating that the TTN-Fitness method is more sensitive in estimating fitness than the HMM+NP model.

