Abstract
Bacteriological characterization of bovine liver abscesses has been accomplished by cultural methods but DNA methods are still needed, as many bacteria are not conducive to laboratory culture. In addition to this gap in research, there have been no studies which identify the bacterial presence within healthy, non-abscessed liver tissue. The objective of this study was to compare the bacteriome of both abscessed and non-abscessed bovine livers in an observational case–control study design. Fifty-six livers, obtained from Holstein steers, were scored according to a modified Elanco liver abscess score description where A− was partitioned into active abscesses or scarred where only scars were present. Parenchyma tissue was collected from non-abscessed livers (n = 22) and scarred livers (n = 7), and purulent material was collected from abscessed livers (n = 24), and DNA was extracted for 16s rRNA gene sequence-based bacterial analysis. Across liver samples, 21 total phyla were identified with a mean of 14. Predominant phyla, accounting for >98% of reads, were Fusobacteria (51.7%), Bacteroidetes (26.9%), Proteobacteria (8.03%), Firmicutes (5.39%), Cyanobacteria (3.85%), and Actinobacteria (2.21%). Proteobacteria, Cyanobacteria, and Firmicutes were greater in non-abscessed and scarred livers, whereas Fusobacteria and Bacteroidetes prevailed in abscessed livers. Non-abscessed livers shared 3,059 operational taxonomic units (OTU) with abscessed livers (total OTU of all livers = 4,167), but non-abscessed livers had greater richness and evenness, whereas abscessed livers had greater dominance (P ≤ 0.0014). Liver score affected the relative abundance of OTU (R = 0.463; P = 0.001) but abscessed livers shared ≥ 40% similarity and were not different from each other (P ≥ 0.370). Of the predominant OTU (top 10 as a % of reads), three OTU (Fusobacteria necrophorum, Bacteroides spp., and Trueperella pyogenes) were shared across both abscessed and non-abscessed livers. Fusobacterium necrophorum was the dominant OTU regardless of liver score, and the single most abundant OTU, even among non-abscessed livers. We describe bacterial DNA detected in non-abscessed bovine liver tissue for the first time, which indicates possible presence of viable bacteria with pathogenic potential in apparently healthy liver tissue.
Keywords: bacteriome, hepatic, Holstein, liver abscess, 16S ribosomal RNA
Introduction
Bovine liver abscesses continue to be a primary concern facing beef production efficiency (Brink et al., 1990; Nagaraja and Chengappa, 1998; Brown and Lawrence, 2010; McKeith et al., 2012). Despite current mitigation strategies, significant variation exists in the rate of liver condemnation, even among cattle from the same feedlot (Amachawadi et al., 2021). Calf-fed Holsteins tend to have a greater rate of condemnation than beef-type, likely due to the length of time cattle are on feed among other pre-dispositions (Reinhardt and Hubbert, 2015; Amachawadi and Nagaraja, 2016). This cattle type offers a unique opportunity for research efforts focused on bovine liver abscess etiology and mitigation.
It is generally assumed that a breach in the rumen wall, or anywhere in the alimentary tract, may allow bacterial entry into portal blood flow which is filtered through the vast network of sinusoids in the liver. There, host immune cells are responsible for phagocytosis and degradation of invading pathogens, and yet, host cell function may become overwhelmed giving rise to infection. Culture methods have indicated Fusobacterium necrophorum as the primary bacterial agent responsible for liver abscesses in cattle and are indeed the bacterial species most commonly isolated (Nagaraja and Chengappa, 1998). Research efforts have been largely focused on eliminating the causative agent of infection or reducing the infective agent’s ability to gain entry to the liver (Fox et al., 2009; Reinhardt and Hubbert, 2015; Huebner et al., 2019). Liver abscesses are, however, a polymicrobial environment as evidenced by both culture and culture-independent methods (Nagaraja and Chengappa, 1998; Weinroth et al., 2017). More recent culture-independent methods have also focused on the effect of current in-feed therapeutics on the effect of liver abscess bacterial community (Amachawadi et al., 2021) and the association of epimural bacterial communities of the rumen wall of cattle with or without liver abscesses (Abbas et al., 2020). Yet, there have been no studies which have characterized the bacterial DNA presence in normal, non-abscessed bovine liver parenchyma, outside of local infection. It is assumed that the innate immunological role of the liver would not allow for the survival of bacteria in the organ, but bacterial evasion of host immune responses is apparent. A major gap in knowledge exists in an area which may be important in determining efficacy of products or strategies aimed at the elimination of pathogenic bacteria or their translocation to the liver. Therefore, the objective of this study was to measure and discuss the differences in the bacterial DNA load of liver samples obtained from both abscessed and non-abscessed livers of Holstein steers.
Materials and Methods
Liver tissue was obtained from animals under a protocol approved by the Texas Tech University Institutional Animal Care and Use Committee (#18080-10; Stotz et al., 2021). Livers were obtained from Holstein steers (n = 56) from a single source and harvested at a USDA inspected commercial processing facility. Briefly, steers were treated 188 d prior to harvest with feed-grade antibiotics or a non-antibiotic feed additive for liver abscess mitigation purposes. To rule out this treatment as a confounding variable, a preliminary analysis determined that there was no effect of ante-mortem treatment on the downstream analyses of microbial community structure in the bovine liver (Bray–Curtis analysis of similarity, R = −0.034; P = 0.61) and therefore is not discussed here. This outcome agrees with other recent research by Amachawadi et al. (2021) who found that antibiotic treatment did not alter liver abscess bacterial community.
Liver evaluation
Livers were pulled from the harvest line and individually separated using large polymer bags. All livers were graded on a modified Elanco scale (Brown et al., 1975; Elanco, Greenfield, IN) by one evaluator blinded from subject identity. Liver scores were based on liver appearance: 0, no abscesses or scars; A−, one or two small abscesses; A, one or two large abscesses or several small abscesses; A+, multiple large abscesses; and A+AD, adhesion. One modification was made to distinguish active versus inactive infections from the traditional Elanco A− description for those livers with scars only and are abbreviated as Sc (one or two scars; inactive infection). Liver score results of the 56 total samples were as follows: 41.1% were scored 0 (n = 23), 12.5% scored Sc (n = 7), 8.9% scored A− (n = 5), 3.6% scored A (n = 2), 10.7% scored A+ (n = 6), and 23.2% scored A+AD (n = 13).
Sample collection
Stainless steel work surface was disinfected with isopropyl alcohol between liver sampling procedures. Purulent material was obtained (~2 mL) from hepatic abscesses with sterile scalpel, tongue depressors, disposable pipettes, and/or forceps from each liver surface apparent abscess and stored in replicate sterile cryogenic vials (Thermo Scientific Nalgene, Rochester, NY). For livers classified as Sc, a cross section of the scar tissue was taken using sterile scalpel and forceps. Four livers which scored A+AD had no evidence of active infection; the same sample collection method was used on these samples as those that scored Sc. Non-abscessed livers were sampled by collecting tissue samples via sterile trocar, inserted at four locations from each lobe, transecting the interior space, and placed into sterile cryogenic vials. All liver samples were snap frozen in liquid nitrogen for 60 s and placed on dry ice for transportation to the lab where they were stored at −80 °C for later bacterial DNA sequencing at a commercial laboratory (Molecular Research LP; MR DNA, Shallowater, TX). During snap-freezing, three samples combusted (one from a liver with scores of 0 and two from livers with scores of A−) leaving n = 53 for analysis.
Bacterial DNA extraction and dataset preparation
Genomic DNA was isolated from tissue samples using the PowerSoil DNA Isolation Kit (Qiagen) following the manufacturer’s instructions. As an alternative to the recommended 250 mg of soil, each sample was placed in a centrifuge and spun down for 10 min at 2500 rpm; 240 mg +/− 5 mg of tissue was added to the PowerBeads tube to undergo cell lysis. The purified DNA was eluted from the spin filter using 100 μL of solution C6 and stored at −20 °C until PCR amplification. Polymerase chain reaction (PCR) primers (341F/785R) for the V3-V4 variable region of the 16S rRNA gene were used in a 30 to 35 cycle PCR (HotStarTaq Plus Master Mix Kit; Qiagen, USA) with settings of 94 °C for 3 min, followed by 30 cycles of 94 °C for 30 s, 53 °C for 40 s, and 72 °C for 1 min, after which a final elongation step at 72 °C for 5 min was performed. Following amplification, PCR products were analyzed for success of amplification and intensity of bands in 2% agarose gel. Then amplicons were pooled together (100 samples) in equal aliquots based on DNA concentrations and molecular weight. Calibrated Ampure XP beads were used to purify pooled amplicon. The pooled and purified PCR product of these processes was then used to prepare the Illumina DNA library.
Sequencing was conducted on an Illumina MiSeq following manufacturer’s guidelines utilizing a proprietary analysis pipeline (MR DNA, Shallowater, TX). Briefly, sequences were joined and then trimmed of barcodes and primers. Sequences consisting of < 150 base pairs and those with ambiguous base calls were removed. Then sequences were denoised, operational taxonomic units (OTU) generated, and chimeras removed. A divergence of 3% (97% similarity) was set for OTU picking. Then OTU were taxonomically classified using BLASTn against a curated database derived from RDPII and NCBI (www.ncbi.nlm.nih.gov, http://rdp.cme.msu.edu).
A total of 1,458,594 raw bacterial reads were detected from 53 liver samples with a mean of 27,520 reads per sample (SD = 4,889 reads), and mean read length of 361 bp (SD = 52 bp). The total number of reads retained in the bacterial DNA analysis was 657,109 with a mean of 12,398 reads per sample (SD = 11,591 reads) with 100% being assigned taxonomy at the genus level. Non-abscessed samples had a mean of 3,020 reads per sample (SD = 2,052), scarred liver samples had a mean of 4,242 reads per sample (SD = 2,458), and abscessed livers had a mean of 23,374 reads per sample (SD = 8,402).
Data summarization and statistical analysis
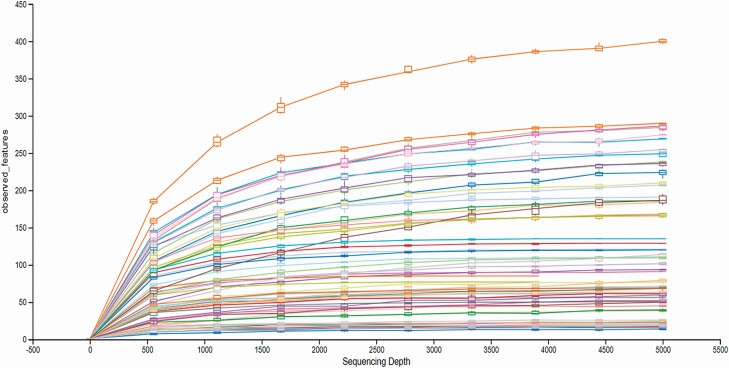
Data were summarized using Primer v7 software (Clarke and Gorley, 2015; www.primer-e.com). A rarefication curve was derived from samples to determine sufficient sequencing depth (Figure 1). The OTU counts were standardized to relative abundance and then square root transformed to achieve a more normal distribution. Alpha metrics (observed OTU, Peilous’ evenness, and Simpson’s dominance) were used to describe bacterial community within each liver score. A Bray–Curtis similarity matrix was constructed to visualize community differences among different liver scores (beta-diversity) and visualized using a non-metric multi-dimensional scaling (nMDS) plot. The nMDS matrix is a robust technique for measuring the relatedness of samples by grouping samples based on percent similarity and can indicate the significance of a factors influence on or correlation with community structure, such as liver score. Bootstrap methods were also utilized in an nMDS matrix plot to more clearly define confidence intervals of expected similarity between samples of a given liver grade. An analysis of similarity (ANOSIM) was performed on the ranked similarity data using and tested against the null hypothesis that the bacterial community of within liver scores was not different.
Figure 1.
Rarefaction curve showing sequencing depth of bacterial community obtained from abscessed and non-abscessed bovine livers (n = 53). The y- axis is the total number of species (unique OTU observed) and the x-axis is the sequencing depth. Colored curves are richness of samples obtained from 53 bovine livers. Overall, the curves illustrate a plateau indicating sufficient sampling depth to describe the community diversity.
Continuous variables were analyzed using the MIXED procedure of SAS (9.4, SAS Institute Inc., Cary, NJ) and the following model:
where Yij represents response variables bacterial relative abundance as well as alpha, μ was the overall mean, abscess liverscorei was the fixed effect (0, Sc, A−, A, A+, or A+AD), samplej was the random effect of the jth liver sample (1, 2, 3, …, 53), and eij represents random error associated with the measurement of the jth sample within the ith liver score. Significance of all tests was established at P < 0.05 and tendencies determined as P ≤ 0.10.
Results
Bacterial DNA across liver scores
The downstream analysis resulted in 4,167 unique OTUs and the rarefaction curve of the observed OTU is shown in Figure 1, indicating ample sequencing depth to describe the bacterial DNA in the liver. Table 1 contains the summary statistics of bacterial DNA organized by Phyla or Genus within and across liver score. The OTU separated into 21 phyla (mean = 14, range = 7 to 19) and 388 genera (mean = 107, range = 25 to 191).
Table 1.
Summary statistics of experimental unit liver scores and reads clustered within bacterial Phylum and Genus
| Experimental units | n | %, total | ||
|---|---|---|---|---|
| Liver abscess score1 | ||||
| 0 | 22 | 41.5 | ||
| Sc | 7 | 13.2 | ||
| A- | 3 | 5.66 | ||
| A | 2 | 3.77 | ||
| A+ | 6 | 11.3 | ||
| A+AD | 13 | 24.5 | ||
| Total | 53 | |||
| Phyla detected, n = 21 | ||||
| Liver abscess score | Mean ± SD | Min | Max | CV,% |
| 0 | 15 ± 2 | 12 | 19 | 13.4 |
| Sc | 15 ± 2 | 12 | 17 | 11.1 |
| A− | 13 ± 5 | 8 | 17 | 35.6 |
| A | 11 ± 2 | 9 | 12 | 20.2 |
| A+ | 10 ± 3 | 7 | 14 | 29.7 |
| A+AD | 13 ± 4 | 7 | 19 | 26.6 |
| Mean2 | 14 | 7 | 19 | |
| Genera detected, n = 388 | ||||
| Liver abscess score | Mean ± SD | Min | Max | CV,% |
| 0 | 127 ± 35 | 71 | 191 | 27.9 |
| Sc | 132 ± 30 | 102 | 167 | 22.6 |
| A− | 112 ± 76 | 36 | 187 | 67.4 |
| A | 52 ± 3 | 50 | 54 | 5.40 |
| A+ | 43 ± 22 | 26 | 83 | 51.1 |
| A+AD | 94 ± 54 | 25 | 175 | 57.3 |
| Mean2 | 107 | 25 | 191 |
1Liver Score: 0, no abscesses or scars; Sc, inactive scar; A−, one to two small abscesses; A, one or two large abscesses or several small abscesses; A+, multiple large abscesses; A+AD, adhesion.
2Collective mean for all sampled livers.
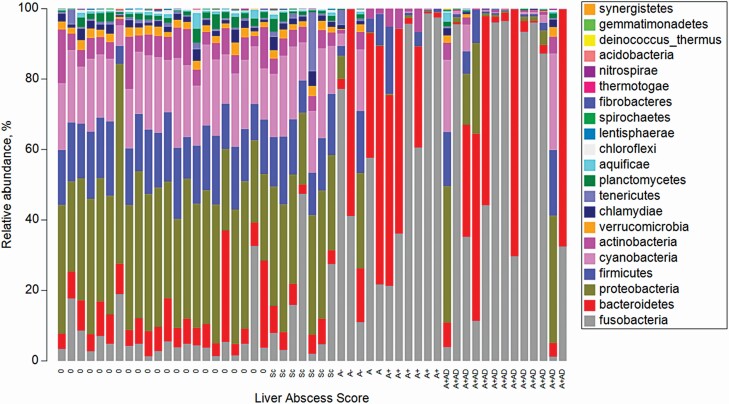
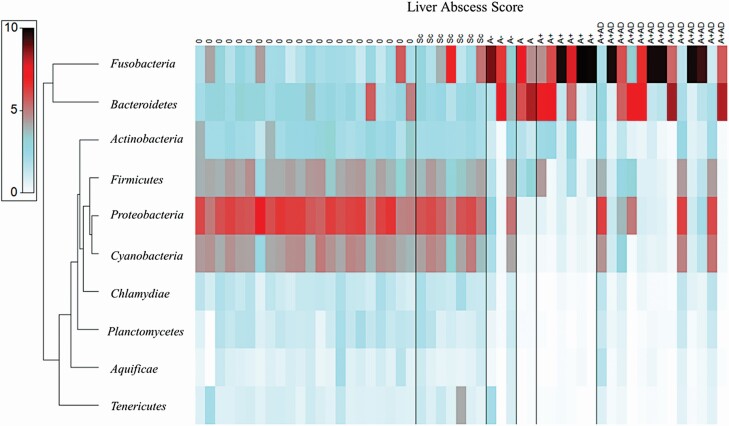
Samples were standardized to each individual samples’ respective total and a stacked bar chart of the relative abundance of phyla within each sample is organized by liver score in Figure 2. Predominant phyla, accounting for more than 98% of reads, were Fusobacteria (51.7%), Bacteroidetes (26.9%), Proteobacteria (8.03%), Firmicutes (5.39%), Cyanobacteria (3.85 %), and Actinobacteria (2.21%). After standardization, a square root transformation was performed to achieve a normal distribution and a resemblance matrix (Bray–Curtis Similarity index) was created. A dendrogram of the 10 most predominant phyla was assembled in ordinance with the similarity index values into a shade plot (Figure 3). The shade plot indicated a dominance of Proteobacteria, Cyanobacteria, and Firmicutes in 0 and Sc livers, whereas Fusobacteria and Bacteroidetes dominated the more severely abscessed liver samples. Remaining five predominant Phyla were Actinobacteria, Chlamydiae, Plantomycetes, Aquificae, and Tenericutes.
Figure 2.
Relative abundance of phyla within samples arranged by liver severity score. Relative abundance (standardized to the total) of phyla organized by liver severity score from left to right (normal to abscessed). Liver abscess score are 0, no abscesses or scars; Sc, inactive scar; A−, one to two small abscesses; A, one or two large abscesses or several small abscesses; A+, multiple large abscesses; and A+AD, adhesion. The key is color coded to the respective phyla in order to provide a comprehensive view of each sample.
Figure 3.
Shade plot of 10 most abundant phyla. The x-axis is liver abscess score where 0, no abscesses or scars; Sc, inactive scar; A−, one to two small abscesses; A, one or two large abscesses or several small abscesses; A+, multiple large abscesses; and A+AD, adhesion. The y-axis is phyla oriented in ordinance with the similarity index values. Shading intensity is the square root transformed relative abundance (%) of each OTU within the sample.
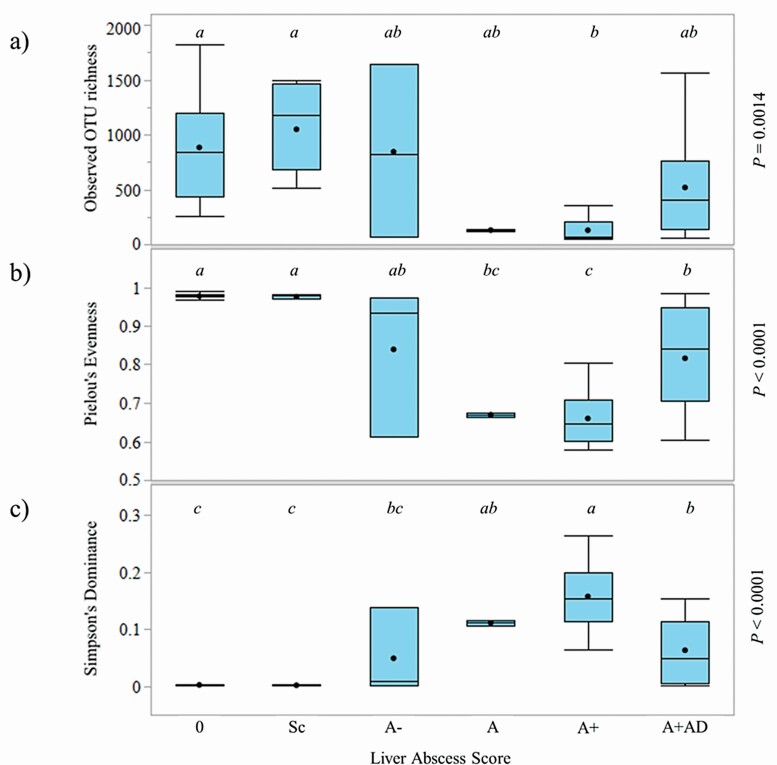
Of the 4,167 observed OTU, 3,059 OTU were shared across non-abscessed and abscessed livers (0 vs. A−, A, A+, and A+AD). There were 817 OTU which were unique to non-abscessed livers and 208 OTU which were unique to abscessed livers. Alpha diversity measures (richness, evenness, and dominance) are presented in Figure 4a–c. Livers with scores of 0 and Sc had greater richness than A+ (P = 0.0014) but A−, A, and A+AD were intermediate and not different. Livers with scores of 0 and Sc also had greater evenness than livers with scores of A, A+, and A+AD (P < 0.0001) but A− was intermediate and not different. Livers with scores of A+ had greater dominance than livers with scores of 0 and Sc (P < 0.0001), whereas livers with scores of A−, A, and A+AD were intermediate.
Figure 4.
Box and Whisker plots of alpha diversity metrics of bacterial DNA across liver abscess scores. Observed OTU richness (a), Pielou’s Evenness Index (b), and Simpson’s Dominance Index (c). Liver abscess score are 0, no abscesses or scars (n = 22); Sc, inactive scar (n = 7); A−, one to two small abscesses (n = 3); A, one or two large abscesses or several small abscesses (n = 2); A+, multiple large abscesses (n = 6); and A+AD, adhesion (n = 13).
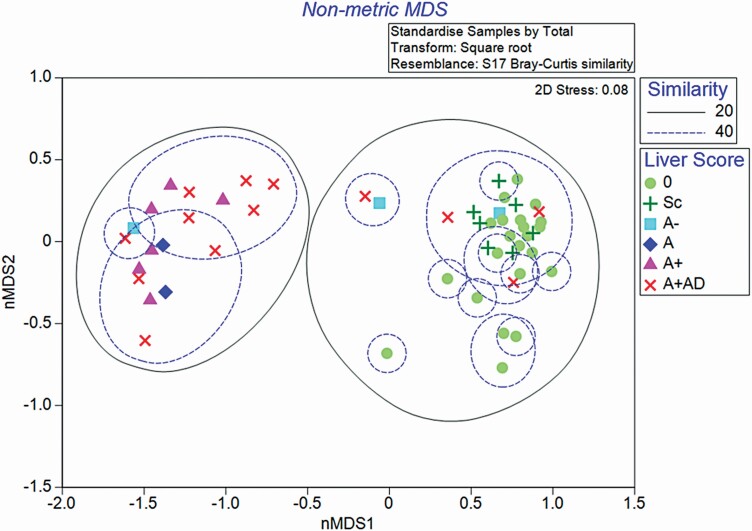
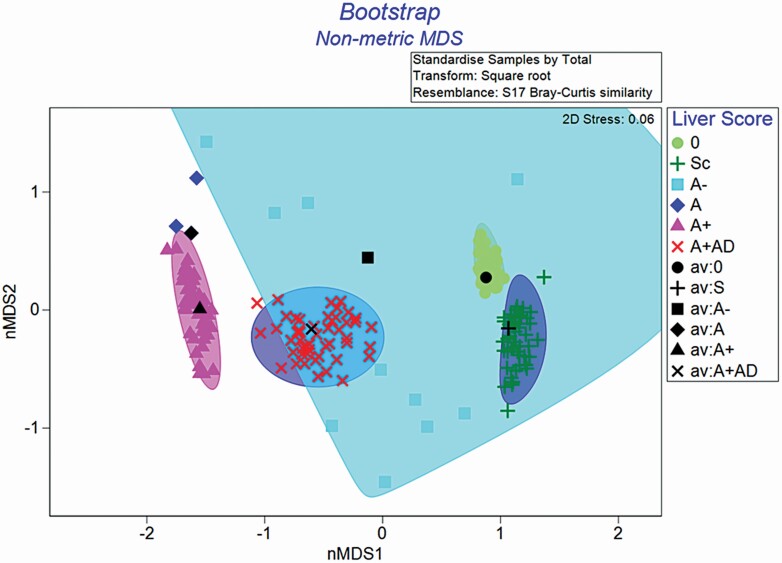
Liver abscess score was a significant factor affecting bacterial community composition (R = 0.463, P = 0.001; Figure 5). Pairwise comparisons revealed that bacterial DNA from livers scores 0 and Sc was not different from each other (P = 0.956) and shared >40% of OTU reads. Livers with a score of A− were different from 0 (P = 0.042), but were only tending to be different from scarred livers (P = 0.092). There were, however, only three A− livers and these results should be interpreted with caution. Bacterial DNA of livers with scores of A−, A, A+, and A+AD was not different from each other at a greater ≥40% similarity (P ≥ 0.370). Four livers with scores of A+AD were more similar to the cluster of 0 and Sc samples. Bootstrapping the dataset, resampling each liver score group 50 times did not replicate this clustering, indicating that these four particular samples of A+AD livers may not be fully representative of the A+AD population (Figure 6). Indeed, these four livers were in the more advanced stage of abscess resolution displaying firm abscess tissue or scarring at the adhesion site.
Figure 5.
Non-metric multi-dimensional scaling (nMDS) plot of bacterial community within different liver scores. The matrix was constructed using the Bray–Curtis similarity index (beta-diversity) liver samples by liver abscess score. Liver severity scores are 0, no abscesses or scars (n = 22); Sc, inactive scar (n = 7); A−, one to two small abscesses (n = 3); A, one or two large abscesses or several small abscesses (n = 2); A+, multiple large abscesses (n = 6); and A+AD, adhesion (n = 13). Observations encircled by a green dotted line indicate 20% shared OTU similarity. Observations encircled by a blue dotted line indicate at least 40% shared OTU similarity. Liver severity is a significant factor in bacterial community diversity (R = 0.463; P = 0.001).
Figure 6.
Bootstrapped non-metric multi-dimensional scaling (nMDS) plot of bacterial community of tissue from different liver scores. The matrix was constructed using the Bray–Curtis similarity index (beta-diversity) by liver grades and randomly resampled a minimum of 50 times. Liver abscess score are 0, no abscesses or scars (n = 22); Sc, inactive scar (n = 7); A−, one to two small abscesses (n = 3); A, one or two large abscesses or several small abscesses (n = 2); A+, multiple large abscesses (n = 6); A+AD, adhesion (n = 13). The 2-dimension stress = 0.06, indicating how well the ordination summarizes the observed Glow outside of observations indicate the 95% confidence interval.
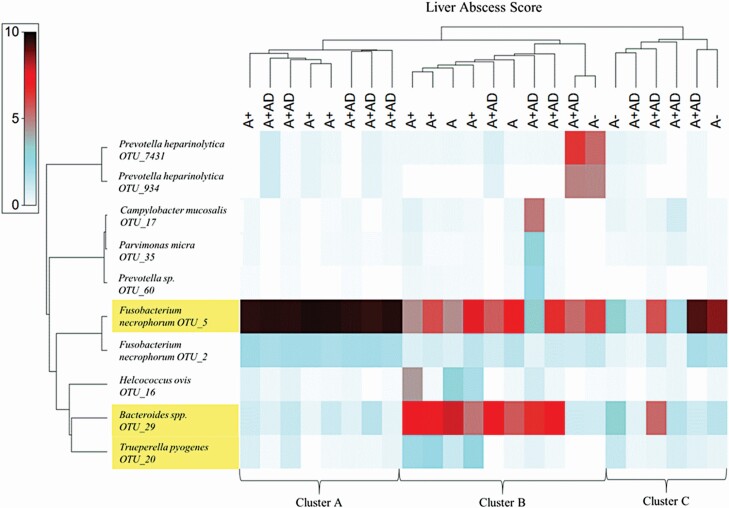
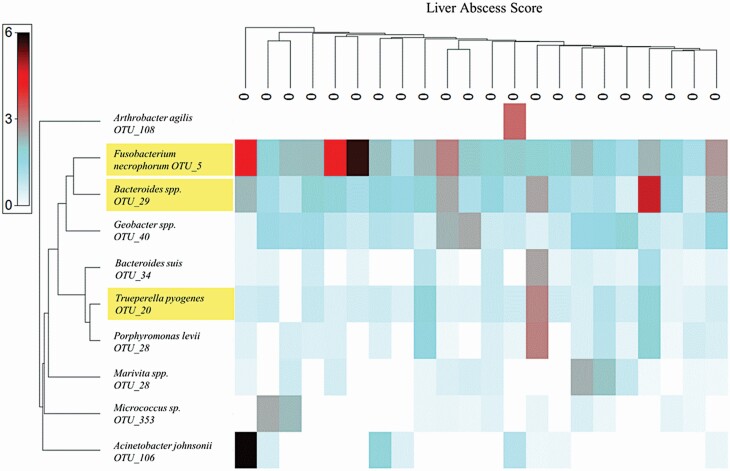
Summary statistics (Table 2) and shade plots of the 10 most abundant OTU within either abscessed (Figure 7) or non-abscessed livers (Figure 8) were assembled from the transformed data and Bray–Curtis similarity indices. Three OTU were common across abscessed and non-abscessed livers: F. necrophorum (OTU_5), Bacteroides spp. (OTU_29), and Trueperella pyogenes (OTU_20).
Table 2.
Ten most abundant OTU1 obtained from abscessed or non-abscessed bovine liver samples
| Predominant OTU1, % relative abundance | Liver sample clusters2 | |||||||
|---|---|---|---|---|---|---|---|---|
| Abscessed livers, n = 24 | Mean | SD | Min | Max | Sum | A | B | C |
| Fusobacterium necrophorum (OTU_5) | 6.83 | 2.7 | 1.07 | 9.71 | 164 | 9.59 | 5.74 | 4.98 |
| Bacteroides spp. (OTU_29) | 3.18 | 2.8 | 0.34 | 7.89 | 76.3 | 0.856 | 5.63 | 2.19 |
| Fusobacterium necrophorum (OTU_2) | 1.32 | 0.64 | 0.28 | 2.20 | 31.6 | 2.01 | 0.986 | 0.934 |
| Prevotella heparinolytica (OTU_7431) | 0.737 | 1.6 | 0 | 6.42 | 17.7 | 0.304 | 1.41 | 0.192 |
| Trueperella pyogenes (OTU_20) | 0.643 | 0.75 | 0 | 2.55 | 15.4 | 0.337 | 0.919 | 0.591 |
| Helcococcus ovis (OTU_16) | 0.562 | 1.1 | 0 | 4.34 | 13.5 | 0.235 | 1.08 | 0.144 |
| Prevotella heparinolytica (OTU_934) | 0.546 | 1.3 | 0 | 4.85 | 13.1 | 0.292 | 1.02 | 0.101 |
| Campylobacter mucosalis (OTU_17) | 0.407 | 1.0 | 0 | 5.08 | 9.76 | 0.107 | 0.672 | 0.363 |
| Parvimonas micra (OTU_35) | 0.247 | 0.57 | 0 | 2.89 | 5.94 | 0.099 | 0.384 | 0.217 |
| Prevotella sp. (OTU_60) | 0.160 | 0.48 | 0 | 2.38 | 3.85 | 0.032 | 0.331 | 0.047 |
| Non-abscessed livers, n = 22 | ||||||||
| Fusobacterium necrophorum (OTU_5) | 2.33 | 1.1 | 1.13 | 5.68 | 51.4 | – | – | – |
| Bacteroides spp. (OTU_29) | 1.63 | 0.92 | 0.478 | 4.79 | 35.8 | – | – | – |
| Geobacter spp. (OTU_40) | 1.07 | 0.60 | 0.257 | 2.44 | 23.5 | – | – | – |
| Trueperella pyogenes (OTU_20) | 0.745 | 0.63 | 0 | 2.86 | 16.4 | – | – | – |
| Porphyromonas levii (OTU_28) | 0.551 | 0.72 | 0 | 2.93 | 12.1 | – | – | – |
| Acinetobacter johnsonii (OTU_106) | 0.462 | 1.3 | 0 | 5.94 | 10.2 | – | – | – |
| Bacteroides suis (OTU_34) | 0.408 | 0.56 | 0 | 2.51 | 8.97 | – | – | – |
| Marivita spp. (OTU_163) | 0.394 | 0.64 | 0 | 2.37 | 8.66 | – | – | – |
| Micrococcus sp. (OTU_353) | 0.316 | 0.67 | 0 | 2.42 | 6.95 | – | – | – |
| Arthrobacter agilis (OTU_108) | 0.147 | 0.69 | 0 | 3.23 | 3.23 | – | – | – |
1OTU, Operational taxonomic unit; predominant in either abscessed or non-abscessed livers; scarred livers not included here.
2Clusters A, B, and C designate liver samples which clustered together at 89%, 58%, and 40% OTU similarity, respectively.
Figure 7.
Shade plot of 10 most abundant OTU identified from abscessed livers. The x-axis across the top is abscessed livers organized by most interrelated samples according to the 10 most abundant OTU, where A− = one or two small abscess; A = one or two large abscesses or several small abscesses; A+ = multiple large abscesses; and A+AD = abscessed with adhesion of surrounding tissue. Clusters A, B, and C were 89%, 58%, and 40% similar, respectively. The y-axis denotes the top 10 most abundant OTU reads across all samples organized by the dendrogram of most interrelated OTU occurrences. Shading intensity is the square-root transformed relative abundance (%) of each OTU within the sample. Yellow-highlighted text indicates that OTU were common across non-abscessed and abscessed livers (see Figure 8).
Figure 8.
Shade plot of 10 most abundant OTU identified from non-abscessed livers. The x-axis is non-abscessed livers with scores of “0” organized by most interrelated samples according to the 10 most abundant OTU. The y-axis denotes the top 10 most abundant OTU reads across all samples organized by the dendrogram of the most interrelated OTU occurrences. Shading intensity is the square-root transformed relative abundance (%) of each OTU within the sample. Yellow-highlighted text indicates that OTU were common across non-abscessed and abscessed livers (see Figure 7).
In abscessed livers (Table 2; Figure 7) the 10 most abundant OTU, in order of most to least abundant, were F. necrophorum (OTU_5), Bacteroides spp. (OTU_29), F. necrophorum (OTU_2), Prevotella heparinolytica (OTU_7431), Trueperella pyogenes (OTU_20), Helcococcus ovis (OTU_16), Prevotella heparinolytica (OTU_934), Campylobacter mucosalis (OTU_17), Parvimonas micra (OTU_35), Prevotella sp. (OTU_60). F. necrophorum (OTU_5), Bacteroides spp. (OTU_29), and F. necrophorum (OTU_2) were present in all abscessed livers, whereas remaining OTU were sample dependent. Although abscessed livers clustered together at ≥40% similarity plot, liver samples did not necessarily cluster together by assigned liver scores, rather three main clusters emerged according to OTU abundance. Cluster A consisted of livers with scores of A+ and A+AD where F. necrophorum (OTU_5) and F. necrophorum (OTU_2) were predominant, respectively, at 9.59% and 2.01% relative abundance. Cluster B consisted of livers with scores of A, A+, and A+AD where F. necrophorum (OTU_5) and Bacteroides spp. (OTU_29) were codominant at 5.74% and 5.63% relative abundance, respectively, followed by Prevotella heparinolytica (OTU_7431; 1.41%), Helcococcus ovis (OTU_16; 1.08%), and Prevotella heparinolytica (OTU_934; 1.02%). Cluster C contained livers with scores of A− and A+AD, and contained those liver samples in the late stage of infection (the outliers on the nMDS plot), where predominant OTU were F. necrophorum (OTU_5) and Bacteroides spp. (OTU_29) at 4.98% and 2.19% relative abundance, respectively.
In non-abscessed livers (Table 2; Figure 8), the 10 most abundant OTU were F. necrophorum (OTU_5), Bacteroides spp. (OTU_29), Geobacter spp. (OTU_40), Trueperella pyogenes (OTU_20), Porphyromonas levii (OTU_28), Acinetobacter johnsonii (OTU_106), Bacteroides suis (OTU_34), Marivita spp. (OTU_163), Micrococcus sp. (OTU_353), and Arthrobacter agilis (OTU_108). Overall, the relative abundance of reads aligning with the predominant bacterial OTU in non-abscessed liver samples was lesser than that of abscessed livers and consistent with the alpha diversity metrics at the Phyla level in equitability across predominant OTU. Fusobacterium necrophorum (OTU_5), Bacteroides spp. (OTU_29), and Geobacter spp. (OTU_40) were identified in all non-abscessed liver samples, whereas the remaining predominant OTU were sample dependent.
Discussion
There has been much research investigating the etiological agents responsible for liver abscesses in cattle, but there has been no research which describes the presence of bacterial DNA in the liver of cattle in apparently healthy liver tissue. This information may be crucial to understanding the pathogenesis of liver abscesses and the development of future mitigation strategies.
Generally, the liver is an important defense organ against bacterial translocation from the gut and systemic infection with substantial innate immune function (Racanelli and Rehermann, 2006; Gao et al., 2008). Evidence in mice has shown that phagocytic cells in the liver play a crucial role in both the innate response of bacterial clearance from the blood but also in the induction of adaptive antibacterial immunity (Broadley et al., 2016; Llorente and Schnabl, 2016). Therefore, assuming bacterial particles would be rapidly phagocytized and degraded within the resident liver immune cells, it was expected that the relative abundance of bacterial DNA in non-abscessed livers would be near 0%, because degraded DNA may not be well detected by sequencing methods. Likely, the bacterial DNA detected in the non-abscessed liver tissue was a collection of the bound or sequestrated bacteria inside non-parenchymal phagocytic cells or the sinusoids in the process of degradation or preserved for antigen presentation to T-cells. Yet, there is also evidence that some pathogenic bacteria, such as Mycobacterium tuberculosis, Salmonella typhimurium, and Staphylococcus aureus, among others, have evolved mechanisms to evade host defenses in the liver, survive in cells, cause infection and tissue damage, and even death (Engele et al., 2002; Flannagan et al., 2015; Leseigneur et al., 2020). The bacterium F. necrophorum also incorporates similar virulence mechanisms, like leukotoxin (Nagaraja et al, 2005), but there is no literature which suggests that F. necrophorum can survive inside phagocytic cells without being degraded.
Abscessed livers
Within abscessed livers, the predominant phyla were somewhat dissimilar in their proportions to that observed in other recent research. Weinroth et al. (2017) sampled abscessed livers of both beef and dairy type cattle and found that Bacteroidetes and Proteobacteria were the dominate phyla followed by Fusobacteria, Firmicutes, and Actinobacteria. More recently, Amachawadi et al. (2021) showed that Fusobacteria was the dominant phylum obtained from purulent liver abscess material followed by Proteobacteria. In the current study, although the same five phyla accounted for the largest share of reads, Fusobacteria was the prevailing phylum (51% of reads), followed by Bacteroidetes (11% of reads), and then distantly by Firmicutes, Actinobacteria, and Proteobacteria (< 3% of reads, collectively). Potentially, this difference in rank order of the dominant phyla is associated with the decision to analyze by liver abscess score in the current study (Figure 2), rather than the pooled analysis of purulent tissue and abscess wall material from various abscess scores discussed by Weinroth et al., (2017) and Amachawadi et al., (2021). In the current study, scarred and non-abscessed livers exhibited greater Proteobacteria (31.2% of reads) than the abscessed liver scores which is numerically similar to the proportion observed by Weinroth et al., (2017). Furthermore, the alpha diversity (Figure 4a–c) and nMDS plots (Figure 5) indicate no difference in the means of observed OTU between the livers with scores of Sc and A−. Likely, the age and infection status of a liver abscess will affect the outcome of bacterial DNA present, and considerations should be made in future studies for not only the liver abscess score but contamination of normal tissue with purulent tissue at collection.
The presence of F. necrophorum (OTU_5 and OTU_2) in all abscessed samples (Figure 7) was expected, as were the other eight predominant OTU, based on the previous work by many (Scanlan and Hathock, 1983; Nagaraja and Chengappa, 1998; Nagaraja and Lechtenberg, 2007; Amachawadi and Nagaraja, 2016). Fusobacterium necrophorum has been the focus of most liver abscess literature as the primary infective agent but clearly there are many bacteria which may play a crucial synergistic or antagonistic role in setting the stage for infection. The clusters that formed across liver abscess scores potentially indicate different stages of infection where cluster A was obtained from samples with active infection and cluster C are the liver samples from latent stages of infection (based on pictures and abscess description at liver sample collection). Samples in cluster B, however, were not visually different from cluster A at the time of collection, but clearly the OTU breakout indicates a different bacterial environment. Either these samples were taken after the height of infection giving rise to other opportunists or these were truly polymicrobial infections. Further discussion would only be conjecture without more evidence.
The OTU_29 aligning with Bacteroides spp. was present in all liver samples but were most prevalent in cluster B. A search of the nucleotide sequences through the NCBI database returned 99.55% homology with sequences from uncultured Bacteroides spp., and Prevotella sp., and 98.42% homology with partial sequences from Bacteroides (Prevotella) heparinolyticus. OTU_29, therefore, likely has significant genetic overlap with the Prevotella heparinolytica OTU_7431 and OTU_934 that were also implicated in the top 10 OTU list. Prevotella heparinolytica is also a member of the phylum Bacteroidetes and is commonly found in wounds or oral infections in animals (Alexander et al., 1973). Bacteroides spp. have been implicated in other polymicrobial diseases such as irritable bowl, ulcerative colitis, and oral infections like periapical abscesses (Lucke et al., 2006) as well as liver abscesses in cattle (Amachawadi and Nagaraja, 2016; Nagaraja and Lechtenberg, 2007; Nagaraja and Chengappa, 1998). Its role in bovine liver abscess infection, however, is unknown and usually not investigated.
OTU which were not present in all samples but quantitatively important for the discussion of polymicrobial infection were Prevotella heparinolytica (OTU_7431 and OTU_934), Campylobacter mucosalis (OTU_17), Parvimonas micra (OTU_35), Helcococcus ovis (OTU_16), and Trueperella pyogenes (OTU_20). As mentioned previously, Prevotella heparinolytica (previously Bacteroides heparinolytica) is implicated in human oral infections, stains Gram-negative but exhibits an outer capsular layer beyond the outer membrane and is named for its ability to hydrolyze heparin (Okuda et al., 1985). This likely conveys a competitive advantage in the evasion of host immune responses and its pathogenic potential in the liver and other tissues. In swine, Campylobacter mucosalis can be isolated from the oral cavity, has been implicated in hepatic tumors, necrotic gastroenteritis, hemorrhagic enteropathy, and ileitis but is not isolated from the mucosa of healthy swine (Lawson and Rowland 1974; Roop et al., 1985). Like many pathogenic proteobacteria, genome annotations of C. mucosalis (NCBI TXID 202) indicate that it harbors a type-2 secretion system, toxin/antitoxin proteins, and other pathogenic mechanisms for persistent infection. The three Gram-positive bacteria, Parvimonas micra (previously Micromonas micros), Helcococcus ovis, and Trueperella pyogenes, have all been implicated in various infections as opportunistic pathogens carrying cytolysin and mucosal adherence genes necessary for persistence (Kutzer et al., 2008; Lafaurie et al., 2007; Ribeiro et al., 2015). As suggested by Amachawadi et al., (2021), liver abscesses may occur as polymicrobial infections and are predominantly Gram-negative bacteria.
Non-abscessed livers
There have been no investigations into the bacterial DNA load of presumably healthy, non-abscessed bovine livers and thus nothing in which to compare these results. The main observation made here was that despite greater equitability of phyla across the non-abscessed liver samples, there was a remarkably consistent predominance of the phyla Proteobacteria, Cyanobacteria, and Firmicutes across the non-abscessed and scarred liver samples (Figure 3). The relative abundance of Proteobacteria and Firmicutes seemed sensible based on their predominance in the rumen (Mann et al., 2018) but the abundance of Cyanobacteria is unclear. Although a greater proportion of OTU in the non-abscessed livers belonged to the phylum Proteobacteria, only 3 of the 10 most abundant OTU belonged to this phylum. This outcome may be due to greater equitability of the OTU belonging to this phylum vs. other phyla. Interestingly, F. necrophorum (OTU_5) had the single greatest share of reads across non-abscessed samples (Figure 8). Despite having healthy appearing liver tissue, every non-abscessed liver sample contained DNA of the primary etiological agent cultivated from liver abscesses and at a high proportion relative to the other predominant OTU. In fact, there were three OTU that were shared across abscessed and non-abscessed livers: F. necrophorum (OTU_5), Bacteroides spp. (OTU_29), and Trueperella pyogenes (OTU_20). There were no environmental control samples taken during this study, so environmental surface contamination of the liver could be a consideration for this result, even with work surface disinfecting between sampling. There may also be an ongoing immunological defense against the bacterium that invade and cause damage to the bovine liver. As suggested earlier, it may be that the DNA detected from the normal liver parenchyma is being sequestered by immune cells for antigen presentation to T-cells for adaptive immune cell development. At this time, however, it is simply unknown what conditions must be met for infection to overwhelm host immune cells. It has been established that ruminal acidosis is correlated with the incidence of liver abscesses in concentrate-fed cattle (Nagaraja et al., 2007) and evidence indicates that metabolic acidosis also intensifies host inflammatory responses (Kellum et al., 2004). In amebic liver abscesses, evidence suggests that an intensified inflammatory response likely contributes to host cell damage and the persistence of amebic infection (Pacheco‐Yépez et al., 2011). Unfortunately, neither ruminal pH nor inflammatory cytokines were measured in the live experiment to confer with this evidence.
Conclusion
Culture-dependent research has indicated the primary etiological agent isolated from liver abscesses is F. necrophorum, and evidence presented here further adds to the culture-independent evidence that infections may also be polymicrobial. Additionally, evidence is provided that bacterial community may not necessarily cluster together according to the liver score designation. Most importantly, and for the first time, it is described herein the non-abscessed liver microbial community and evidence that nucleic acids belonging to F. necrophorum may be present in the liver, regardless of the presence of an abscess or active infection. Culture-dependent methods are needed to confirm the viability of this bacterium obtained from non-abscessed livers.
Acknowledgments
We would like to thank the Texas Cattle Feeders Association for their funding contribution of this research.
Glossary
Abbreviations
- ANOSIM
analysis of similarity
- nMDS
non-metric multi-dimensional scaling
- OTU
operational taxonomic unit
- PCR
polymerase chain reaction
Conflict of interest statement
The authors declare no real or perceived conflicts of interest.
Literature Cited
- Abbas, W., Keel B. N., Kachman S. D., Fernando S. C., Wells J. E., Hales K. E., and Lindholm-Perry A. K.. . 2020. Rumen epithelial transcriptome and microbiome profiles of rumen epithelium and contents of beef cattle with and without liver abscesses. J. Anim. Sci. 98:skaa359. doi: 10.1093/jas/skaa359 [DOI] [PMC free article] [PubMed] [Google Scholar]
- Alexander, D. C., Garcia M. M., and McKay K. A.. . 1973. Assessment of various adjuvants in sphaerophorus necrophorus toxoids. Can. Vet. J. 14:247–251. PMID: 4756812. [PMC free article] [PubMed] [Google Scholar]
- Amachawadi, R. G., and Nagaraja T. G.. . 2016. Liver abscesses in cattle: a review of incidence in Holsteins and of bacteriology and vaccine approaches to control in feedlot cattle. J. Anim. Sci. 94:1620–1632. doi: 10.2527/jas.2015-0261 [DOI] [PubMed] [Google Scholar]
- Amachawadi, R. G., Tom W. A., Hays M. P., Fernando S. C., Hardwidge P. R., Nagaraja T. G.. . 2021. Bacterial community analysis of purulent material from liver abscesses of crossbred cattle and Holstein steers fed finishing diets with or without tylosin. J. Anim. Sci. 99(4):1–10. doi: 10.1093/jas/skab076 [DOI] [PMC free article] [PubMed] [Google Scholar]
- Brink, D. R., Lowry S. R., Stock R. A., and Parrott J. C.. . 1990. Severity of liver abscesses and efficiency of feed utilization of feedlot cattle. J. Anim. Sci. 68:1201–1207. doi: 10.2527/1990.6851201x [DOI] [PubMed] [Google Scholar]
- Broadley, S. P., Plaumann A., Coletti R., Lehmann C., Wanisch A., Seidlmeier A., Esser K., Luo S., Rämer P. C., Massberg S., . et al. 2016. Dual-track clearance of circulating bacteria balances rapid restoration of blood sterility with induction of adaptive immunity. Cell Host Microbe 20:36–48. doi: 10.1016/j.chom.2016.05.023 [DOI] [PubMed] [Google Scholar]
- Brown, H., Bing R. F., Grueter H. P., McAskill J. W., Cooley C. O., and Rathmacher R. P.. . 1975. Tylosin and Chlortetracycline for the prevention of liver abscesses, improved weight gains, and feed efficiency in feedlot cattle. J. Anim. Sci. 40:207–213. doi: 10.2527/jas1975.402207x [DOI] [PubMed] [Google Scholar]
- Brown, T. R., and Lawrence T. E.. . 2010. Association of liver abnormalities with carcass grading performance and value. J. Anim. Sci. 88:4037–4043. doi: 10.2527/jas.2010-3219 [DOI] [PubMed] [Google Scholar]
- Clarke, K. R., and Gorley R. N.. . 2015. Getting started with PRIMER v7. PRIMER-E: Plymouth, Plymouth Marine Laboratory, 20, Auckland, New Zealand. www.primer-e.com. [Google Scholar]
- Engele, M., Stössel E., Castiglione K., Schwerdtner N., Wagner M., Bölcskei P., Röllinghoff M., and Stenger S.. . 2002. Induction of TNF in human alveolar macrophages as a potential evasion mechanism of virulent Mycobacterium tuberculosis. J. Immunol. 168:1328–1337. doi: 10.4049/jimmunol.168.3.1328 [DOI] [PubMed] [Google Scholar]
- Fox, J. T., Thomson D. U., Lindberg N. N., and Barling K.. . 2009. A comparison of two vaccines to reduce liver abscesses in natural-fed beef cattle. Bov. Pract. 43:168–174. doi: 10.21423/bovine-vol43no2p168-174 [DOI] [Google Scholar]
- Flannagan, R. S., Heit B., and Heinrichs D. E.. . 2015. Antimicrobial mechanisms of macrophages and the immune evasion strategies of Staphylococcus aureus. Pathogens 4(4):826–868. doi: 10.3390/pathogens4040826 [DOI] [PMC free article] [PubMed] [Google Scholar]
- Gao, B., Jeong W. I., and Tian Z.. . 2008. Liver: an organ with predominant innate immunity. Hepatology 47:729–736. doi: 10.1002/hep.22034 [DOI] [PubMed] [Google Scholar]
- Huebner, K. L., Martin J. N., Weissend C. J., Holzer K. L., Parker J. K., Lakin S. M., Doster E., Weinroth M. D., Abdo Z., Woerner D. R., . et al. 2019. Effects of a Saccharomyces cerevisiae fermentation product on liver abscesses, fecal microbiome, and resistome in feedlot cattle raised without antibiotics. Sci. Rep. 9:1–11. doi: 10.1038/s41598-019-39181-7 [DOI] [PMC free article] [PubMed] [Google Scholar]
- Kellum, J. A., Song M., and Li J.. . 2004. Science review: extracellular acidosis and the immune response: clinical and physiologic implications. Crit. Care 8:1–6. doi: 10.1186/cc2900 [DOI] [PMC free article] [PubMed] [Google Scholar]
- Kutzer, P., Schulze C., Engelhardt A., Wieler L. H., and Nordhoff M.. . 2008. Helcococcus ovis, an emerging pathogen in bovine valvular endocarditis. J. Clin. Microbiol. 46:3291–3295. doi: 10.1128/JCM.00867-08 [DOI] [PMC free article] [PubMed] [Google Scholar]
- Lafaurie, G. I., Mayorga-Fayad I., Torres M. F., Castillo D. M., Aya M. R., Barón A., and Hurtado P. A.. . 2007. Periodontopathic microorganisms in peripheric blood after scaling and root planing. J. Clin. Periodontol. 34:873–879. doi: 10.1111/j.1600-051X.2007.01125.x [DOI] [PubMed] [Google Scholar]
- Lawson, G. H., and Rowland A. C.. . 1974. Intestinal adenomatosis in the pig: a bacteriological study. Res. Vet. Sci. 17:331–336. doi: 10.1016/S0034-5288(18)33652-X [DOI] [PubMed] [Google Scholar]
- Lechtenberg, K. F., and Nagaraja T. G.. . 1991. Hepatic ultrasonography and blood changes in steers with experimentally induced liver abscesses. Am. J. Vet. Res. 52:803−809. PMID: 1679304. [PubMed] [Google Scholar]
- Leseigneur, C., Lê-Bury P., Pizarro-Cerdá J., and Dussurget O.. . 2020. Emerging evasion mechanisms of macrophage defenses by pathogenic bacteria. Front. Cell. Infect. Microbiol. 10:577559. doi: 10.3389/fcimb.2020.577559 [DOI] [PMC free article] [PubMed] [Google Scholar]
- Llorente, C., and Schnabl B.. . 2016. Fast-track clearance of bacteria from the liver. Cell Host Microbe 20:1–2. doi: 10.1016/j.chom.2016.06.012 [DOI] [PubMed] [Google Scholar]
- Lucke, K., Miehlke S., Jacobs E., and Schuppler M.. . 2006. Prevalence of bacteroides and prevotella spp. in ulcerative colitis. J. Med. Microbiol. 55(Pt 5):617–624. doi: 10.1099/jmm.0.46198-0 [DOI] [PubMed] [Google Scholar]
- Mann, E., Wetzels, S. U., Wagner, M., Zebeli, Q., and Schmitz-Esser, S. 2018. Metatranscriptome sequencing reveals insights into the gene expression and functional potential of rumen wall bacteria. Front. Microbiol. 9: 43. doi: 10.3389/fmicb.2018.00043 [DOI] [PMC free article] [PubMed] [Google Scholar]
- McKeith, R. O., Gray G. D., Hale D. S., Kerth C. R., Griffin D. B., Savell J. W., Raines C. R., Belk K. E., Woerner D. R., Tatum J. D., . et al. 2012. National Beef Quality Audit-2011: Harvest-floor assessments of targeted characteristics that affect quality and value of cattle, carcasses, and byproducts’. J. Anim. Sci. 90:5135–5142. doi: 10.2527/jas.2012-5477 [DOI] [PubMed] [Google Scholar]
- Nagaraja, T. G., and Chengappa M. M.. . 1998. Liver abscesses in feedlot cattle: a review. J. Anim. Sci. 76:287–298. doi: 10.2527/1998.761287x [DOI] [PubMed] [Google Scholar]
- Nagaraja, T. G., Narayanan S. K., Stewart G. C., and Chengappa M. M.. . 2005. Fusobacterium necrophorum infections in animals: pathogenesis and pathogenic mechanisms. Anaerobe 11:239–246. doi: 10.1016/j.anaerobe.2005.01.007 [DOI] [PubMed] [Google Scholar]
- Nagaraja, T. G., and Lechtenberg K. F.. . 2007. Liver abscesses in feedlot cattle. Vet. Clin. North Am. Food Anim. Pract. 23:351–369, ix. doi: 10.1016/j.cvfa.2007.05.002 [DOI] [PubMed] [Google Scholar]
- Okuda, K., Kato T., Shiozu J., Takazoe I., and Nakamura T.. . 1985. Bacteroides heparinolyticus sp. nov. isolated from humans with periodontitis. Int. J. Syst. Bacteriol. 35:438–442. doi: 10.1099/00207713-35-4-438 [DOI] [Google Scholar]
- Pacheco‐Yépez, J., Galván‐Moroyoqui J. M., Meza I., Tsutsumi V., and Shibayama M.. . 2011. Expression of cytokines and their regulation during amoebic liver abscess development. Parasite Immunol. 33:56–64. doi: 10.1111/j.1365-3024.2010.01252.x [DOI] [PubMed] [Google Scholar]
- Racanelli, V., and Rehermann B.. . 2006. The liver as an immunological organ. Hepatology 43(2 Suppl 1):S54–S62. doi: 10.1002/hep.21060 [DOI] [PubMed] [Google Scholar]
- Reinhardt, C. D., and Hubbert M. E.. . 2015. Control of liver abscesses in feedlot cattle: a review. Prof. Anim. Sci. 31(2):101–108. doi: 10.15232/pas.2014-01364 [DOI] [Google Scholar]
- Ribeiro, M. G., Risseti R. M., Bolaños C. A., Caffaro K. A., de Morais A. C., Lara G. H., Zamprogna T. O., Paes A. C., Listoni F. J., and Franco M. M.. . 2015. Trueperella pyogenes multispecies infections in domestic animals: a retrospective study of 144 cases (2002 to 2012). Vet. Q. 35:82–87. doi: 10.1080/01652176.2015.1022667 [DOI] [PubMed] [Google Scholar]
- Roop, R. M.II, Smibert R. M., Johnson J. L., and Krieg N. R.. . 1985. Campylobacter mucosalis (Lawson, Leaver, Pettigrew, and Rowland 1981) comb. nov.: emended description. Int. J. Syst. Bacteriol. 35:189–192. doi: 10.1099/00207713-35-2-189 [DOI] [Google Scholar]
- Scanlan, C. M., and Hathcock T. L.. . 1983. Bovine rumenitis-liver abscess complex: a bacteriological review. Cornell Vet. 73(3):288–297. PMID: 6349929. [PubMed] [Google Scholar]
- Stotz, M. K., Henry D. D., and Crossland W. L.. . 2021. Evaluation of immunoglobulin-Y in place of tylosin phosphate in the diets fed to Holstein Steers and preliminary analysis of liver abscess duration on animal growth performance. Transl. Anim. Sci. 5:txaa225. doi: 10.1093/tas/txaa225 [DOI] [PMC free article] [PubMed] [Google Scholar]
- Weinroth, M. D., Carlson C. R., Martin J. N., Metcalf J. L., Morley P. S., and Belk K. E.. . 2017. Rapid Communication: 16S ribosomal ribonucleic acid characterization of liver abscesses in feedlot cattle from three states in the United States. J. Anim. Sci. 95:4520–4525. doi: 10.2527/jas2017.1743 [DOI] [PubMed] [Google Scholar]


