

ABSTRACT
The circadian clock regulates a wide range of physiological processes in plants. Here we showed the circadian variations of the electrical signals in Broussonetia papyrifera L. and Morus alba L. in a natural state, which were analyzed using the day–night cycle method. The circadian characteristics of different plant electrical signals were compared by constructing a coupling model for the circadian rhythm of plant electrical signals. The electrical signal sensor had two electrode plates, which were fixed on the two ends of the splint, leaves could then be clamped and measured. The clamping force between the two electrode plates was uniform, which enabled continuous and nondestructive measurements. The results showed that an electric cyclic behavior was observed (circadian cycle) with the circadian variation in the plants within 24 h. Both the resistance (R) and the impedance (Z) increased firstly in the early morning and then decreased subsequently, while the capacitance (C) showed an opposite variation. Under different weather conditions, plant electrical signals showed periodic changes when the temperature and light intensity in the environment slightly changed within the physiological tolerance of plant. This indicated that the circadian clock of plant electrical signals could be maintained endogenously. The variation curves of plant electrical signals as time increased were fitted using the sine equation. The characteristic parameters of circadian rhythm of plant electrical signals were obtained. We found that although all plant electrical signals exhibited electric cyclic behavior, but the characteristics of circadian rhythms of electrical signals were different. This study provided a scientific basic for precisely monitoring plant electrical signals, and a reference for revealing circadian rhythms of plant electrical signals and their occurrence rules.
KEYWORDS: Broussonetia papyrifera, Morus alba, electrical signal, circadian rhythm
1. Introduction
Plant electrical signal is weak but can be transmitted among cells and tissues, it exists in almost all life activities in plants,1 this type of signal can transfer information among plant tissues and organs quickly and efficiently.2 Ordered flow of electrical currents between cells and organs allows universal, rapid, and efficient communication between a given organism and the external changes. External environment factors including physical factors, i.e., electric current, shock, sudden temperature changes, or certain chemical factors, i.e., organic solvents, cause rapid changes in the membrane potential, and can be transduced in the form of waves: (1) the driving mechanism for wavy changes of the electric potential is the movement of ions across the plasma membrane and organelle membranes, which propagate along the membrane of one cell or organelle, and in turn, determine intracellular electrical activity of the cell and adjust its local metabolism; (2) the short-distance intercellular electrical signal to maintain specific behavior of the group of the cells; and (3) the long-distance intercellular electrical signal from the site of stimulus perception to distal organs, where it triggers plant-wide responses.3 The frequency, amplitude, transmission rate of those waves and the related flow of ions constitute the communication information of the plants.4,5 The network of electrical signaling is present at almost all organisms, from unicellular to multi-cellular organisms, and from animals to plants. Electrical signals stimulate plants to produce physiological changes such as movement, growth and metabolism, and material transportation, regulating the connection between plants and the external environment.6,7 There are many types of electrical signals in plants, which include action potential, variation potential, and system potential.8 First, action potential (AP) is a fast “all-or-nothing” signal, which is induced by a non-damaging stimuli (light/darkness, electrical stimulation, cold, mechanical stimulus), its propagation is connected with living tissues and has a constant rate.9,10 Second, variation potential (VP) is induced by damaging stimuli,11 including local burning and heating, crushing, etc. VP is a very long-term electrical signal; its duration can be minutes, tens of minutes or longer.12 The system potential (SP) is the least investigated electrical signal in plants. SP is a propagating transitory hyperpolarization.13 These electrical signals in plants can directly or indirectly induce the changes of various physiological processes. It is known that electrical signals influence expression of genes,14 phytohormone production,15 phloem mass-flow,16 photosynthesis,17 respiration,18 ATP content,19 plant tolerance,20 etc. Considering the facts, sensing of plant electrical activity and connected processes can be potential basis of plant remote sensing (e.g., on basis of changes in leaf reflectance).21 In mesophyll cells, cells and organelles membrane are largely composed of lipids, proteins and sugars. The phospholipid bilayer is the basic scaffold of the cell membrane, which mainly includes two electron density bands approximately 2.5 nm thick on the inside and outside of the membrane, and a transparent band approximately 2.5 nm thick in the middle.22 Subsequently, the cell is regarded as a concentric spherical capacitor with inductor and resistor functions, in which ions, ion groups and electric dipoles are equivalent to the capacitor’s electrolyte.23 Leaf resistance (R), impedance (Z), and capacitance (C) are related to cell membrane permeability, ion concentration, and cell turgor pressure, these changes can be reflected by electrical parameters. The membrane of a mesophyll cell has strictly selective permeability to various ions. When plant leaves are stimulated by the external environment, the cell membrane permeability changes immediately. Therefore, the electrolyte concentration (ions, ion clusters and electric dipoles) in leaf cells inside and outside changes, leading to changes in R, C, and Z in the leaves, and the water inside the cells also changes. The passive electrical properties of plant leaves (R, C, and Z) can reflect plant water metabolism.24 However, current research only shows that the plant electrical signal is a very sensitive and complex signal, research into its basic characteristics and regularities is still relatively weak. In particular, the regularity of changes in plant electrical signals under natural conditions is still unclear.
Everything in nature has its own variation rules. The Earth’s revolutions around its axis cause regular changes in the environment. These include changes in light, temperature, humidity, etc., which are all based on a period of nearly 24 hours. We refer to the rhythmic response in the behavior and physiological functions of an organism to the periodic changes in geophysics as the organism’s biological clock. Biological clock is the innate rhythmic molecular mechanism in plants by which plants respond to complex environmental changes. The plant circadian system mostly includes input pathways, a core oscillator and output pathways to sense and anticipate the timing cues of the environment and to optimize plant growth and fitness. As a cellular core coordinating system, the plant circadian system can sense the daily recurring light and temperature dynamics, in order to coordinate the metabolism and multiple physiology processes, which provide an adaptive advantage for plant growth and development. Clock entrainment allows plants to achieve the best synchronization to the outside changing environment.25 The rhythm operated with a cycle period of 24 hours is usually called circadian rhythm.26 It is basically synchronized with the changes in nature, i.e., diurnal variation. Circadian rhythms are commonly found in plants (such as cell division, leaf movement, changes in photosynthetic rate, etc.).27 Plant electrical signal is an unstable time-varying signal. The electrical signals of plants change accordingly with the diurnal variation of environmental factors (such as light, temperature). The modulatory relationship between plant biological clock and plant electrical signals indicates the potential application of biological rhythm theory in agriculture. Therefore, the circadian rhythm regulation mechanism of plant electrical signals is worth exploring.
The circadian rhythm of plants is characterized by endogenousness, adjustability, temperature compensation effect, universality and diversity, etc.28 The circadian clock was discovered by Mairan in 1729 when he first tried to solve the origin of the mimosa leaf movement rhythm through experiments.29 The rhythm continues even if the mimosa stays in constant darkness. Mairan hypothesized that the movement of mimosa leaves is controlled by its biological clock. The circadian oscillator is an integral part of the biological clock, which regulates the plant activities and environmental cycle and provides an internal time frame. The circadian clock can be maintained endogenously with an electrochemical oscillator, which is pointed out that the biological clock has a feature named endogenous. Studies have shown that the circadian clock regulates a wide range of electrical and developmental processes in plants. Volkov et al30 used the charge stimulation method to analyze the biologically closed electrochemical circuits in the leaves of C. miniata (Kaffir lily), Aloe vera and Mimosa pudica, found that plants were able to memorize daytime and nighttime. Even at continuous light or darkness, plants recognize nighttime or daytime and change the input resistance. The circadian clock can be maintained endogenously and has electrochemical oscillators, which can activate ion channels in biologically closed electrochemical circuits. The activation of voltage gated channels depends on the applied voltage, electrical charge, and the speed of transmission of electrical energy from the electrostimulator to plants. Circadian clock is a universal timing system involved in many aspects of plant accommodate to the rhythmical environmental changes. Usually, it is affected by many environmental clues, like a light period, temperature, abiotic stresses, and some other factors. It is related to the light–dark cycle, and very sensitive to light, which resets the phase of the rhythm.31–33 Electrochemical phenomena in plants have attracted many researchers since the 18th century. However, most current researches on electrical signals are related to the responses of ground organ to damage or some stimulation.34,35 The research on diurnal variation of plant electrical signals under natural state is seldom investigated.
B. papyrifera and M. alba are both woody plant species that exhibit fast growth and strong adaptability to the environment.36 They are usually grown as medicinal, ornamental, and economic plants.B.papyrifera is a typical pioneer afforestation tree species.37 Studies have shown that B.papyrifera had a strong bicarbonate utilization capacity, and exhibited better drought resistance than M.alba.38 At present, research on circadian changes in plant electrical signals is concentrated on perennial herbs,30 while there is scant research on the electrical signals of perennial woody plants. Therefore, we used B.papyrifera and M.alba as experimental materials in this paper. Under natural environmental conditions, the circadian changes of plant electrical signals were continuously and nondestructively monitored, and the circadian rhythm characteristics of B.papyrifera and M.alba were studied based on electrical signals. One of the key steps in identifying the molecular components of the circadian clocks is to examine the rhythmicity, arhythmicity, or time course data obtained either from simulations or experiments. Whether the data has a rhythm is a vital to make an accurate estimate of the underlying period. Many algorithms can describe the period of rhythms, like MFourFit, FFT NLLS, MESA, Enright Periodogram, Lomb-Scargle periodogram and Spectrum resampling.39 When comparing the period analysis methods, the computation time of each algorithm is also an important factor. The above algorithms have a large computation costs and quite complicated. Biological rhythms are usually expressed as sine and cosine waves using mathematical terms, such as period, phase, and amplitude.19 In this study, the circadian rhythm of plant electrical signals was obtained by continuously monitoring the diurnal patterns of plant electrical signals. Sine equations were commonly used to establish mathematical models of diurnal patterns of air temperature, wind speed, solar radiation and relative humidity.40 The key advantages of this method are simple and the computation costs are low. Therefore, we used the sine equation to construct a coupling model of the relationship between plant electrical signals and time, in order to obtain the circadian rhythm of plant electrical signals. The results can also get more intuitive. We also analyzed and compared the circadian variation of electrical signals in different plants, which provided a scientific basic for accurately monitoring the plant electrical signals, and provided a reference for revealing the circadian rhythm of plant electrical signals and its occurrence rules.
2. Materials and methods
2.1. Overview of the experimental environment
This experiment was carried out in a Venlo greenhouse of Jiangsu University in April to October 2020. The greenhouse is 100 m in length, 40 m in width, east-west orientation, top height of 4.73 m, shoulder height of 4.0 m, and span of 3.2 m. The location is 32.201° north latitude and 119.518° east longitude. Located in the north subtropical middle latitudes. It has obvious monsoon climate characteristics, four distinctive seasons, sufficient rainfall, high temperature and rain in summer, and cold and wet in winter.
2.2. Experimental materials
All experiments were carried out in the greenhouse of the Key Laboratory of Modern Agricultural Equipment and Technology of the Ministry of Education, College of Agricultural Engineering at Jiangsu University. The plants of B. papyrifera and M. alba were two-year-old seedlings, obtained from Suqian city, Jiangsu Province, they were main afforestation tree species in typical karst areas. The seedlings were transplanted into a cultivation bucket, a mixed substrate of perlite/nutrient soil (1:1) was used as the cultivation substrate, and seedlings were watered every week after planting. They were cultivated with 1/2 Hoagland nutrient solution after survival. When the plants had grown 7 or 8 true leaves, they were cultivated with a normal concentration of Hoagland nutrient solution. The experimental seedlings were cultivated under natural light and at room temperature.
2.3. Main test equipment
The instruments (Figure 1) included LCR tester (HIOKI, Japan, 3532–50), PC (ThinkPad 1430), homemade parallel plate capacitor (1), foam plate (2), capacitor circular electrode plate (3), and wire with a diameter of 10 mm (4). The parallel plate capacitor was connected to the LCR tester with wire, and the LCR tester was connected to the PC.
Figure 1.
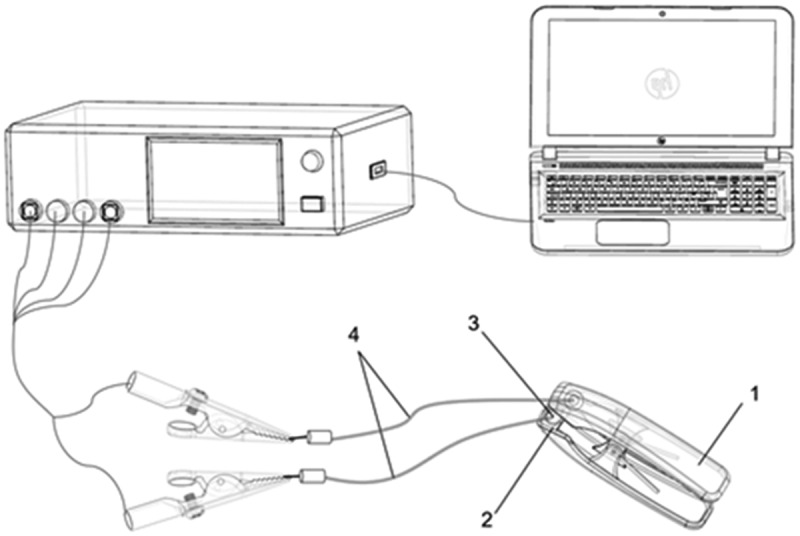
Schematic of the experimental setup (1) Parallel plate capacitor; (2) foam board; (3) electrode; (4) wire
2.4. Measurement of diurnal variation in plant electrical signals
In order to continuously and nondestructively monitor the circadian changes in plant electrical signals under different environmental conditions, this experiment was carried out in sunny and cloudy weather. The leaves on the new branches of the plant were selected, and the leaves were clamped between two parallel electrode plates, avoiding the main leaf vein, while connecting the LCR tester and keep the position of the two electrode plates still. Then, we set the voltage (V), frequency (KHz), and time as follows: voltage of 1.5 V; frequency of 3 KHz; recording the data of the plant electrical parameters, including R: resistance (Ω), C: impedance (F), and Z: impedance (Ω), every 5 minutes, starting at 0:00 a.m. The plant was monitored continuously for 72 hours, and this was repeated 3 times for each plant. Environmental factors, such as solar radiation and temperature, were continuously recorded by a precise meteorological sensor that was part of a miniature agricultural meteorological automatic station located at the experimental site.
2.5. Model construction
In order to accurately obtain the change characteristics of the circadian rhythm of plant electrical signals, the resistance, capacitance, and impedance of the B. papyrifera and M. alba were constructed using the sine function. The equations are as follows:
| (1) |
| (2) |
| (3) |
In the equations above, R is for resistance, C for capacitance, and Z for impedance. The parameters a1, a2, and a3 refer to the amplitude of the sine function, and t is the corresponding abscissa; c1, c2, and c3 are the initial phase at t = 0, reflecting left and right translation; R0, C0, and Z0 are the offset distances, which reflect the upward or downward translation, and b1, b2, and b3 are the cycles of the sine function.
2.6. Characterization of the circadian rhythm of plant electrical signals
The circadian rhythm characteristics of different plant electrical signals were characterized according to the parameters in the equations. In the equations, R0 represents the basic resistance (RB), C0 represents the basic capacitance (CB), and Z0 represents the basic impedance (ZB). Parameters a1, a2, and a3 refer to the amplitude of the sine function, representing variable resistance (RV), variable capacitance (CV), and variable impedance (ZV). The sum of RV and RB is characterized as the resting resistance (RR). The difference between CV and CB represents the resting capacitance (CR). The sum of ZV and ZB represents the resting impedance (ZR). The equations are:
| (4) |
| (5) |
| (6) |
Parameters b1, b2, and b3 are the periods, which are T1, T2, and T3 in units of h (hours) when converted into time periods. The conversion equations are:
| (7) |
| (8) |
| (9) |
Parameters c1, c2, and c3 are the initial phases (IP) when t = 0, which are IP1, IP2, and IP3 in units of h (hours) when converted to the initial phases in units of time. The equations are:
| (10) |
| (11) |
| (12) |
Therefore, the equations (1)-(3) can be converted into:
| (13) |
| (14) |
| (15) |
2.7. Data analysis
We used Excel 2010 to statistically analyze the test data, and used Sigma Plot (Sigma Plot 14.0) for model construction and graphing. All determinations were based on 3 replicates.
3. Results
3.1. Diurnal variation in electrical signals of B. papyrifera and M. alba under different weather conditions
We connected the LCR tester under different weather conditions (sunny and cloudy) for the continuous online monitoring of the electrical signals of the B. papyrifera and M. alba leaves. In the meteorological industry standard, the percentage of the cloud area in the sky is used as the basis for distinguishing sunny and cloudy days: between 0% to 10% is sunny days, and more than 70% is cloudy days.41 The results showed that, no matter whether it was sunny or cloudy, the electrical signals of B. papyrifera and M. alba had periodicity of around 24 h. As shown in (Figure 2), the R values of B. papyrifera and M. alba had periodicity. The values increased firstly and then decreased subsequently, the R value increased rapidly with time from 6:00 am, then reached the maximum value right after noon, and then declined until 6:00 the next day. It then rose again, basically repeating the cycle of the previous day. The overall trend of diurnal variation in the Z values of B. papyrifera and M. alba was similar to the R. The C values also showed periodic changes, gradually decreased from around 6:00 am. The lowest C value appeared right after noon, and then it gradually rose until the early morning in the next day, and continued to fall, kept the diurnal cycle, which was contrary to R and Z.
Figure 2.
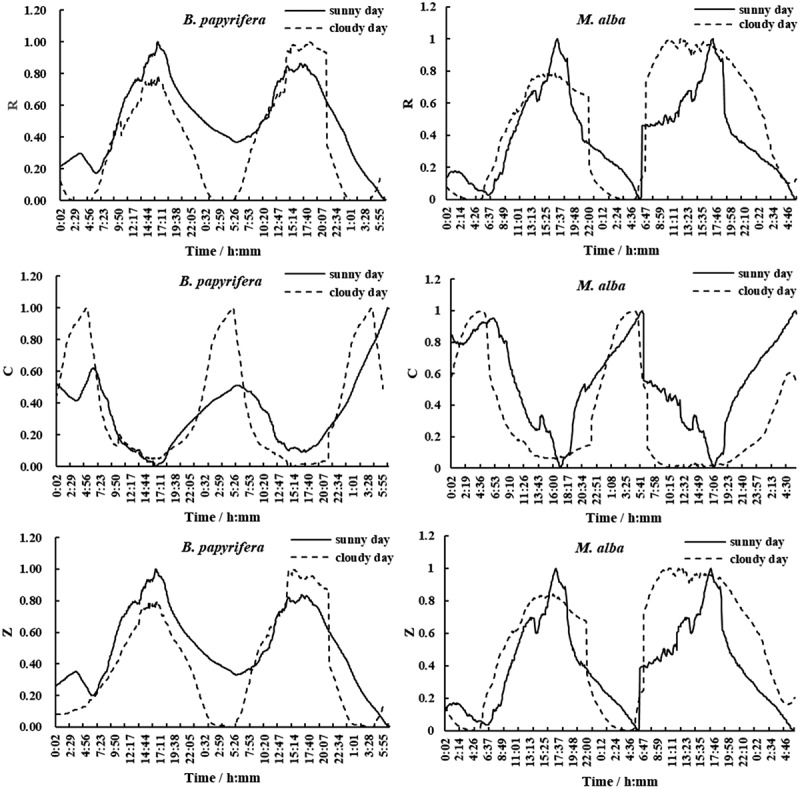
Diurnal variation in R, C, and Z values of B. papyrifera and M. alba under different weather conditions
Note: All electrical indicators were normalized and then mapped.
It could be seen from (Figure 2) that, under clear and overcast days, the curves of the electrical signals of B. papyrifera and M. alba with time were not smooth. From the distribution the graphics, there were many irregular changes, but the overall trends were similar and showed periodic change. The curves on sunny days were sharper and more tortuous. The highest temperature under the two weather conditions (T) (Figure 3(a)) typically occurred at around 14:00, and the highest photosynthetically active radiation (PAR) (Figure 3(b)) typically occurred at around 12:00–13:00.
Figure 3.
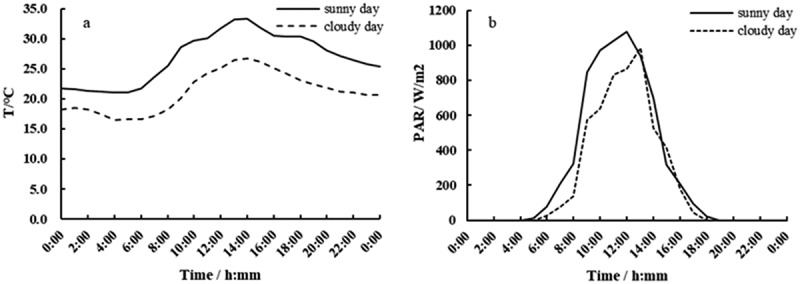
Diurnal variation in T (a) and PAR (b) under two weather conditions
3.2. Correlation analysis of plant electrical signals and meteorological factors
(Figure 4) shows the diurnal variation of the main meteorological factors under sunny weather conditions. With the progress of the diurnal variation, the photosynthetically active radiation (PAR) first increased and then decreased, reaching the maximum value of the day around 12:00. The diurnal variation trend of atmospheric temperature (T) also showed a trend of first increase and then decrease, with the highest temperature around 14:00. The trends of the atmospheric relative humidity (RH) were opposite to the PAR and T. It first droped and then rose. The RH was the highest in the early morning, and the lowest value was around 14:00.
Figure 4.
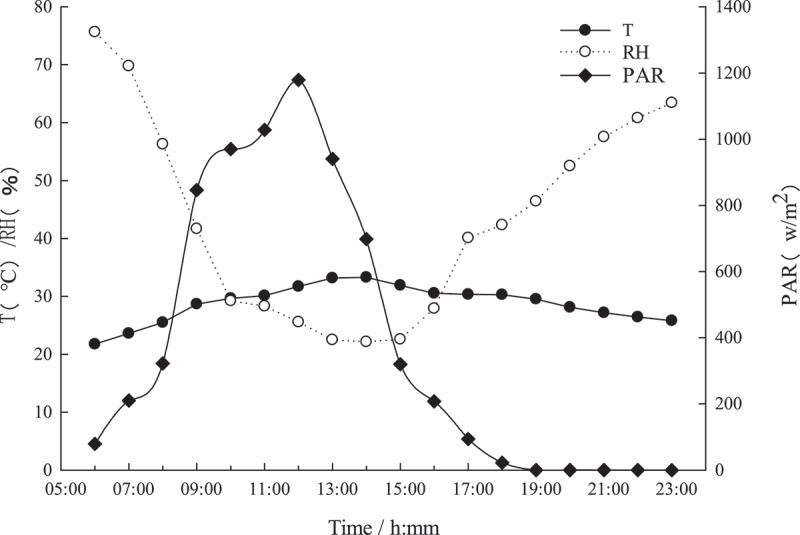
Diurnal variation of meteorological factors
It could be seen from (Table 1) that there was a good correlation between the plant electrical parameters and the main meteorological factors. R and Z had a very significant positive correlation with T, and a very significant negative correlation with RH. The electrical parameters C had a very significant negative correlation with T, and a very significant positive correlation with RH. The correlation between the three electrical parameters and PAR was not significant. Among meteorological factors, the largest correlation coefficient was T, followed by RH.
Table 1.
Correlation between plant electrophysiological signals and meteorological factors
| species | Electrical parameters | PAR | T | RH |
|---|---|---|---|---|
| B. papyrifera | R | 0.089 | 0.867** | −0.769** |
| C | −0.274 | −0.938** | 0.868** | |
| Z | 0.182 | 0.902** | −0.828** | |
| M. alba | R | 0.003 | 0.800** | −0.683** |
| C | −0.119 | −0.856** | 0.754** | |
| Z | 0.075 | 0.823** | −0.723** |
Note: * indicates a significant correlation at the 0.05 level; ** indicates a significant correlation at the 0.01 level, the same below.
3.3. The circadian rhythm models and characteristics of B. papyrifera and M. alba electrical signals under different weather conditions
As shown in (Table 1), according to the diurnal variation in the electrical signals of B. papyrifera and M. alba, a coupling model of R was constructed with time under different weather conditions. It could be seen that the sine function model fitting B. papyrifera and M. alba electrical signal changed with time could well represent this relationship. The equations and parameter values were differently fitted for different plants, and they were different in the same plant under different weather conditions.
The characteristic parameters RR of B. papyrifera under cloudy days were greater than those under sunny days, while M. alba had a higher RB and RR values, and a lower RV, on sunny days than cloudy days. Under the same weather conditions, the RB, RV, and RR values of M. alba were all higher than B. papyrifera. T1 shifts over an approximately 24 h period. Compared with sunny days, the IP1 on cloudy days shifted to the right.
It could be seen from (Table 2) that the construction of a coupling model of C changed over time could well characterize its circadian rhythm. The characteristic parameters CR of M. alba on couldy days were higher. The CR value of M. alba was lower than B. papyrifera under the same weather conditions. The circadian rhythm period T2 of the C values of the two plant species on cloudy days was greater than on sunny days. M. alba demonstrated a time period of less than 1 h under sunny conditions, which indicated that there might be a small cycle in the C value of M. alba. The IP2 values of the two plant species both shifted to the right on cloudy days compared to sunny days.
Table 2.
Equations and parameters of R (Ω) of B. papyrifera and M. alba under different weather conditions (P < .0001)
| species | weather | Equations and parameters |
|||||||
|---|---|---|---|---|---|---|---|---|---|
| RB | RV | RR | T1 | IP1 | R2 | Fitting equation | |||
| B. papyrifera | sunny day | 9915.6 | 2747.9 | 12663.5 | 24.72 | −10.31 | 0.96 | R = 9915.6 + 2747.9.1sin) | |
| cloudy day | 12795.7 | 9358.1 | 22153.8 | 24.72 | 15.46 | 0.98 | R = 12795.7 + 9358.1sin) | ||
| M. alba | sunny day | 60339.9 | 8683.8 | 69023.7 | 22.8 | −10.56 | 0.93 | R = 60339.9 + 8683.8sin) | |
| cloudy day | 25331.8 | 19024.3 | 44356.1 | 25.2 | 15.88 | 0.94 | R = 25331.8 + 19024.3sin) | ||
It could be seen from (Table 3) that the construction of a coupling model of C changed over time could well characterize its circadian rhythm. The characteristic parameters Z values of B. papyrifera and M. alba were similar to R. The ZB, ZV, and ZR values of B. papyrifera on sunny days were all higher than on cloudy days, while M. alba had higher ZB and ZR, and lower ZV, on cloudy days than on sunny days. Under the same weather conditions, the ZB, ZV, and ZR values of M. alba were all higher than those of B. papyrifera, and their periods were also greater on cloudy days, with initial phase shifted to the right compared with those on sunny days.
Table 3.
Equations and parameters of C (F) of B. papyrifera and M. alba under different weather conditions (P < .0001)
| species | weather | Equations and parameters |
|||||||||||||
|---|---|---|---|---|---|---|---|---|---|---|---|---|---|---|---|
| CB | CV | CR | T2 | IP2 | R2 | Fitting equation | |||||||||
| B. papyrifera | sunny day | 6.66 × 10⁻⁹ | 1.49 × 10⁻⁹ | 5.17 × 10⁻⁹ | 23.76 | 1.85 | 0.92 | C = 6.66 × 10⁻⁹ + 1.49 × 10⁻⁹sin) | |||||||
| cloudy day | 6.99 × 10⁻⁹ | 4.65 × 10⁻⁹ | 2.34 × 10⁻⁹ | 27.84 | 4.83 | 0.84 | C = 6.99 × 10⁻⁹ + 4.65 × 10⁻⁹sin) | ||||||||
| M. alba | sunny day | 1.88 × 10⁻⁹ | 1.78 × 10⁻¹¹ | 1.86 × 10⁻⁹ | 3.84 | 0.34 | 1.00 | C = 1.88 × 10⁻⁹ + 1.78 × 10⁻¹¹sin) | |||||||
| cloudy day | 4.18 × 10⁻⁹ | 2.03 × 10⁻⁹ | 2.15 × 10⁻⁹ | 28.08 | 5.27 | 1.00 | C = 4.18 × 10⁻⁹ + 2.03 × 10⁻⁹sin) | ||||||||
4. Discussion
The circadian rhythm regulates a wide range of electrical and developmental processes in plants. Circadian clock is the innate rhythmic molecular mechanism in plants by which plants respond to complex environmental changes. Via the transcriptional and translational feedback among the core components of clock, plants can integrate the environmental cues such as light and temperature to coordinate and involve the photoperiodic flowering, signal transduction, growth, metabolism, and biotic/abiotic stress.42 Volkov et al.43 used the charge stimulation method to analyze the biologically closed electrochemical circuits that regulated physiology in Aloe vera and Mimosa pudica leaves. This study showed the circadian rhythm changes in plants in response to electrical stimuli and proved that the circadian clock could be maintained endogenously. The shock-sensitive movement of Mimosa pudica was accompanied by changes in the ion concentration ratio in and out of the leaf occipital region cells, as well as the generation of action potentials.44 Leng et al.45 utilized a wavelet analysis of the changes in plant surface potential caused by environmental factors to show that many such factors caused changes in the local surface potential of plants. The electrical signals of plants are considered to be the fastest plant responses to environmental changes and closely related to the plants’ life activities, including their metabolism of substances and energy, development, stress resistance and signal transduction. When plant cells lose water and shrink, resulting in the cell volume to become smaller, and cell swelling pressure must change. Capacitance is related to the degree of expansion and contraction of plant cells. At the same time, changes in water will inevitably cause changes in cell membrane permeability and ion concentration inside and outside of cell, which are closely related to resistance and impedance.35 Plants are affected by different degrees of environmental stress at different times of the day. The moisture status, ion concentration, and cell membrane permeability of cells will change immediately, plant electrical signals will also change accordingly.
In this study, we continuously and nondestructively monitored the leaf electrical signals of B. papyrifera and M. alba online under two weather conditions. The results showed that the plant electrical signals exhibited diurnal changes as the environmental cycle alternates between day and night; it was periodic with obvious rhythmic characteristics, and it did not vary with changes of weather conditions. When the main environmental factors including temperature and light were slightly changed within the plant’s normal physiological tolerance, the plant electrical signal still showed periodic changes, which indicated that the plant electrical signal was controlled by the circadian clock and could be maintained endogenously. The change trend in capacitance was opposite to that in resistance and impedance. This is because, in a homogeneous medium, the resistance between two conductors is inversely proportional to the capacitance.46
According to the periodic changes in the electrical signals of the two plant species, there were differences in their circadian rhythms. We used the sine equation, which was a periodic equation, to fit the circadian rhythm of the electrical physiological signals of B. papyrifera and M. alba and time (Tables 2 and 4). The results were intuitive and reliable, which proved that the electrical signals of both plant species had periodic change characteristics, and we compared the circadian rhythm characteristics of the plants using the model parameters.
Table 4.
Equations and parameters of Z (Ω) of B. papyrifera and M. alba under different weather conditions (P < .0001)
| species | weather | Equations and parameters |
||||||
|---|---|---|---|---|---|---|---|---|
| ZB | ZV | ZR | T3 | IP3 | R2 | Fitting equation | ||
| B. papyrifera | sunny day | 6315.0 | 1556.0 | 7871.0 | 23.76 | −10.13 | 0.95 | Z = 6315.0 + 1556.0sin) |
| cloudy day | 8143.7 | 4604.9 | 12748.6 | 24.96 | 15.53 | 0.98 | Z = 8143.7 + 4604.9sin) | |
| M. alba | sunny day | 25741.9 | 3257.3 | 28999.2 | 22.80 | 12.37 | 0.93 | Z = 25741.9 + 3257.3sin) |
| cloudy day | 12474.3 | 7045.1 | 19519.4 | 25.92 | 16.71 | 0.96 | Z = 12474.3 + 7045.1sin) | |
Studies have shown that the circadian cycle of plants had never been precise 24 h, this is because the circadian rhythm has the characteristics of diversity, and its cycle range is generally about 24 ± 2 h.47 However, some plants have a small cycle range, and their rhythmic cycle is much less than 24 h.48 In this study, the electrical signal rhythm cycle of the two plant species was not exactly 24 h, but about 24 h. And the circadian rhythm of plants was not static, it may be reset by certain environmental factors, which are called “timing factors” (zeitgeber). Light and temperature are the two main timing factors for plant circadian rhythms.49 The plant’s own physiological conditions change together with the external environment, which affects the plant’s electrical signals.
In this experiment, we conducted continuous online monitoring of the electrical signals of plants under different weather conditions (different light and temperature), and the results indicated that the electrical signals of B. papyrifera and M. alba showed periodic changes under different weather conditions and that their circadian rhythm characteristics were different.
Due to the temperature compensation effect,50 the circadian rhythm of plant electrical signals remains relatively stable within a certain temperature range. Therefore, the electrical cycle phenomenon of plants is maintained even under different weather conditions, and changes during the day as the ambient temperature changes. Studies have shown that the amplitude of plant electrical signals gradually increased with the temperature in an overall trend from strong to weak.51 This was probably one of the reasons for change curve of plant electrical signal was not smooth in this study. The periodicity of both the plant electrical signals and temperature had similar trends, but it could be seen that the former was not completely determined by the latter. The observed changes in electrical signals and temperature were not synchronized, and the peak value of the latter was earlier.
Light is an important environmental factor for plant growth. Many factors of light affect the growth and development process of plants, including light intensity, light quality, and photoperiod (light/dark period time).52 The electrical signal of plants increases with increasing light intensity within a certain range.53 The maximum electrical signals of B. papyrifera and M. alba appeared in the afternoon, which might be the high light intensity at noon. Studies have shown that light resets the phase of the circadian clock,31 which was also reflected in this research. According to the characteristic parameters of the circadian rhythm in (Table 2 to 4), the initial phase of the cloudy days had a shift compared with sunny days. Furthermore, the cycle time of the circadian rhythm on cloudy days was greater than that on sunny days, an effect that might also be caused by changes in the light environment.
Meteorological factors are important factors that affect the physiological growth and development of plants, as well as one of the main factors that affect plant electrical signals. Through correlation analysis, it was found that there was a good correlation between plant electrical parameters and main meteorological factors, which showed that the rhythm variations of electrical signals were affected by meteorological factors. The influence of T on plant R and Z was positive, but it had a negative effect on C, which was consistent with the diurnal variation trend of meteorological factors and electrical parameters. The larger correlation coefficient was T, which indicated that it had the greatest impact on the plant electrical signals, and plant leaves were very sensitive to T. The second was RH, indicating that the environmental humidity would also affect the electrical signal of the plant. The effect of PAR was not obvious, because the diurnal variation of PAR were not synchronized with the changes in electrical signals. This required us to further study in the future.
Plant electrical signals are changes in the membrane potential generated by tissues and cells under stimulation from the external environment. They function as a plant physiological signal that characterizes the physiological processes and growth state of plants, and they are weak, low frequency, and unstable.51 The electrical signals obtained in this study varied greatly, which showed that different plants had different circadian rhythms of electrical signals.
The resting potential is the potential difference between the two sides of the membrane when the cell is not affected by external environment and is in a resting state. In this study, under the same weather conditions, the RR and ZR values of M. alba were greater than those of B. papyrifera, while for CR, the opposite was observed. Studies have shown that the electrical characteristics of plants can well characterize the ability of plants to resist changes in the external environment. For instance, Jin et al.54 used a trocar-type resistance sensor to study the physiological and electrical characteristics of corn, which showed that the physiological and electrical resistance of corn stalks and the C values of the leaves can accurately reflect the water condition of the plant. Wu et al.55 showed that the change trends of C and water content are the same as that of water potential. The electrical parameters C can sensitively reflect changes in the wheat leaf water content, and its change range can reflect the strength of drought resistance and the level to which winter wheat suffers from arid. In this study, combined with different degrees of the external environment, such as light and temperature, the water status of plants would also has been affected to a certain extent. The physiological capacitance of B. papyrifera in a resting state was higher than that of M. alba. We could conclude that the water condition of B. papyrifera was better than that of M. alba, and its ability to resist external environment change was stronger than that of M. alba as well. This was the same as the result of our previous studies2,56 demonstrating that the electrical characteristics of B. papyrifera show better drought resistance and rehydration abilities than those of M. alba. By comparing the cycle of the circadian rhythms of B. papyrifera and M. alba, we found that the cycle of the electrical signal varied across different plants but was maintained at around 24 h. The C value of M. alba had a period of less than 1 h on sunny days, indicating that M. alba not only had a cycle of more than 24 h but also had small cycles. Maybe the small cycle obscured the greater cycle, which did not appear in B. papyrifera.
5. Conclusion
In summary, the electrical signals of B. papyrifera and M. alba showed periodic changes, with a period of about 24 h, controlled by the circadian clock. Even under different weather conditions, the electrical signals of the plants still showed cyclical changes. This indicated that the circadian rhythm of plant electrical signals could be maintained endogenously. Using of the sine equation to fit the model of plant electrical signals over time could well represent the circadian rhythm of electrical signals. Through comparisons between the model and various characteristic parameters, we knew that the characteristics of the circadian rhythms of electrical signals in different plants were different as well.
Acknowledgments
We thank the Support Plan Projects of Science and Technology Department of Guizhou Province [No. (2021)YB453], the National Natural Science Foundation of China [No. U1612441-2], and Priority Academic Program Development [PAPD] of Jiangsu Higher Education Institutions for supporting this research.
Funding Statement
This work was supported by the Excellent Young Talents Fund Program of Higher Education Institutions of Anhui Province; National Natural Science Foundation of China [U1612441-2]; Science and Technology Plan Project of Guizhou Province [(2021)YB453].
Disclosure statement
No potential conflict of interest was reported by the author(s).
Abbreviations
| R | resistance |
| C | capacitance |
| Z | impedance |
| RB | basic resistance |
| RV | variable resistance |
| RR | resting resistance |
| CB | basic capacitance |
| CV | variable capacitance |
| CR | resting capacitance |
| ZB | basic impedance |
| ZV | variable impedance |
| ZR | resting impedance |
| IP | initial phases |
References
- 1.Yan XF, Wang ZY, Huang L, Wang C, Hou RF, Xu ZL, Qiao XJ.. Research progress on electrical signals in higher plants. Prog Nat Sci. 2008;19(5):1–10. doi: 10.1016/j.pnsc.2008.08.009. [DOI] [Google Scholar]
- 2.Yan HW, Wang Z, Yang X, Wang XM, Gao HW.. Response of tall oatgrass to salinity stress at the seedling stage. Acta Agrestia Sinica. 2011;19:90–96. [Google Scholar]
- 3.Szechyńska-Hebda M, Lewandowska M, Karpiński S. Electrical signaling, photosynthesis and systemic acquired acclimation. Front Physiol. 2017;8:684. doi: 10.3389/fphys.2017.00684. [DOI] [PMC free article] [PubMed] [Google Scholar]
- 4.Sorkin ML, Nusinow DA. Time will tell: intercellular communication in the plant clock. Trends Plant Sci. 2021;26(7):706–719. doi: 10.1016/j.tplants.2020.12.009. [DOI] [PubMed] [Google Scholar]
- 5.Stahlberg R, Cleland RE, Volkenburgh EV. Slow wave potentials—a propagating electrical signal unique to higher plants. Berlin, Heidelberg:Springer Berlin Heidelberg; 2006. p. 291–308. [Google Scholar]
- 6.Fromm J, Lautner S. Electrical signals and their physiological significance in plants. Plant Cell Environ. 2007;30(3):249–257. doi: 10.1111/j.1365-3040.2006.01614.x. [DOI] [PubMed] [Google Scholar]
- 7.Lautner S, Grams TEE, Matyssek R, Fromm J. Characteristics of electrical signals in poplar and responses in photosynthesis. Plant Physiol. 2005;138(4):2200–2209. doi: 10.1104/pp.105.064196. [DOI] [PMC free article] [PubMed] [Google Scholar]
- 8.Sukhov V, Sukhova E, Vodeneev V. Long-distance electrical signals as a link between the local action of stressors and the systemic physiological responses in higher plants - ScienceDirect. Prog Biophys Mol Biol. 2019;146:63–84. doi: 10.1016/j.pbiomolbio.2018.11.009. [DOI] [PubMed] [Google Scholar]
- 9.Sukhov V. Electrical signals as mechanism of photosynthesis regulation in plants[J]. Photosynth Res Int J. 2016;130(1–3):373–387. doi: 10.1007/s11120-016-0270-x. [DOI] [PubMed] [Google Scholar]
- 10.Sukhov V, Gaspirovich V, Mysyagin S, Vodeneev V. High-temperature tolerance of photosynthesis can be linked to local electrical responses in leaves of pea. Front Physiol. 2017;8:763. doi: 10.3389/fphys.2017.00763. [DOI] [PMC free article] [PubMed] [Google Scholar]
- 11.Vodeneev V, Akinchits E, Sukhov V. Variation potential in higher plants: mechanisms of generation and propagation. Plant Signal Behav. 2015;10(9):e1057365. doi: 10.1080/15592324.2015.1057365. [DOI] [PMC free article] [PubMed] [Google Scholar]
- 12.Sukhova E, Mudrilov M, Vodeneev V, Sukhov V. Influence of the variation potential on photosynthetic flows of light energy and electrons in Pea. Photosynth Res. 2018;136(2):215–228. doi: 10.1007/s11120-017-0460-1. [DOI] [PubMed] [Google Scholar]
- 13.Zimmermann MR, Felle HH. Dissection of heat-induced systemic signals: superiority of ion fluxes to voltage changes in substomatal cavities. Planta. 2009;229(3):539–547. doi: 10.1007/s00425-008-0850-x. [DOI] [PubMed] [Google Scholar]
- 14.Mousavi S, Chauvin A, Pascaud F, Kellenberger S, Farmer EE. Glutamate Receptor-Like genes mediate leaf-to-leaf wound signalling. Nature. 2013;500(7463):422–426. doi: 10.1038/nature12478. [DOI] [PubMed] [Google Scholar]
- 15.Hlaváčková V, Krchňák P, Nauš J, Novák O, Kpundová M, Strnad M. Electrical and chemical signals involved in short-term systemic photosynthetic responses of tobacco plants to local burning. Planta. 2006;225(1):235–244. doi: 10.1007/s00425-006-0325-x. [DOI] [PubMed] [Google Scholar]
- 16.Furch CU, van Bel AJE, Fricker MD, Felle HH, Fuchs MF, Hafke JB. Sieve element Ca2 </sup>+ channels as relay stations between remote stimuli and sieve tube occlusion in vicia faba. Plant Cell. 2009;21(7):2118–2132. doi: 10.1105/tpc.108.063107. [DOI] [PMC free article] [PubMed] [Google Scholar]
- 17.Vuralhan-Eckert J, Lautner S, Fromm J. Effect of simultaneously induced environmental stimuli on electrical signalling and gas exchange in maize plants. J Plant Physiol. 2018;223:32–36. doi: 10.1016/j.jplph.2018.02.003. [DOI] [PubMed] [Google Scholar]
- 18.Lautner S, Stummer M, Matyssek R, Fromm J, Grams TEE. Involvement of respiratory processes in the transient knockout of net CO2 uptake in Mimosa pudica upon heat stimulation. Plant Cell Environ. 2014;37(1):254–260. doi: 10.1111/pce.12150. [DOI] [PubMed] [Google Scholar]
- 19.Surova L, Sherstneva O, Vodeneev V, Katicheva L, Semina M. Variation potential-induced photosynthetic and respiratory changes increase ATP content in Pea leaves[J]. J Plant Physiol. 2016;202:57–64. [DOI] [PubMed] [Google Scholar]
- 20.Sukhov V, Surova L, Sherstneva O, Vodeneev V. Influence of variation potential on resistance of the photosynthetic machinery to heating in Pea. Physiol Plant. 2014;152(4):773–783. doi: 10.1111/ppl.12208. [DOI] [PubMed] [Google Scholar]
- 21.Sukhova E, Yudina L, Akinchits E, Vodeneev V, Sukhov V. Influence of electrical signals on Pea leaf reflectance in the 400–800-nm range. Plant Signal Behav. 2019;14(7):1–5. doi: 10.1080/15592324.2019.1610301. [DOI] [PMC free article] [PubMed] [Google Scholar]
- 22.Kennedy JF, Garaita M. Introduction to plant physiology. Carbohydr Polym. 2000;43:299–300. [Google Scholar]
- 23.Philip N. Biological physics: energy, information life. New York (NY, USA): Freeman and Company; 2003. p. 413–448. [Google Scholar]
- 24.Zhang C, Wu YY, Su Y, Xing DK, Dai Y, Wu YS, Fang L. A plant’s electrical parameters indicate its physiological state: a study of intracellular water metabolism. Plants. 2020;9(10):1256. doi: 10.3390/plants9101256. [DOI] [PMC free article] [PubMed] [Google Scholar]
- 25.Chen Y, Xiang Y, Yu GH. Research progress on circadian rhythms in plants. Bot Res. 2018;7(3):331–336. doi: 10.12677/BR.2018.73042. [DOI] [Google Scholar]
- 26.Mc Clung CR. Plant circadian rhythms. Plant Cell. 2006;18(4):792–803. doi: 10.1105/tpc.106.040980. [DOI] [PMC free article] [PubMed] [Google Scholar]
- 27.Nohales MA, Kay SA. Molecular mechanisms at the core of the plant circadian oscillator. Nat Struct Mol Biol. 2016;23(12):1061–1069. doi: 10.1038/nsmb.3327. [DOI] [PMC free article] [PubMed] [Google Scholar]
- 28.Xu XD, Xie QG. Circadian clock and the control of key agronomic traits in higher plants. Science. 2015;27:1336–1344. [Google Scholar]
- 29.Bechtel W. Understanding Biological Mechanisms: using illustrations from circadian rhythm research. Netherlands: Springer; 2013. Vol. 1. p. 487–510. [Google Scholar]
- 30.Waite AJ, Wooten JD, Markin VS, Volkov AG. Time sensors: circadian rhythms in biologically closed electrochemical circuits of plants. ECS Trans. 2013;50(12):23–33. doi: 10.1149/05012.0023ecst. [DOI] [Google Scholar]
- 31.Gary GC. Signal transduction in leaf movement. Plant Physiol. 1995;109(3):729–734. doi: 10.1104/pp.109.3.729. [DOI] [PMC free article] [PubMed] [Google Scholar]
- 32.Burkholder PR, Pratt R. Leaf-movements of Mimosa Pudica in relation to light. Am J Bot. 1936;23(1):46–52. doi: 10.1002/j.1537-2197.1936.tb08950.x. [DOI] [Google Scholar]
- 33.Burkholder PR, Pratt R. Leaf-movements of Mimosa Pudica in relation to the intensity and wave length of the incident radiation. Am J Bot. 1936;23(3):212–220. doi: 10.1002/j.1537-2197.1936.tb08977.x. [DOI] [Google Scholar]
- 34.Wildon DC, Thain JF, Minchin P, Gubb IR, Reilly AJ, Skipper YD, Doherty HM, O’Donnell PJ, Bowles DJ. Electrical signalling and systemic proteinase inhibitor induction in the wounded plant. Nature. 1992;360(6399):62–65. doi: 10.1038/360062a0. [DOI] [Google Scholar]
- 35.Zhang C, Wu YY, Su Y, Li H, Fang L, Xing DK. Plant’s electrical information manifests the composition and nutrient transport characteristics of membrane proteins. Plant Signal Behav. 2021;16(7):1918867. doi: 10.1080/15592324.2021.1918867. [DOI] [PMC free article] [PubMed] [Google Scholar]
- 36.Wu YY, Liu CQ, Li PP, Wang JZ, Xing D, Wang BL. Photosynthetic characteristics involved in adaptability to Karst soil and alien invasion of paper mulberry (Broussonetia papyrifera (L.) Vent.) in comparison with mulberry (Morus alba L.). Photosynthetica. 2009;47(1):155–160. doi: 10.1007/s11099-009-0026-3. [DOI] [Google Scholar]
- 37.Huang HM, Zhao YL, Xu ZG, Zhang W, Jiang K. Physiological responses of Broussonetia papyrifera to manganese stress, a candidate plant for phytoremediation. Ecotoxicol Environ Saf. 2019;181:18–25. doi: 10.1016/j.ecoenv.2019.05.063. [DOI] [PubMed] [Google Scholar]
- 38.Wu YY, Xing DK. Effect of bicarbonate treatment on photosynthetic assimilation of inorganic carbon in two plant species of Moraceae. Photosynthetica. 2012;50(4):587–594. doi: 10.1007/s11099-012-0065-z. [DOI] [Google Scholar]
- 39.Tomasz Z, Anne MM, Eilidh T, Karen JH, Andrew JM, Yamazaki S. Strengths and limitations of period estimation methods for circadian data. Plos One. 2014;9(5):e96462. doi: 10.1371/journal.pone.0096462. [DOI] [PMC free article] [PubMed] [Google Scholar]
- 40.Zhang JX, Liu KC, Wei QP, Shu HR. Modeling mathematically diurnal patterns of meteorologicasl factors (air temperature, radiation, wind speed and relative humidity). J Shandong Agric Univ. 2002;33:179–183. [Google Scholar]
- 41.Che ZS, Tong GH, Wang TL, Bai YK, Tomoharu Y, Wen ZM. Environments of large-scale sunlight greenhouse under clear and overcast days. J Shenyang Agric Univ. 2005;36:462–465. [Google Scholar]
- 42.Wei H, Wang Y, Liu B, Wang L. Deciphering the underlying mechanism of the plant circadian system and its regulation on plant growth and development. Chin Bull Bot. 2018;54:456–467. [Google Scholar]
- 43.Volkov AG, Baker K, Foster JC, Clemmons J, Jovanov E, Markin VS. Circadian variations in biologically closed electrochemical circuits in Aloe vera and Mimosa pudica. Bioelectrochemistry. 2011;81(1):39–45. doi: 10.1016/j.bioelechem.2011.01.004. [DOI] [PubMed] [Google Scholar]
- 44.Volkov AG, Foster JC, Ashby TA, Walker RK, Johnson JA, Markin VS. Mimosa pudica : electrical and mechanical stimulation of plant movements. Plant Cell Environ. 2010;33(2):163–173. doi: 10.1111/j.1365-3040.2009.02066.x. [DOI] [PubMed] [Google Scholar]
- 45.Leng Q, Huang L, Hua BG, Lou CH. Wavelet transform analysis of local electrical potential in plant. Acta Biochim Biophys Sin (Shanghai). 1998;14:140–144. [Google Scholar]
- 46.Jiang Z. Discussion on capacitance between any two conductors in a multi-conductor system. Mod Electr Power. 1988;12:109–155. [Google Scholar]
- 47.Pan WJ, Wang X, Deng YR, Li JH, Chen W, Chiang JY, Yang JB, Zheng L. Nondestructive and intuitive determination of circadian chlorophyll rhythms in soybean leaves using multispectral imaging. Sci Rep. 2015;5(1):11108. doi: 10.1038/srep11108. [DOI] [PMC free article] [PubMed] [Google Scholar]
- 48.Gyllenstrand N, Karlgren A, Clapham D, Holm K, Hall A, Gould PD, Källman T, Lagercrantz U. No time for spruce: rapid dampening of circadian rhythms in Picea abies (L. Karst). Plant Cell Physiol. 2014;55(3):535–550. doi: 10.1093/pcp/pct199. [DOI] [PubMed] [Google Scholar]
- 49.Wang ZY, Chen DS, Huang L. Plant physiological status monitoring system and its application in greenhouse. Trans Chin Soc Agric Eng. 2000;16:101–104. [Google Scholar]
- 50.Philip BK, Michael WY, Eric DS. Temperature compensation and temperature sensation in the circadian clock. Proc Natl Acad Sci U S A. 2015;112(46):6284–6292. doi: 10.1073/pnas.1511215112. [DOI] [PMC free article] [PubMed] [Google Scholar]
- 51.Tian LG, Meng QH, Wang LP, Dong J, Wu H, Chen ZH, Chen Z-H. Research on the effect of electrical signals on growth of Sansevieria under Light-Emitting Diode (LED) lighting environment. Plos One. 2015;10(6):e0131838. doi: 10.1371/journal.pone.0131838. [DOI] [PMC free article] [PubMed] [Google Scholar]
- 52.Shre KC, Sanmitra G, Saptarshi D, Manzella V, Maharatna K, Masi E, Santopolo L, Mancuso S, Maharatna K. Forward and inverse modelling approaches for prediction of light stimulus from electrophysiological response in plants. Measurement. 2014;53(53):101–116. doi: 10.1016/j.measurement.2014.03.040. [DOI] [Google Scholar]
- 53.Yan XF, Wang ZY, Huang L, Wang C, Hou RF, Xu ZL, Qiao XJ. Research progress on electrical signals in higher plants. Prog Nat Sci. 2009;19:531–541. [Google Scholar]
- 54.Jin SD, Zhang SF, Zheng RL. Diagnosis of drought from maize physiological electrical characteristics. Trans Chin Soc Agric Eng. 1999;15:91–95. [Google Scholar]
- 55.Wu L, Guo WC, Xu J. Experimental research on plant electrical properties and physiological properties. J Agric Mechanization Res. 2007;136:136–138. [Google Scholar]
- 56.Zhang MM, Wu YY, Xing DK, Zhao K, Yu R. Rapid measurement of drought resistance in plants based on electrophysiological properties. Trans Am Soc Agric Biol Eng. 2015;58:1441–1446. [Google Scholar]