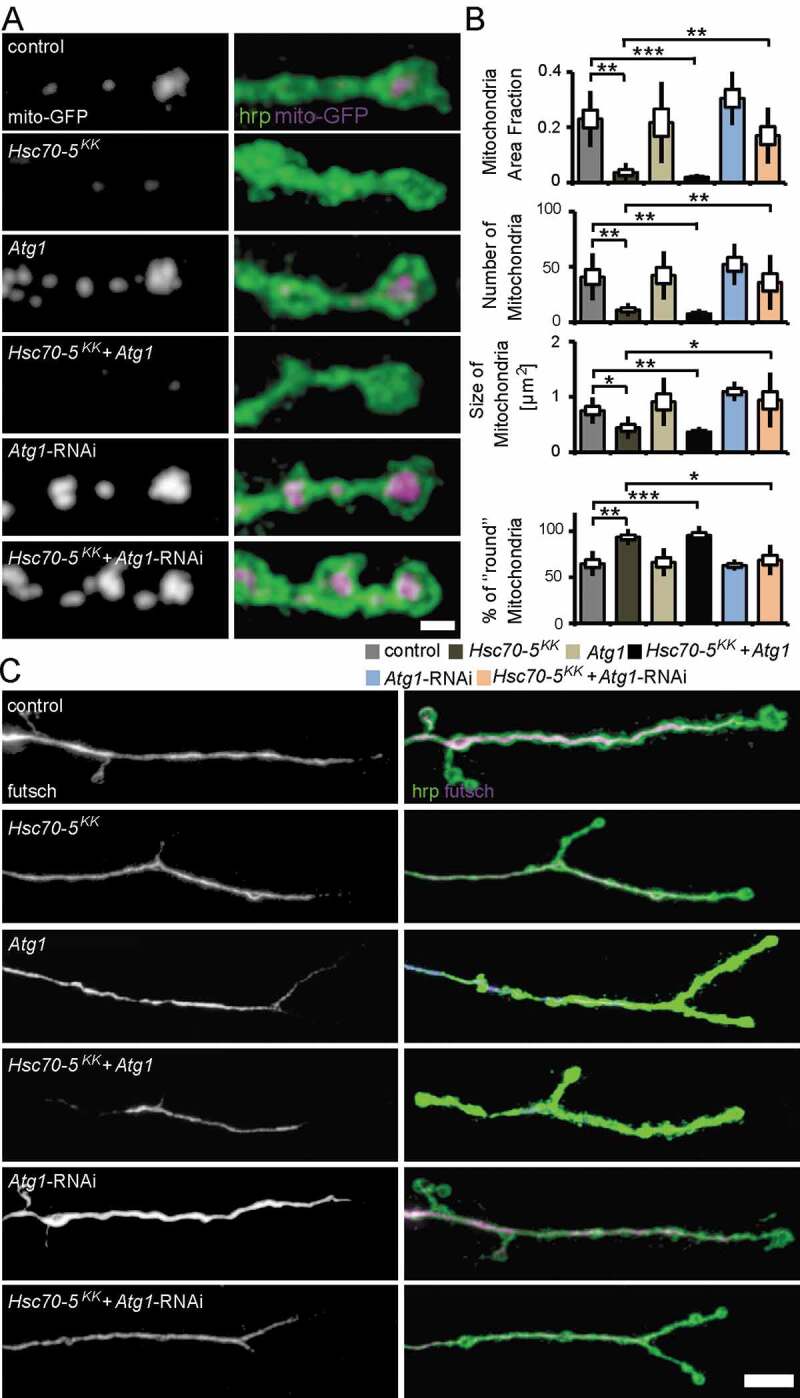
Figure 7.

Autophagy inhibition alleviated mitochondrial and MT defects caused by Hsc70-5 knockdown. (A) Confocal images of larval NMJ expressing mito-GFP (magenta) labeled with hrp (green). Scale bar: 2 μm. (B) Quantification of mitochondrial area fraction, number, size, and morphology. (C) Confocal images of NMJ labeled with hrp (green) and futsch (magenta). Scale bar: 10 μm. The standard error of mean and standard deviation are shown as a box and a black line. * p < 0.05, ** p < 0.01, *** p < 0.001
