Figure 3. Correlation between individual transcriptomes and behavioral biases.
(A) Steps for collecting transcriptomes from flies that have completed the Decathlon. (B) Data matrix of individual head transcriptomes. Rows are individual flies (n = 98). Columns are 17,470 genes sorted by their mean expression across individuals. The dashed line indicates the mean expression cutoff at 10 reads per million (RPM), below which genes were excluded from analysis. (C) Scree plots of the logged % variance explained for ranked principal components of gene expression variation, for observed (red) and shuffled (black) data. Shaded region corresponds to 95% CI as calculated by bootstrap resampling. (D) Performance heatmap (-log p) of linear models predicting the behavior of individual flies from single-gene expression. Colored bars (left) indicate a priori group identity of behavioral measures (rows). Bar graphs show the number of significant (p<0.05) models for each gene (top) and behavior (right). (E) Heatmap showing the probability across bootstrap replicates of a KEGG pathway being significantly enriched in the list of predictive genes for a given behavior. (F) Bar plot showing the average across bootstrap replicates of the maximum (across behaviors) negative log adjusted p-value of all enriched KEGG pathways. Color indicates results from observed (gray) or shuffled control (black) data. (G) Average maximum adjusted -log p-value for enriched KEGG pathways common to all Decathlon iterations. Pathway labels (right) are ordered by batch 3 (outbred) -log adjusted p-value.

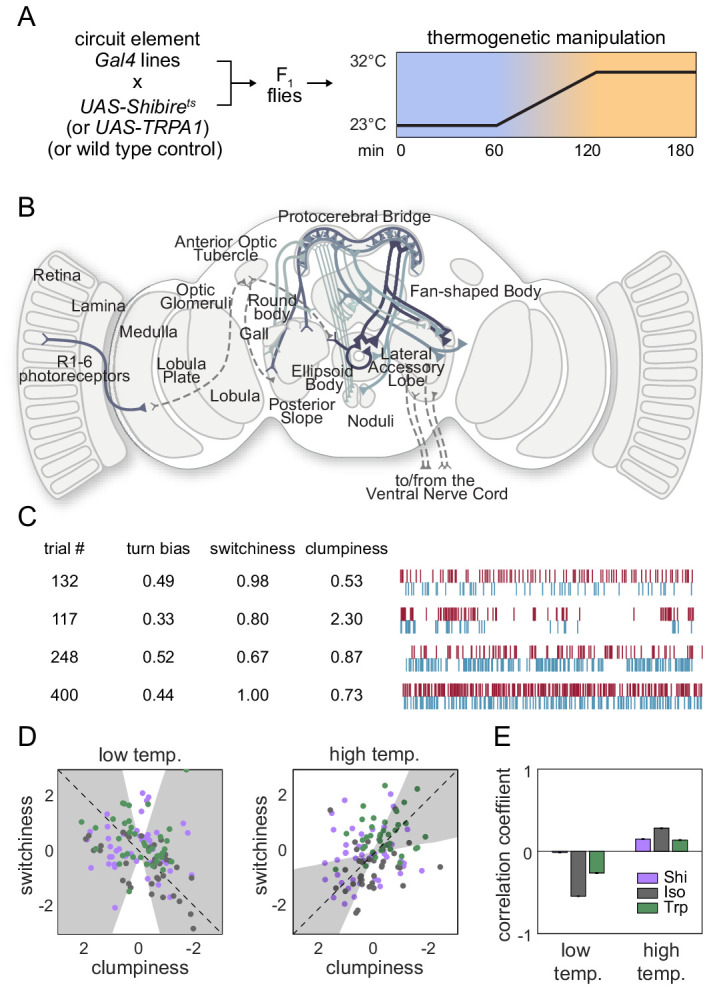
Figure 3—figure supplement 1. Effect of thermogenetic neural perturbation on clumpiness and switchiness.