Abstract
The etiology of ethanol-related congenital heart defects has been the focus of much study, but most research has concentrated on cellular and molecular mechanisms. We have shown with optical coherence tomography (OCT) that ethanol exposure led to increased retrograde flow and smaller atrioventricular (AV) cushions compared with controls. Since AV cushions play a role in patterning the conduction delay at the atrioventricular junction (AVJ), this study aims to investigate whether ethanol exposure alters the AVJ conduction in early looping hearts and whether this alteration is related to the decreased cushion size. Quail embryos were exposed to a single dose of ethanol at gastrulation, and Hamburger–Hamilton stage 19–20 hearts were dissected for imaging. Cardiac conduction was measured using an optical mapping microscope and we imaged the endocardial cushions using OCT. Our results showed that, compared with controls, ethanol-exposed embryos exhibited abnormally fast AVJ conduction and reduced cushion size. However, this increased conduction velocity (CV) did not strictly correlate with decreased cushion volume and thickness. By matching the CV map to the cushion-size map along the inflow heart tube, we found that the slowest conduction location was consistently at the atrial side of the AVJ, which had the thinner cushions, not at the thickest cushion location at the ventricular side as expected. Our findings reveal regional differences in the AVJ myocardium even at this early stage in heart development. These findings reveal the early steps leading to the heterogeneity and complexity of conduction at the mature AVJ, a site where arrhythmias can be initiated.
NEW & NOTEWORTHY To the best of our knowledge, this is the first study investigating the impact of ethanol exposure on the early cardiac conduction system. Our results showed that ethanol-exposed embryos exhibited abnormally fast atrioventricular conduction. In addition, our findings, in CV measurements and endocardial cushion thickness, reveal regional differences in the AVJ myocardium even at this early stage in heart development, suggesting that the differentiation and maturation at this site are complex and warrant further studies.
Keywords: cardiac conduction, congenital heart defects, endocardial cushions, ethanol
INTRODUCTION
Maternal alcohol consumption can give rise to a range of birth defects including craniofacial anomalies, growth deficiencies, neurodevelopmental disabilities, and a wide spectrum of congenital heart defects (CHDs). The phenotypes associated with in utero ethanol exposure are collectively known as fetal alcohol spectrum disorders (FASDs) (1), with fetal alcohol syndrome (FAS) being the most severe type (2). Although alcohol was identified as a teratogen many decades ago (3–5), 11.5% of pregnant women in the United States from 2015 to 2017 self-reported consuming alcohol during pregnancy, with ∼33.9% of those women reporting binge drinking (6). A recent study in the United States found that the prevalence of FASDs among first-grade students was as high as 50.0 per 1000 children (7). As reported, 38% of babies born with FASDs had diseased hearts and the prevalence of CHDs in children with FAS is as high as 50% (8, 9). These CHDs include atrial and ventricular septal defects, valvular defects, and aortic malformations (8), which are life-threatening health issues and often require surgical correction and a lifetime of medical monitoring (10). Given the high prevalence of prenatal ethanol exposure and the severe effects of alcohol on embryonic hearts, alcohol-associated CHDs are a crucial clinical issue that deserves more attention.
Studies have investigated FASD-related CHDs in various animal models. For example, acute ethanol exposure in chicken embryos after 72–80 h of incubation (gastrulation/neurulation stages) led to ventricular septal defects and overriding aorta (11). In mice, acute ethanol exposure at E 6.75, during gastrulation, resulted in thinner myocardial walls and decreased trabeculation on embryonic day 15.5 (12). In the septated heart of late-stage Xenopus embryos, ethanol exposure caused less developed ventricular trabeculae (13). As early as looping heart stages, effects of ethanol were evident as endocardial cushion defects, with reduced cushion size and decreased mesenchymal cell numbers within the cushions, in mice (14), quail (15), and zebrafish (16). Besides these morphological malformations, ethanol-treated embryos also developed abnormal cardiac function. Atrioventricular valve regurgitation and semilunar valve regurgitation were observed by echocardiography in mice on embryonic day 15.5 following ethanol treatment at gastrulation stages (12). Contraction anomalies were found both in chick (17) and Xenopus (13) embryos after ethanol exposure. Interruption of active blood circulation was reported in ethanol-treated quail embryos (18) and Medaka fish embryos (19). At early tubular heart stages, ethanol-exposed quail embryos exhibited higher absolute blood flow, shear stress, and retrograde flow compared with controls (15, 20–23).
Although heart defects induced by ethanol exposure have been studied in various animal species, the mechanism of FASD-related CHDs remains unclear. This study focuses on the effects of ethanol in the early looping stage of cardiogenesis, during endocardial cushion formation and the emergence of physiological conduction delay through the atrioventricular junction (AVJ). Among all FASD-associated CHDs, septal and valve defects are the most prevalent anomalies in patients (8). The progenitors of the septum and valves are the endocardial cushions that are formed when the heart is still a looping tube (24, 25). At mouse E9 or chicken Hamburger–Hamilton (HH) (26) stage 14, the cardiac jelly swells into the lumen at the atrioventricular canal (AVC) and outflow tract (OFT). The expanded cardiac jelly displaces the single layer of squamous epithelial endocardial cells away from the myocardium to create the first discernible endocardial cushions. A subset of endothelial cells lining the AVC and OFT subsequently undergo epithelial to mesenchymal transition to generate mesenchymal cells that migrate into the endocardial cushions and proliferate (25). These mesenchymal cells are joined by epicardial cells that enter the AVJ cushions and neural crest cells that enter the OFT endocardial cushions (25). The atrioventricular and outflow septa and the mature valves then develop from the differentiation and remodeling of the endocardial cushions. Alterations to the development of endocardial cushions is associated with septal defects and valve anomalies (27, 28). Our previous studies in avian embryos demonstrated that a single dose of ethanol at gastrulation reduced the size of atrioventricular cardiac cushions, leading to late-stage valvuloseptal defects (15).
In parallel with endocardial cushion development, the electrical conduction pattern matures (29, 30). In the earlier tubular heart, the impulse propagation velocity along the heart tube is slow and homogeneous (31, 32). During heart looping, the conduction pattern develops an electrical impulse delay at the AVJ, whereas the conduction velocity in the atrium and ventricle increases (33). This AVJ conduction delay is essential for efficient blood pumping, ensuring completion of the atrial systole before the initiation of ventricular contraction. Most studies that have investigated the mechanisms of the restricted slow conduction at AVJ have focused on the role of Bmp2 expression in the myocardium (34–40). Its downstream targets Tbx2 and Tbx3 are thought to be the negative regulators of the gap junction connexin 40 (Cx40), and the ion channel Nav1.5 at the AVJ, thus preventing AVJ myocardial cells from differentiating into the fast conduction fate of the neighboring myocardium and retaining slower conduction characteristics. More recently, it was proposed that formation of the thick endocardial cushions is required for the AVJ myocardium to become slow conducting (41). The swelling cushions at the AVJ separate the myocardium from the endocardium that is secreting endothelin 1 (Et-1), an inductive cue leading to myocardial Cx40 gene expression at the atrial and ventricular regions. When this separation was eliminated by enzymatically removing the cardiac jelly, the conduction velocity (CV) at the AVJ increased. Embedding a piece of the AVJ myocardium closer to the endocardium by microsurgery increased expression of Cx40
Given this evidence supporting that thickening of the endocardial cushions are required for the development of conduction delay at AVJ (41) and the fact that ethanol reduced cushion size (15), we hypothesized that ethanol-exposed embryos that develop smaller AVJ cushions would exhibit abnormally fast AVJ conduction. To test this hypothesis, we compared cardiac morphology and AV conduction between control (untreated or saline-injected) quail embryos and those injected with ethanol at gastrulation. Embryonic hearts were imaged under an optical mapping (OM) microscope to capture conduction maps and then were imaged using optical coherence tomography (OCT) for structural analysis of the endocardial cushions at the AVJ. Our results showed that compared with controls, ethanol exposed embryos exhibited abnormally fast AVJ conduction at early stages. However, the region of faster CV was not strictly correlated with decreased cushion volume or thickness at this stage. In addition, we matched the CV map to the cushion-size map along the inflow heart tube to study their spatial relationship. This is the first study investigating the effects of ethanol on the cardiac conduction of early embryonic hearts.
METHODS
Animal Model
Quail embryos were used in this study for the following reasons: first, avian animals develop four-chambered hearts and show a similar cardiac conduction pattern compared with that in human hearts; second, avian embryos are easily accessible during early cardiac development for acquiring physiological measurements; third, fertilized quail eggs are economical and commercially available from several sources, which enables studies requiring large cohorts.
Ethics Statement
According to the policy of the Institutional Animal Care and Use Committee (IACUC), research on avian embryos euthanized prior to 3 days before hatching will not be subject to review. Quails usually hatch around 17 days of incubation, which is much later than our experimental time points (days 1–3). Therefore, IACUC approval was not required for this study. We followed the operating policy 082017-13 of the Animal Resource Center of our institution Case Western Reserve University for Avian Embryo Use.
Ethanol Exposure
Fertilized quail eggs (Coturnix coturnix communis; Northwest Heritage Quail, Pullman, WA) were incubated in a humidified incubator (G.Q.F. Manufacturing, Savannah, GA) at 38°C. When embryos developed to the gastrulation stage (21 h of incubation, HH stage 4–5), eggs were moved from the incubator for ethanol injections. Embryos of this stage have already been shown to be vulnerable to the induction of heart defects when exposed to alcohol (12). With the blunt end facing upward, each egg in the experimental group was injected with 40 μL of 50% ethanol solution (50% ethanol, 50% saline) into its air space using an insulin syringe. This single injection mimicked an acute exposure and the dose was based on previous published protocols as being equivalent to 4–5 standard drinks in humans (12). The ethanol dose injected into an 8.8 mL (wet volume) quail egg is equivalent to 0.179% g/dL or 40 mM (22), which is within the range of the blood alcohol content (0.08%–0.268% g/dL) (42, 43) detected after one bout of heavy alcohol consumption. Other eggs were untreated or injected with 40 μL of saline solution as vehicle controls. After injection, a small piece of tape was used to seal the hole left by the insulin needle, and injected eggs were then placed back into the incubator. After an additional 50–52 h of incubation (HH stage 19–20), embryos were dissected and placed in sterile Tyrode’s solution. The caudal portion of the embryo was then removed and the remaining embryo body with the heart intact was stained for OM imaging.
OM Imaging of Cardiac Conduction
Fresh voltage-sensitive dye solution was prepared before each experiment by mixing FluoVolt (Life Technologies, Carlsbad, CA) and PowerLoad concentrate (Life Technologies, Carlsbad, CA) into Tyrode’s solution (Sigma-Aldrich, St. Louis, MO) with manufacture-suggested concentrations (i.e. 1 μL FluoVolt and 10 μl PowerLoad per 1 ml Tyrode’s solution). The dissected embryo was stained in 300 μL of voltage-sensitive dye solution in a darkened room for at least 30 min at room temperature. After staining, the embryo was placed into the prewarmed imaging chamber under the objective of a custom-built OM system (44). The orientations of the embryos were carefully adjusted to make sure all heart samples had similar orientations, with the inflow heart tube facing toward the objective. The imaging chamber was filled with 1 mL Tyrode’s solution (Thermo Fisher Scientific) containing 10 µM of cytochalasin D (C2618_SIGMA, Sigma Aldrich) to suppress heart motion. The imaging system was built around an Axio Scope.A1 microscope with a ×5, 0.25 NA objective (Carl Zeiss Microscopy, Thornwood, NY) for imaging the quail hearts. A 0.95 mm × 0.95 mm field of view with 128 × 128 pixels was recorded by an iXon3 860 EMCCD camera (Andor Technology, South Windsor, CT). Each imaging session lasted for 2 s with a frame rate of 500 Hz. The imaging chamber was maintained at 38°C ± 0.5°C throughout the imaging process.
OCT Imaging of Heart Morphology
After OM imaging, the embryos were placed into 40 mM of KCl solution to arrest the hearts in diastole (45). The embryos were then fixed in 10% of formalin solution (Sigma Aldrich) and then cleared in formamide solution (Sigma Aldrich). The hearts were imaged using a custom-built, spectral-domain OCT system (46–48), with a light source centered at 1310 nm with a 75 nm full-width at half-maximum bandwidth. The line rate of the OCT system was 47 kHz. For each heart, a three-dimensional (3-D) volume [1,000 lines/frame, 1,000 frames/volume, total volume 2.0 (L) × 2.0 (W) × 3.4(H) mm] was recorded.
Image Data Processing
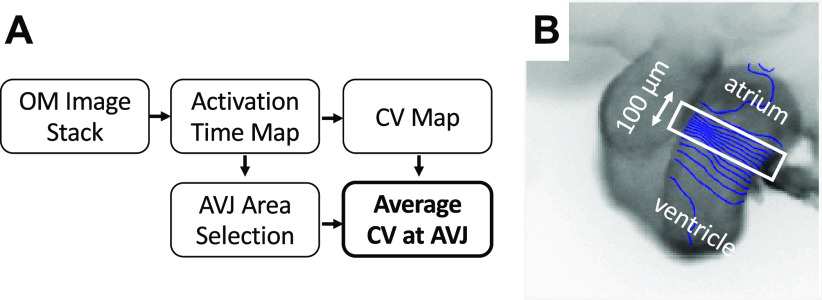
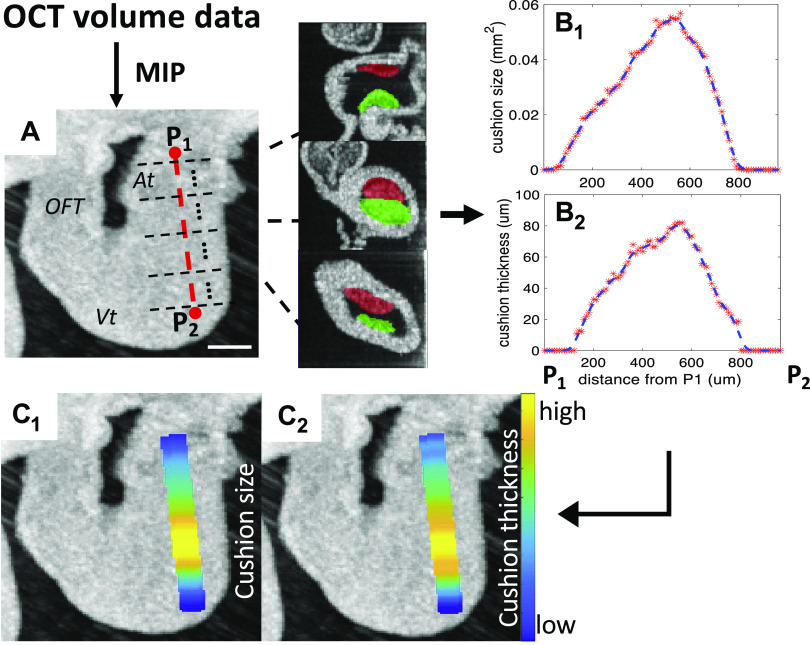
The flowchart of processing OM data is shown in Fig. 1A. The OM images were processed using our previously published method (49) via MATLAB (The MathWorks, Inc., Natick, MA) for measurements of activation time and CV. A region of AVJ with 100 µm width was manually selected at the slowest-conducting location in the conduction map image and the average CV of this region was calculated (Fig. 1B). Figure 2 demonstrates the processing of the OCT data to quantify the volume and thickness of cushions. AVJ cushions were manually segmented and measured using OCT images in Amira (FEI Visualization Sciences Group, Burlington, MA) (Fig. 2, B–C). We also calculated an averaged cushion thickness for each heart. The two surfaces (luminal and the abluminal) of each cushion were manually extracted (Fig. 2, D–E). For each point on the abluminal surface, its closest point on the luminal surface was found and the distance between them was measured as the cushion thickness at that location (Fig. 2F). The cushion thickness histogram of all points on the abluminal surfaces of the two AVJ endocardial cushions from a heart was then generated (Fig. 2G). A weighted-average thickness of this histogram was finally calculated by summing all the thickness values multiplied by its percentage for comparison with others. We also measured the size of the cushion (cross-sectional area perpendicular to the heart tube centerline) and the average cushion thickness along the centerline of the heart tube and correlated them with the CV map from the OM data to investigate their spatial relationship. The procedure is shown in Fig. 3. The 3-D OCT data was first rotated to align the heart to the same orientation as the two-dimensional (2-D) OM image. The centerline of the inflow tract was manually marked on the en face projection (Fig. 3A), which was generated by maximum intensity projection (MIP) along the direction of OCT illumination. Then a series of images perpendicular to this centerline were extracted (Fig. 3A). The endocardial cushions in these images were manually segmented. The total cushion size (Fig. 3B1) and average cushion thickness of the two cushions (Fig. 3B2) - were then computed and then mapped to the heart tube in the en face projection image (Fig. 3, C1 and C2). We also computed the CVs along the manually selected centerline of the heart tube to get a one dimensional (1-D) CV curve. Since the OM and the en face OCT projection images were aligned, the 1-D CV curve could be compared with the cushion size or thickness plot to investigate their relationships.
Figure 1.
Calculating average CV at AVJ from OM images. A: flowchart of processing an OM image stack. B: an activation time map of an HH stage 20 heart overlaid with 10 ms isochrones. The white rectangle is the manually selected area for calculating CV at AVJ. AVJ, atrioventricular junction; CV, conduction velocity; HH, Hamburger–Hamilton; OM, optical mapping.
Figure 2.
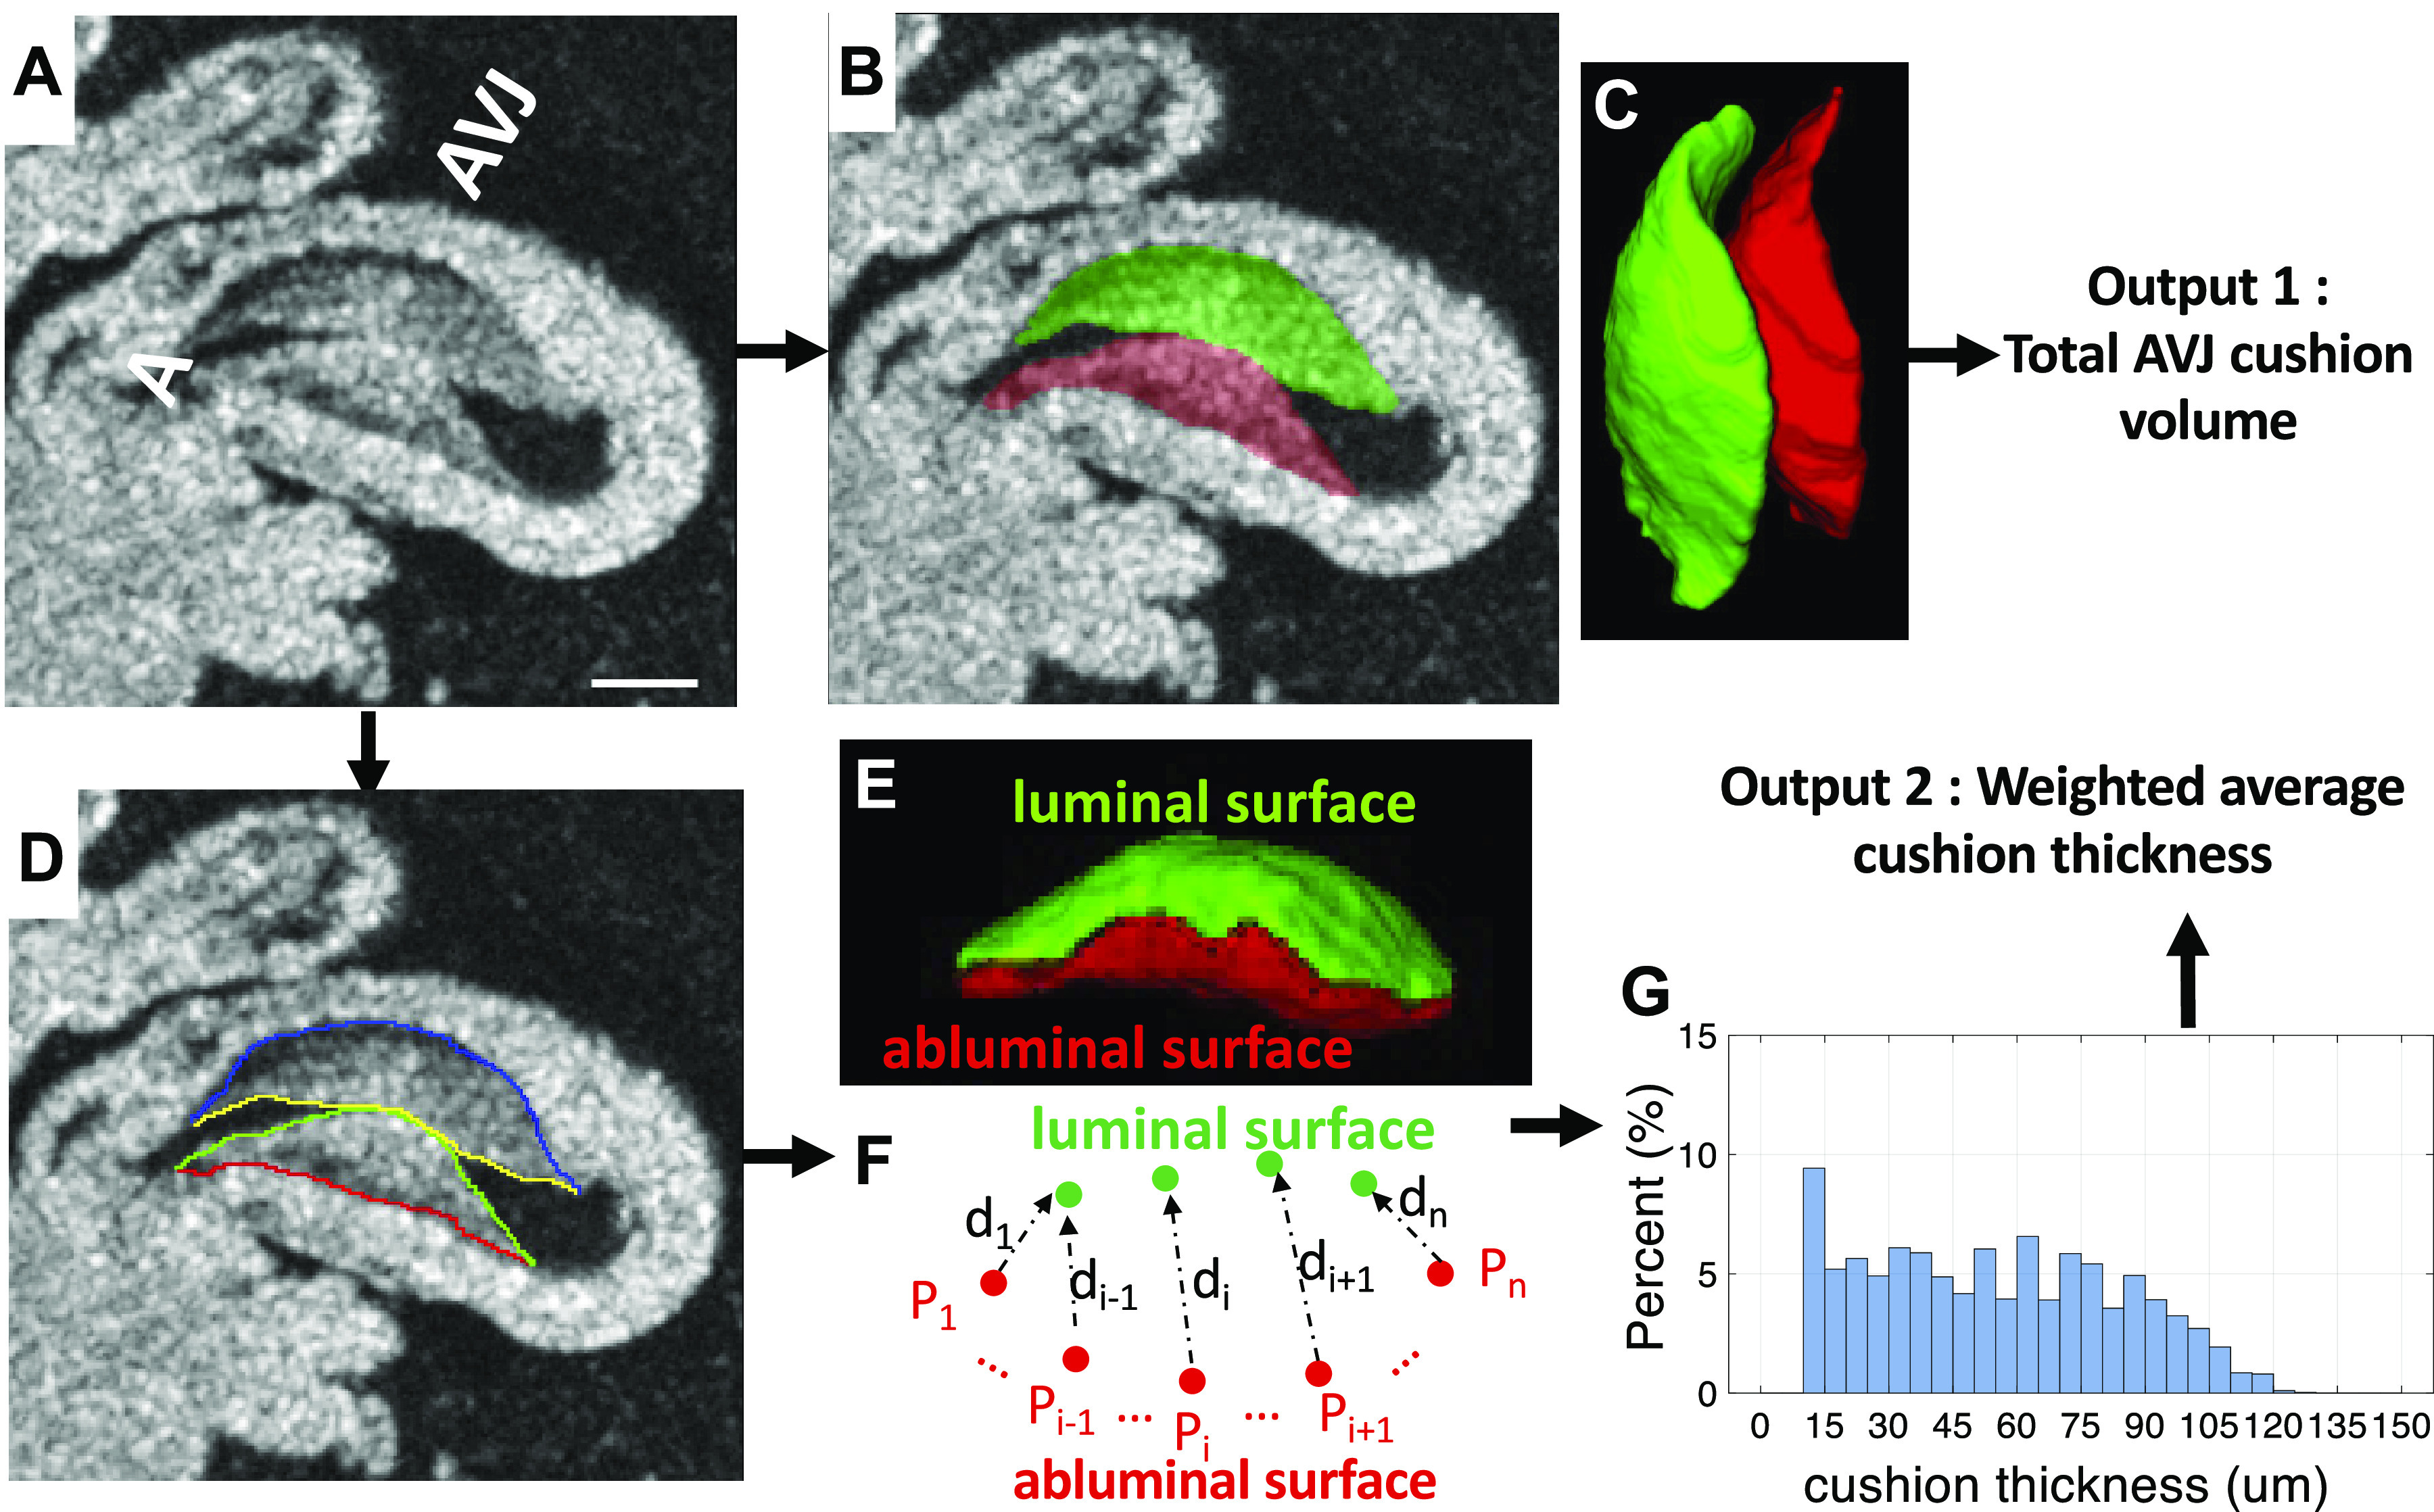
Calculating total cushion volume and average cushion thickness at the AVJ from volumetric OCT data. A: a 2-D slice from a volumetric OCT image stack. Scale bar = 200 μm. B: manual segmentation of AV superior (green) and inferior (red) cushions. C: 3-D rendering of the two AV cushions. D: the luminal and abluminal surfaces of each cushion were manually labeled. E: 3-D rendering of the luminal surface (green) and abluminal surface (red) of the inferior cushion. F: for every point on the abluminal surface Pi (1<i<n), (n is the number of points on the abluminal surface), the closest point on the luminal surface is found and the distance di between the two points is the cushion thickness at point Pi. G: the histogram of cushion thickness calculated at all points. The y-axis is the frequency of a particular cushion thickness value. A, atrium; AVJ, atrioventricular junction; OCT, optical coherence tomography; 2-D, two-dimensional; 3-D, three-dimensional; Vt, ventricle.
Figure 3.
The flowchart of calculating the cushion size and cushion thickness along the inflow heart tube. A: the OCT en face projection calculated by MIP (maximum intensity projection) along the direction of the OCT illumination. The centerline (red-dotted line) of the inflow heart tube was manually selected from the en face OCT projection. P1 and P2 are two end points of the centerline. Image planes (black-dotted lines) perpendicular to this centerline were extracted. Scale bar = 200 μm. B1: plot of the cushion cross-sectional area (mm2) along the heart tube from P1 to P2. Each red point on the curve is the size of the cushion area in each image slice. The dotted blue line is the smoothed size curve. B2: the curve of the average cushion thickness (μm) along the heart tube from P1 to P2. Each red point on the curve is the average thickness of the cushion area in each image slice. The dotted blue line is the smoothed thickness curve. C1: the en face OCT projection image overlaid by the size curve in B1. C2: The en face OCT projection image overlaid by the thickness curve in B2. At, atrium; OCT, optical coherence tomography; OFT, outflow tract; Vt, ventricle.
Statistical Analysis
We collected 10 untreated embryos, 9 saline-injected embryos, and 22 ethanol-treated embryos. The sample size of each experimental group was established based on our previous experience (15). The comparison between the three groups (ethanol-exposed and two controls) was performed with one-way ANOVA and the Tukey–Kramer post hoc test (MATLAB, The MathWorks, Inc., Natick, MA; *P < 0.05). Correlation coefficients were calculated using MATLAB.
RESULTS
Ethanol Exposure Delayed the Development of Embryos and Induced Structural Abnormality of the Body Axis
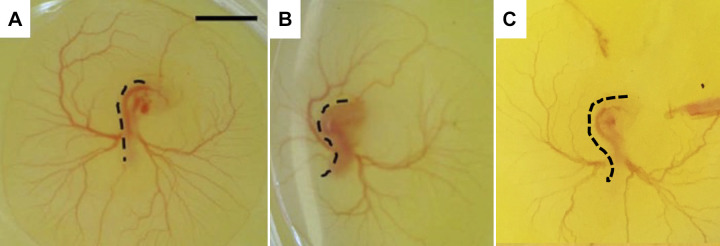
All embryos were dissected after 71–73 h of incubation at late-looping stages when endocardial cushions have formed. We collected 10 untreated embryos, 9 saline-injected embryos, and 22 ethanol-treated embryos. The embryos were staged based on their morphological characteristics such as the body curvature, the size of the vesicular allantois, the appearance of the telencephalon, and so on as determined by HH staging. All the embryos in the two control groups (untreated + saline-treated) were at HH stage 20. In the ethanol group, 14 embryos were at HH stage 20, whereas 8 embryos were at HH stage 19. As shown in Table 1, the hours of incubation of these eight younger ethanol-treated embryos were the same as, or even longer than those of control embryos. This indicated that ethanol exposure induced a delay in the development. In addition, we found six ethanol-exposed embryos developed abnormally twisted body shapes. This was consistent with our previous study (15) where ethanol exposure resulted in structural abnormalities of the body axis at early stages (Fig. 4). We noticed that almost all (5/6) twisted ethanol embryos were at the younger stage, that is, HH stage 19 (Table 1).
Table 1.
The developmental stages of the three groups of embryos
| Group | Untreated | Saline | Ethanol |
|---|---|---|---|
| Developing hours | 71–72 | 71–72 | 71–73.5 |
| HH20 | 10 | 9 | 14 |
| HH19 | 0 | 0 | 8 |
| Twisted body | 0 | 0 | 1 HH20 + 5 HH19 |
HH, Hamburger–Hamilton.
Figure 4.
Ethanol-treated embryos developed twisted body trunks. A: untreated embryo with a relatively straight trunk. Scale bar = 2 mm. B: ethanol-treated embryo with S-shaped trunk (twisted). Dashed black lines delineate the body shape of the embryo. A and B were edited from our previous study (Reprinted with permission from APS; 48). C: an ethanol-treated embryo with a twisted body found in this study.
Ethanol-Exposed Embryos Developed Smaller AV Cushions in Volume than in Controls
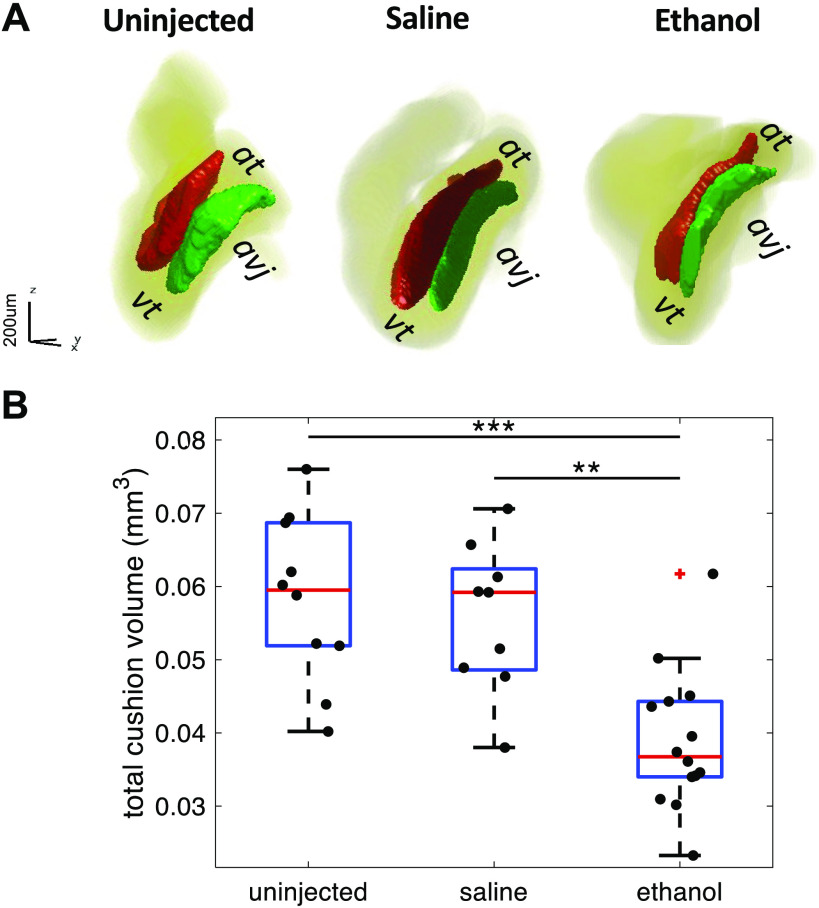
OCT was used to image the looping hearts to investigate the effects of ethanol exposure on the formation of AV cushions. The two cushions at the AVJ—the superior and inferior cushions—function as a primitive valve to physically separate the atrial and ventricle chambers for efficient blood pumping (50). Our previous study (15) showed that ethanol-exposed embryos exhibited increased regurgitant flow and developed smaller AV cushions. In this study, the decreased size of AV cushions in ethanol-treated embryos was also demonstrated. The total volume of superior and inferior cushions of each heart was calculated and the volumes of the three groups were compared. Although several HH stage 19 embryos were in the ethanol group, all embryos in the two control groups were at HH stage 20. Since the developmental stage is a contributor to cushion size and conduction velocity, it is unfair to compare the three groups of embryos when all different HH stages are included. Therefore, only embryos at HH stage 20 were selected for group comparison. At HH stage 20, ethanol-treated embryos developed smaller cushions (0.039 ± 0.010 mm3) than both the untreated control (0.058 ± 0.011 mm3) and the saline-treated control (0.056 ± 0.010 mm3) (Fig. 5).
Figure 5.
Ethanol-treated embryos develop smaller AVJ cushions than the untreated and saline-treated embryos at HH stage 20. A: 3-D rendering of AVJ cushions of three representative embryonic hearts from untreated, saline-treated, and ethanol-treated groups, respectively. B: quantification of endocardial cushion volume among the three treatment groups: untreated (n = 10), saline-treated (n = 9), and ethanol-treated (n = 14). n, number of embryos. The ethanol group developed smaller cushions in volume compared with controls (**P < 0.01, ***P < 0.001). The comparison between the three groups was performed with one-way ANOVA and the Tukey–Kramer post hoc test. At, atrium; AVJ, atrioventricular junction; HH, Hamburger–Hamilton; Vt, ventricle.
AV Cushions of Ethanol-Exposed Embryos were Less Thick than Controls
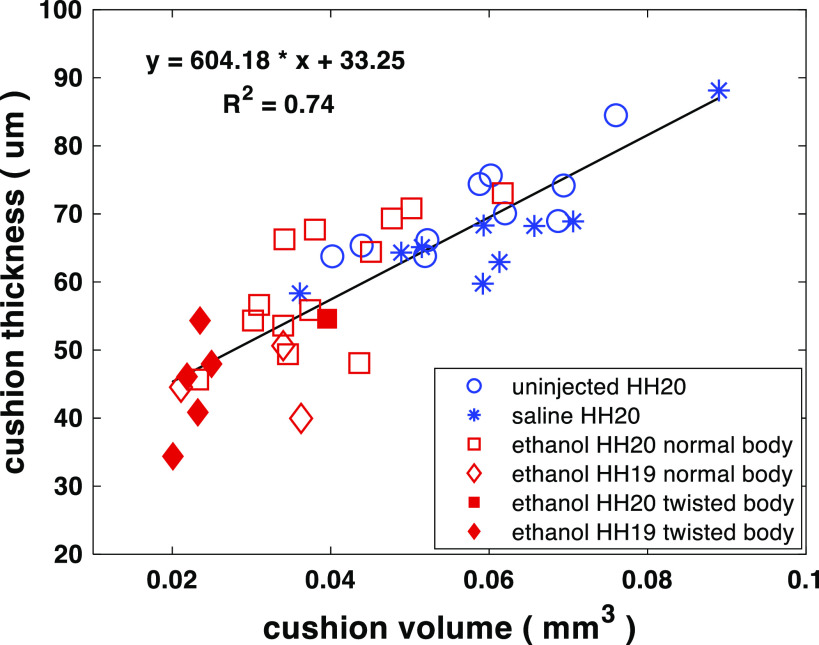
It has been proposed by a previous study (41) that the separation of the endothelial cells from the myocardium caused by cardiac jelly expansion is required for the conduction delay at AVJ in looping hearts. When this separation was eliminated by removing the cardiac jelly, the CV at the AVJ increased. In addition, implanting AVJ myocardial cells into various regions within the endocardial cushion changed the Cx40 expression of these cells, dependent on their distance from the endocardium. Cx40 expression increased as the distance from the endocardium was reduced. It seemed that the distance between the endocardium and the myocardium, that is, the cushion thickness, might affect the CV at AVJ. To test this hypothesis and to investigate the effect of ethanol exposure on cushion thickness, we computed a thickness histogram from each heart by calculating a point-to-point distance between the endocardium and the myocardium along the abluminal surface of cushions (Fig. 6). The thickness distribution of embryo hearts with thin AV cushions was narrower and concentrated on the left (thin) side of the plot (Fig. 6A3), whereas the histogram distribution of embryos with thick cushions was wider (Fig. 6, A1 and A2). Compared with the untreated (70.68 ± 6.57 μm) and the saline group (66.07 ± 3.25 μm), the ethanol-exposed embryos developed thinner cushions (57.49 ± 8.28 μm) at the AVJ (Fig. 6B). As expected, the cushion thickness was linearly correlated with cushion volume (Fig. 7). In addition, ethanol-treated embryos with twisted bodies were grouped together at the bottom left corner representing the smallest and thinnest cushions. This association between the cushion size and embryo morphology was consistent with our previous study (15).
Figure 6.
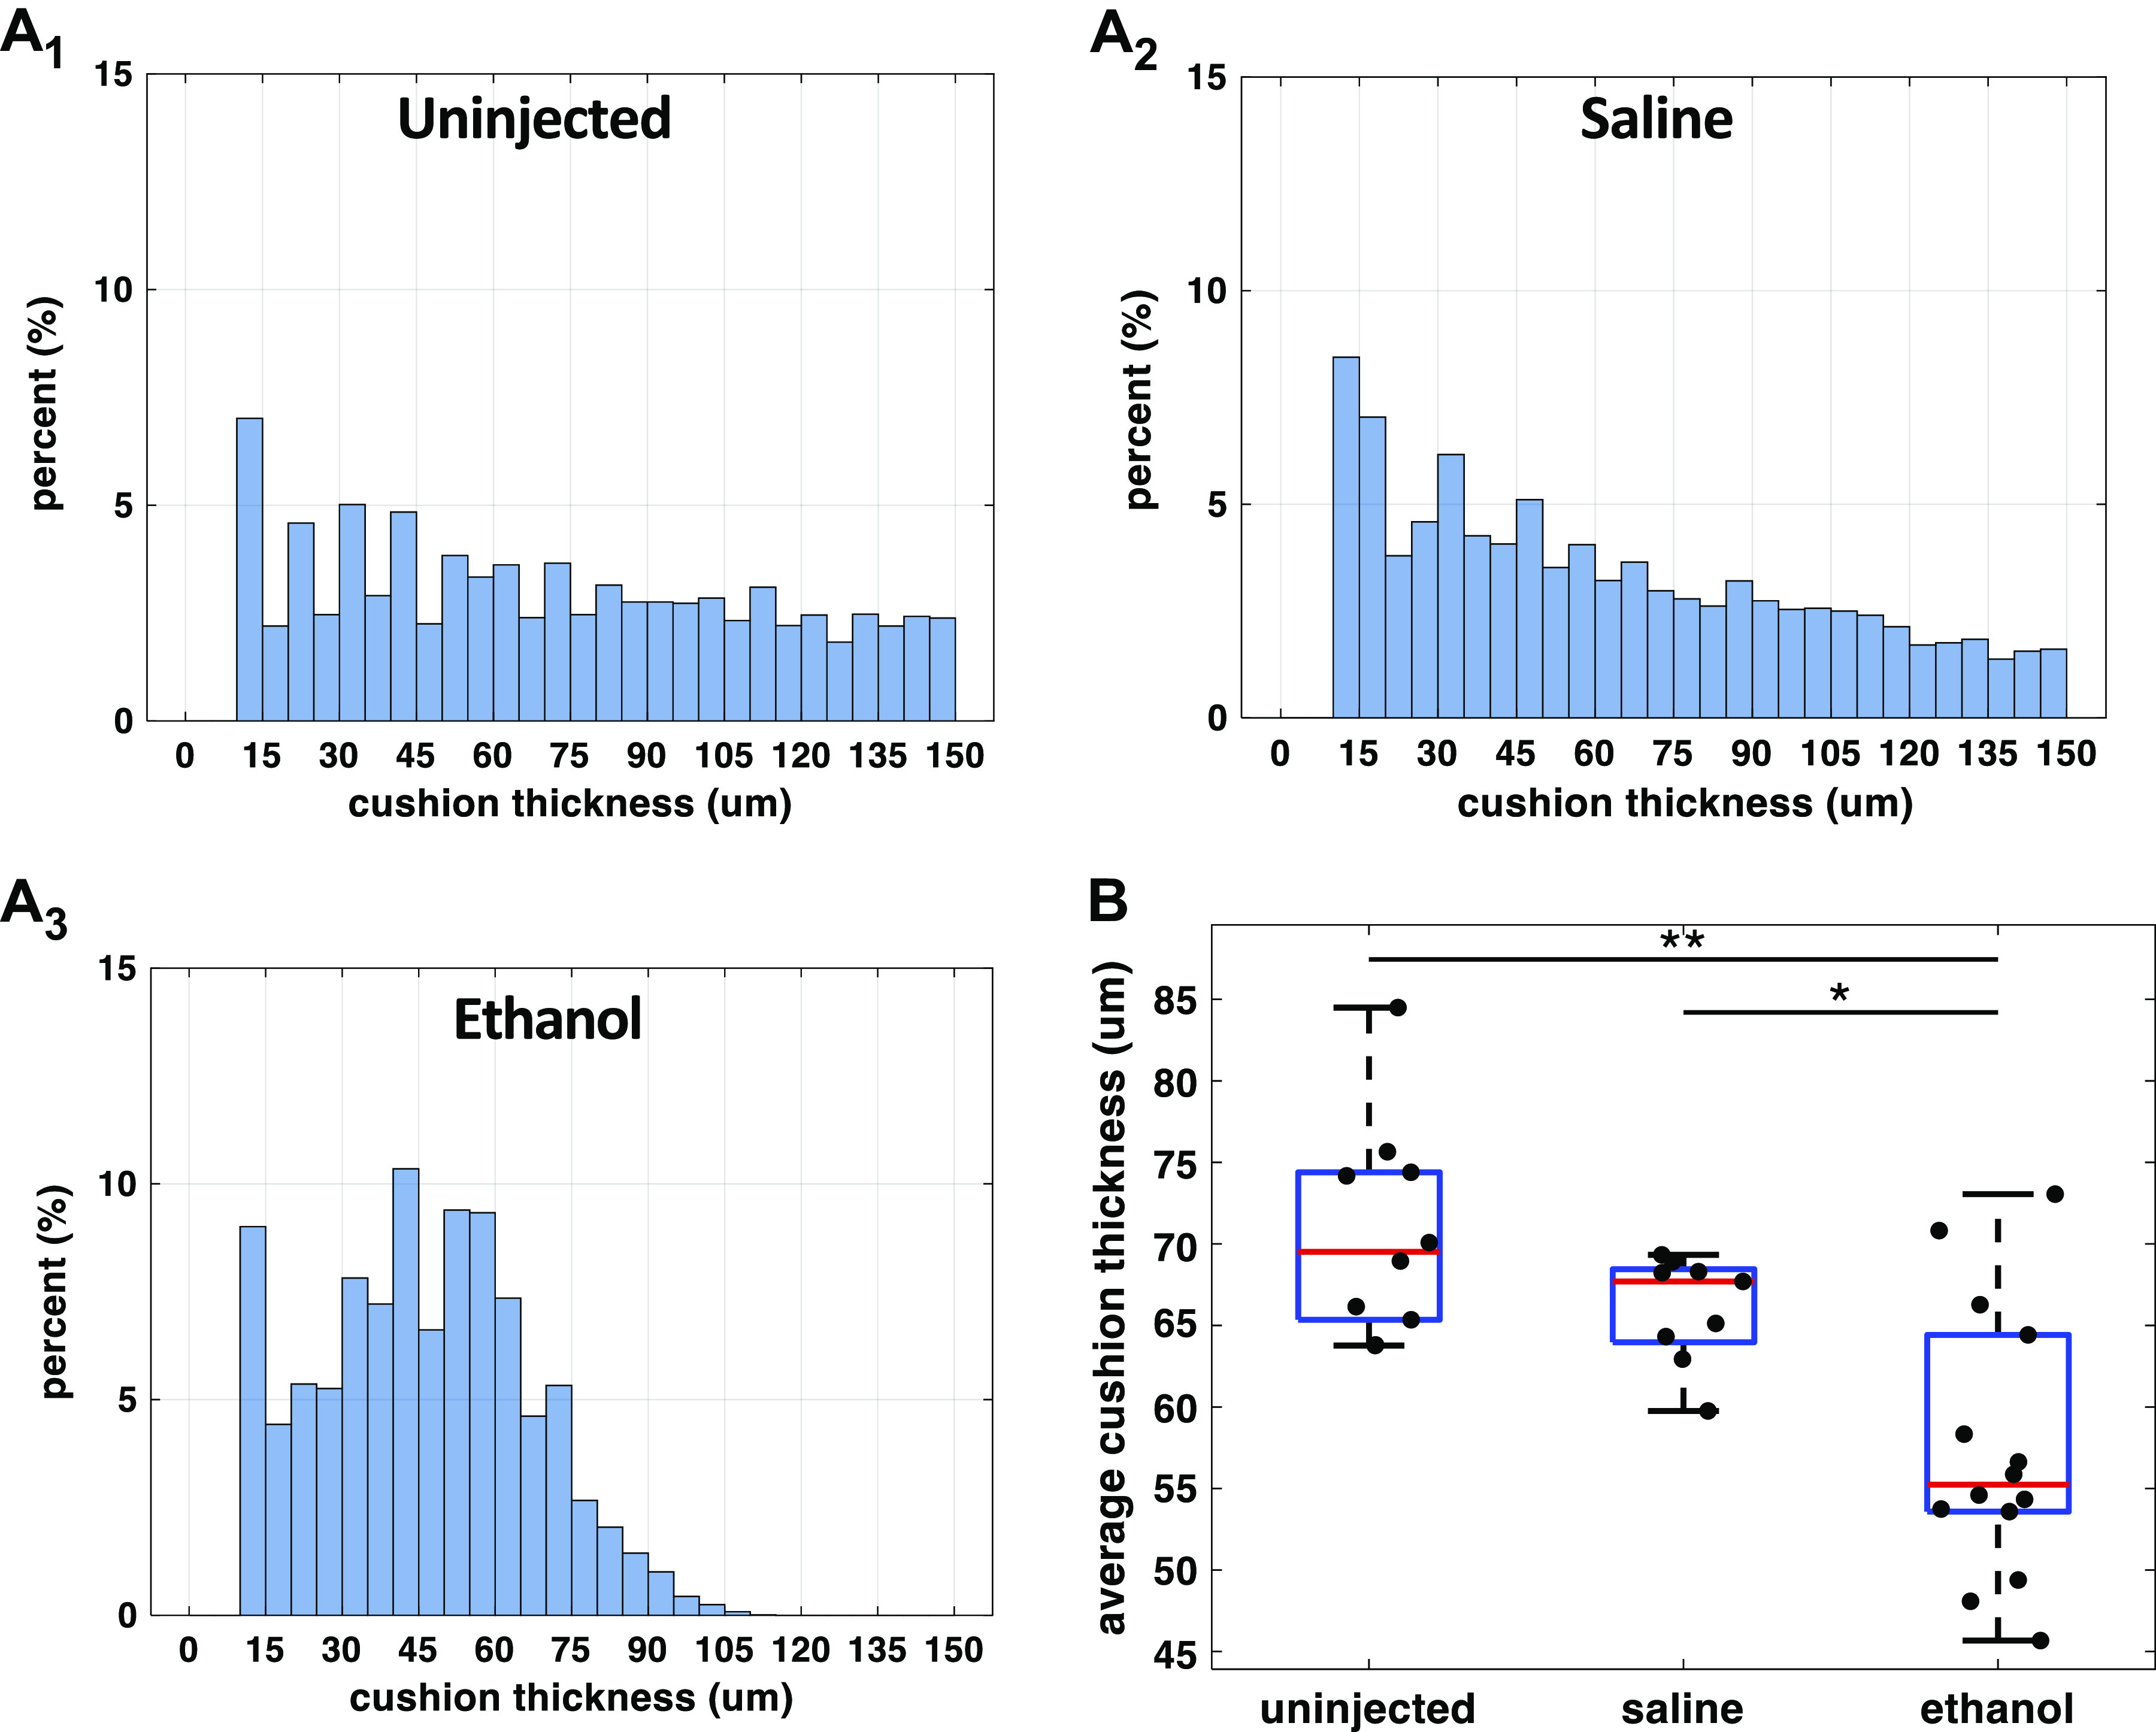
Ethanol exposure reduced endocardial AVJ cushion thickness at HH stage 20. A1–A3: cushion thickness histograms from three representative embryos: an untreated, a saline-treated, and an ethanol-treated embryo. At every point on the heart’s abluminal cushion surface, its distance to the luminal cushion surface was calculated as the cushion thickness at that location. From each heart, a range of cushion thickness values was generated. The y-axis of the histogram is the percentage of a specific thickness value in all measurements from one heart. B: quantification of endocardial cushion thickness among the three treatment groups: untreated (n = 10), saline-treated (n = 9), and ethanol-treated groups (n = 14). n, number of embryos. The ethanol group developed thinner cushions compared with controls (*P < 0.05, **P < 0.01). The comparison between the three groups was performed with one-way ANOVA and the Tukey–Kramer post hoc test. AVJ, atrioventricular junction; HH, Hamburger–Hamilton.
Figure 7.
Scatter plot of average cushion thickness vs. total cushion volume for ethanol-exposed, saline-treated, and uninjected embryos. Cushion thickness is linearly correlated with total cushion volume. The embryos with twisted bodies from the ethanol group clustered at the left bottom corner representing the smallest and thinnest cushions. Numbers of embryos in the three groups: untreated (n = 10 at HH stage 20), saline-treated (n = 9 at HH stage 20), and ethanol-treated (n = 14 at HH stage 20; n = 8 at HH stage 19). n, number of embryos. HH, Hamburger–Hamilton.
Ethanol Exposure Increased CV at AVJ
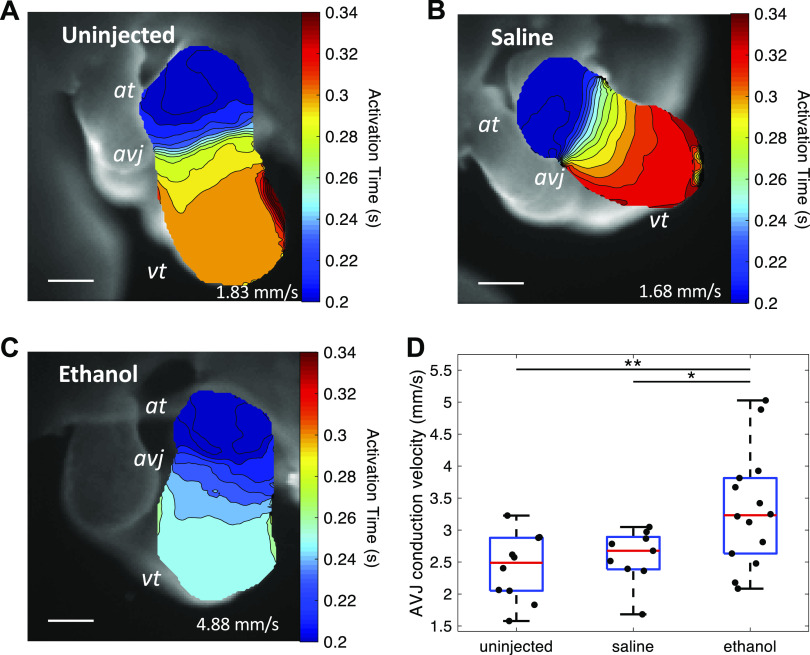
During normal heart development at looping stages, the electrical impulse propagates rapidly through the atrium and ventricle but is slowed at the AVJ (33). This AVJ conduction delay ensures that the atrium activates and contracts before the ventricle. To investigate the effect of ethanol exposure on the development of cardiac electrophysiology at AVJ, the cardiac conduction pattern of each heart was imaged with OM microscopy. Figure 8, A–C shows the activation time maps of representative hearts from each group. These maps were overlaid by isochrones with a 10-ms time interval between adjacent lines. The ethanol-treated embryo has the fewest lines in the AVJ area, and thus the fastest conduction. The average CV of the AVJ area of each heart was then computed. The ethanol-treated group developed faster conduction at the AVJ (3.32 ± 0.89 mm/s) compared with the two control groups (uninjected: 2.41 ± 0.52 mm/s, saline: 2.59 ± 0.42 mm/s) (Fig. 8D).
Figure 8.
Ethanol-treated embryos developed faster AVJ conduction at HH stage 20. A–C: activation time maps of embryonic hearts from three groups: untreated, saline-treated, and ethanol treated. Scale bar = 200 μm. D: quantification of conduction velocity at AVJ among the three treatment groups: untreated (n = 10), saline-treated (n = 9), and ethanol-treated groups (n = 14). n, number of embryos. The ethanol group developed faster conduction at AVJ compared with controls (*P < 0.05, **P < 0.01). The comparison between the three groups was performed with one-way ANOVA and the Tukey–Kramer post hoc test. At, atrium; AVJ, atrioventricular junction; HH, Hamburger–Hamilton; Vt, ventricle.
Links between Cushion Size and CV at AVJ
At looping stages, the cardiac jelly between the endocardium and myocardium at the AVJ expands to create endocardial cushions. Meanwhile, the conduction pattern along the heart tube differentiates with decreased conduction velocity at the AVC and increased conduction velocity at the ventricle and atrium. A previous study (41) demonstrated that the separation between the endocardium and myocardium by the endocardial cushions was required for the conduction delay at the AVJ. When this separation was lost by removing the cardiac jelly, the conduction at the AVJ failed to decrease as it normally would. We tested whether the increased AVJ CV of ethanol-exposed embryos was correlated with the observed decreased cushion volume and thickness. The scatter plots of individual AVJ CV versus cushion volume and cushion thickness are shown in Fig. 9A and Fig. 9B, respectively. As shown, there was no significant linear relationship between the cushion size and CV at this stage. We then further investigated the spatial relationship between the cushion size and the CV along the heart tube. For an individual heart, we calculated the size and thickness of cushions as well as the CV along its inflow heart tube. As shown in Fig. 10, the region with the slowest conduction did not match the region of the thickest or largest cushion. Interestingly, the region with the slowest conduction was closer to the atrium, whereas the region of the largest cushion was closer to the ventricle. We analyzed six hearts this way in total (2 uninjected, 2 saline-injected, and 2 ethanol-injected). All examined hearts consistently showed this pattern and the distance between location of slowest conduction and the thickest cushion location varied from 192 μm to 363 μm (uninjected: 192 μm and 240 μm; saline: 162 μm and 276 μm; ethanol: 270 μm and 363 μm). This 2-D measurement was potentially affected by the heart size and heart orientation.
Figure 9.
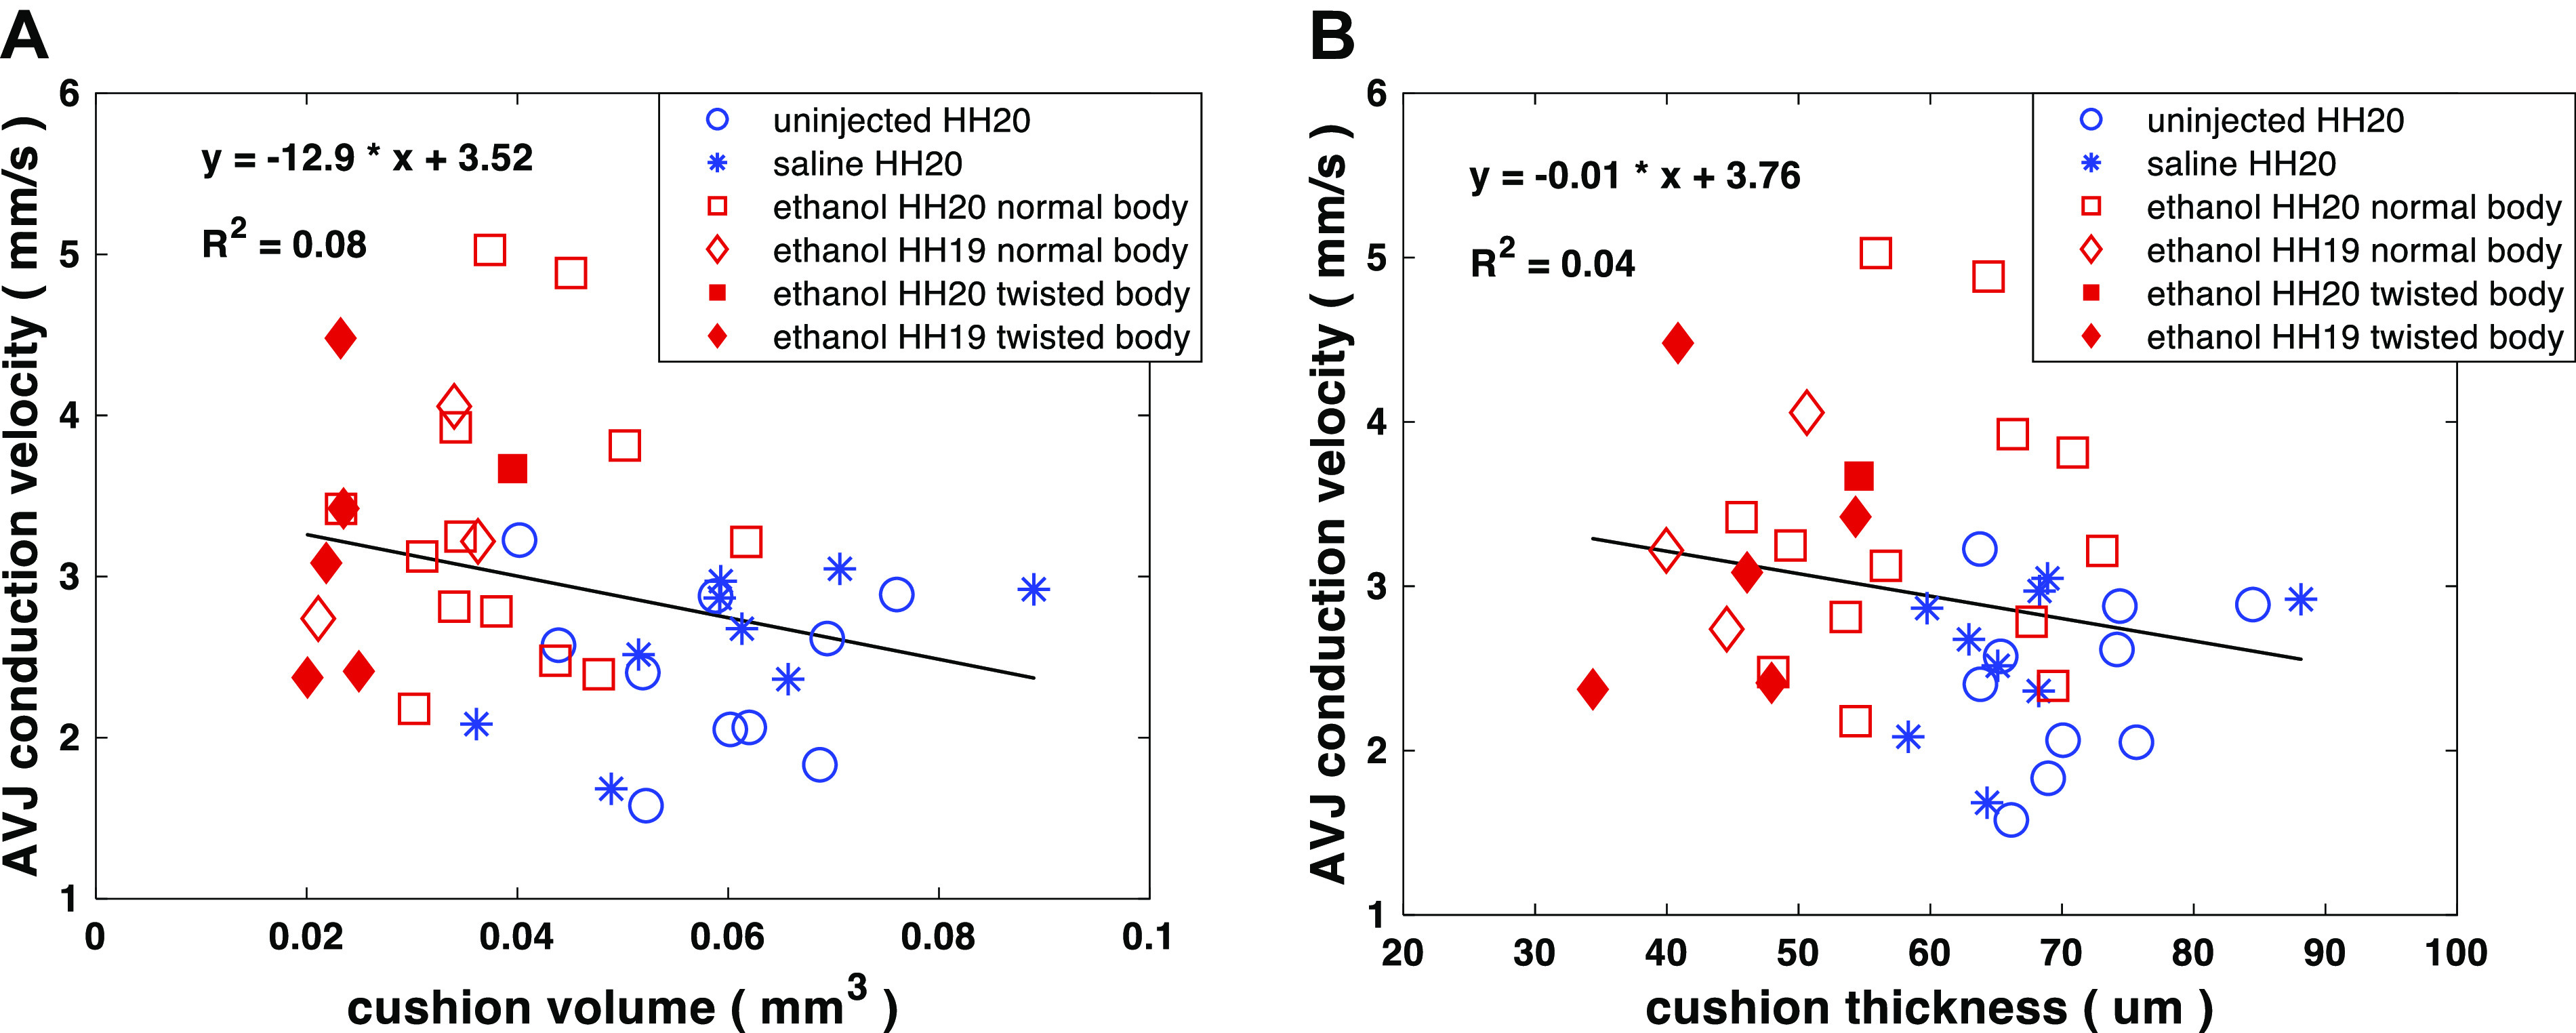
Scatter plots of AVJ conduction velocity (CV) vs. total cushion volume (A) and conduction velocity vs. cushion thickness (B) for ethanol-exposed, saline-treated, and uninjected embryos. There was no obvious linear relationship between CV and the cushion size (volume and thickness) at this stage. Number of embryos in the three groups: untreated (n = 10 at HH stage 20), saline-treated (n = 9 at HH stage 20), and ethanol-treated (n = 14 at HH stage 20; n = 8 at HH stage 19). n, number of embryos. AVJ, atrioventricular junction; HH, Hamburger–Hamilton.
Figure 10.
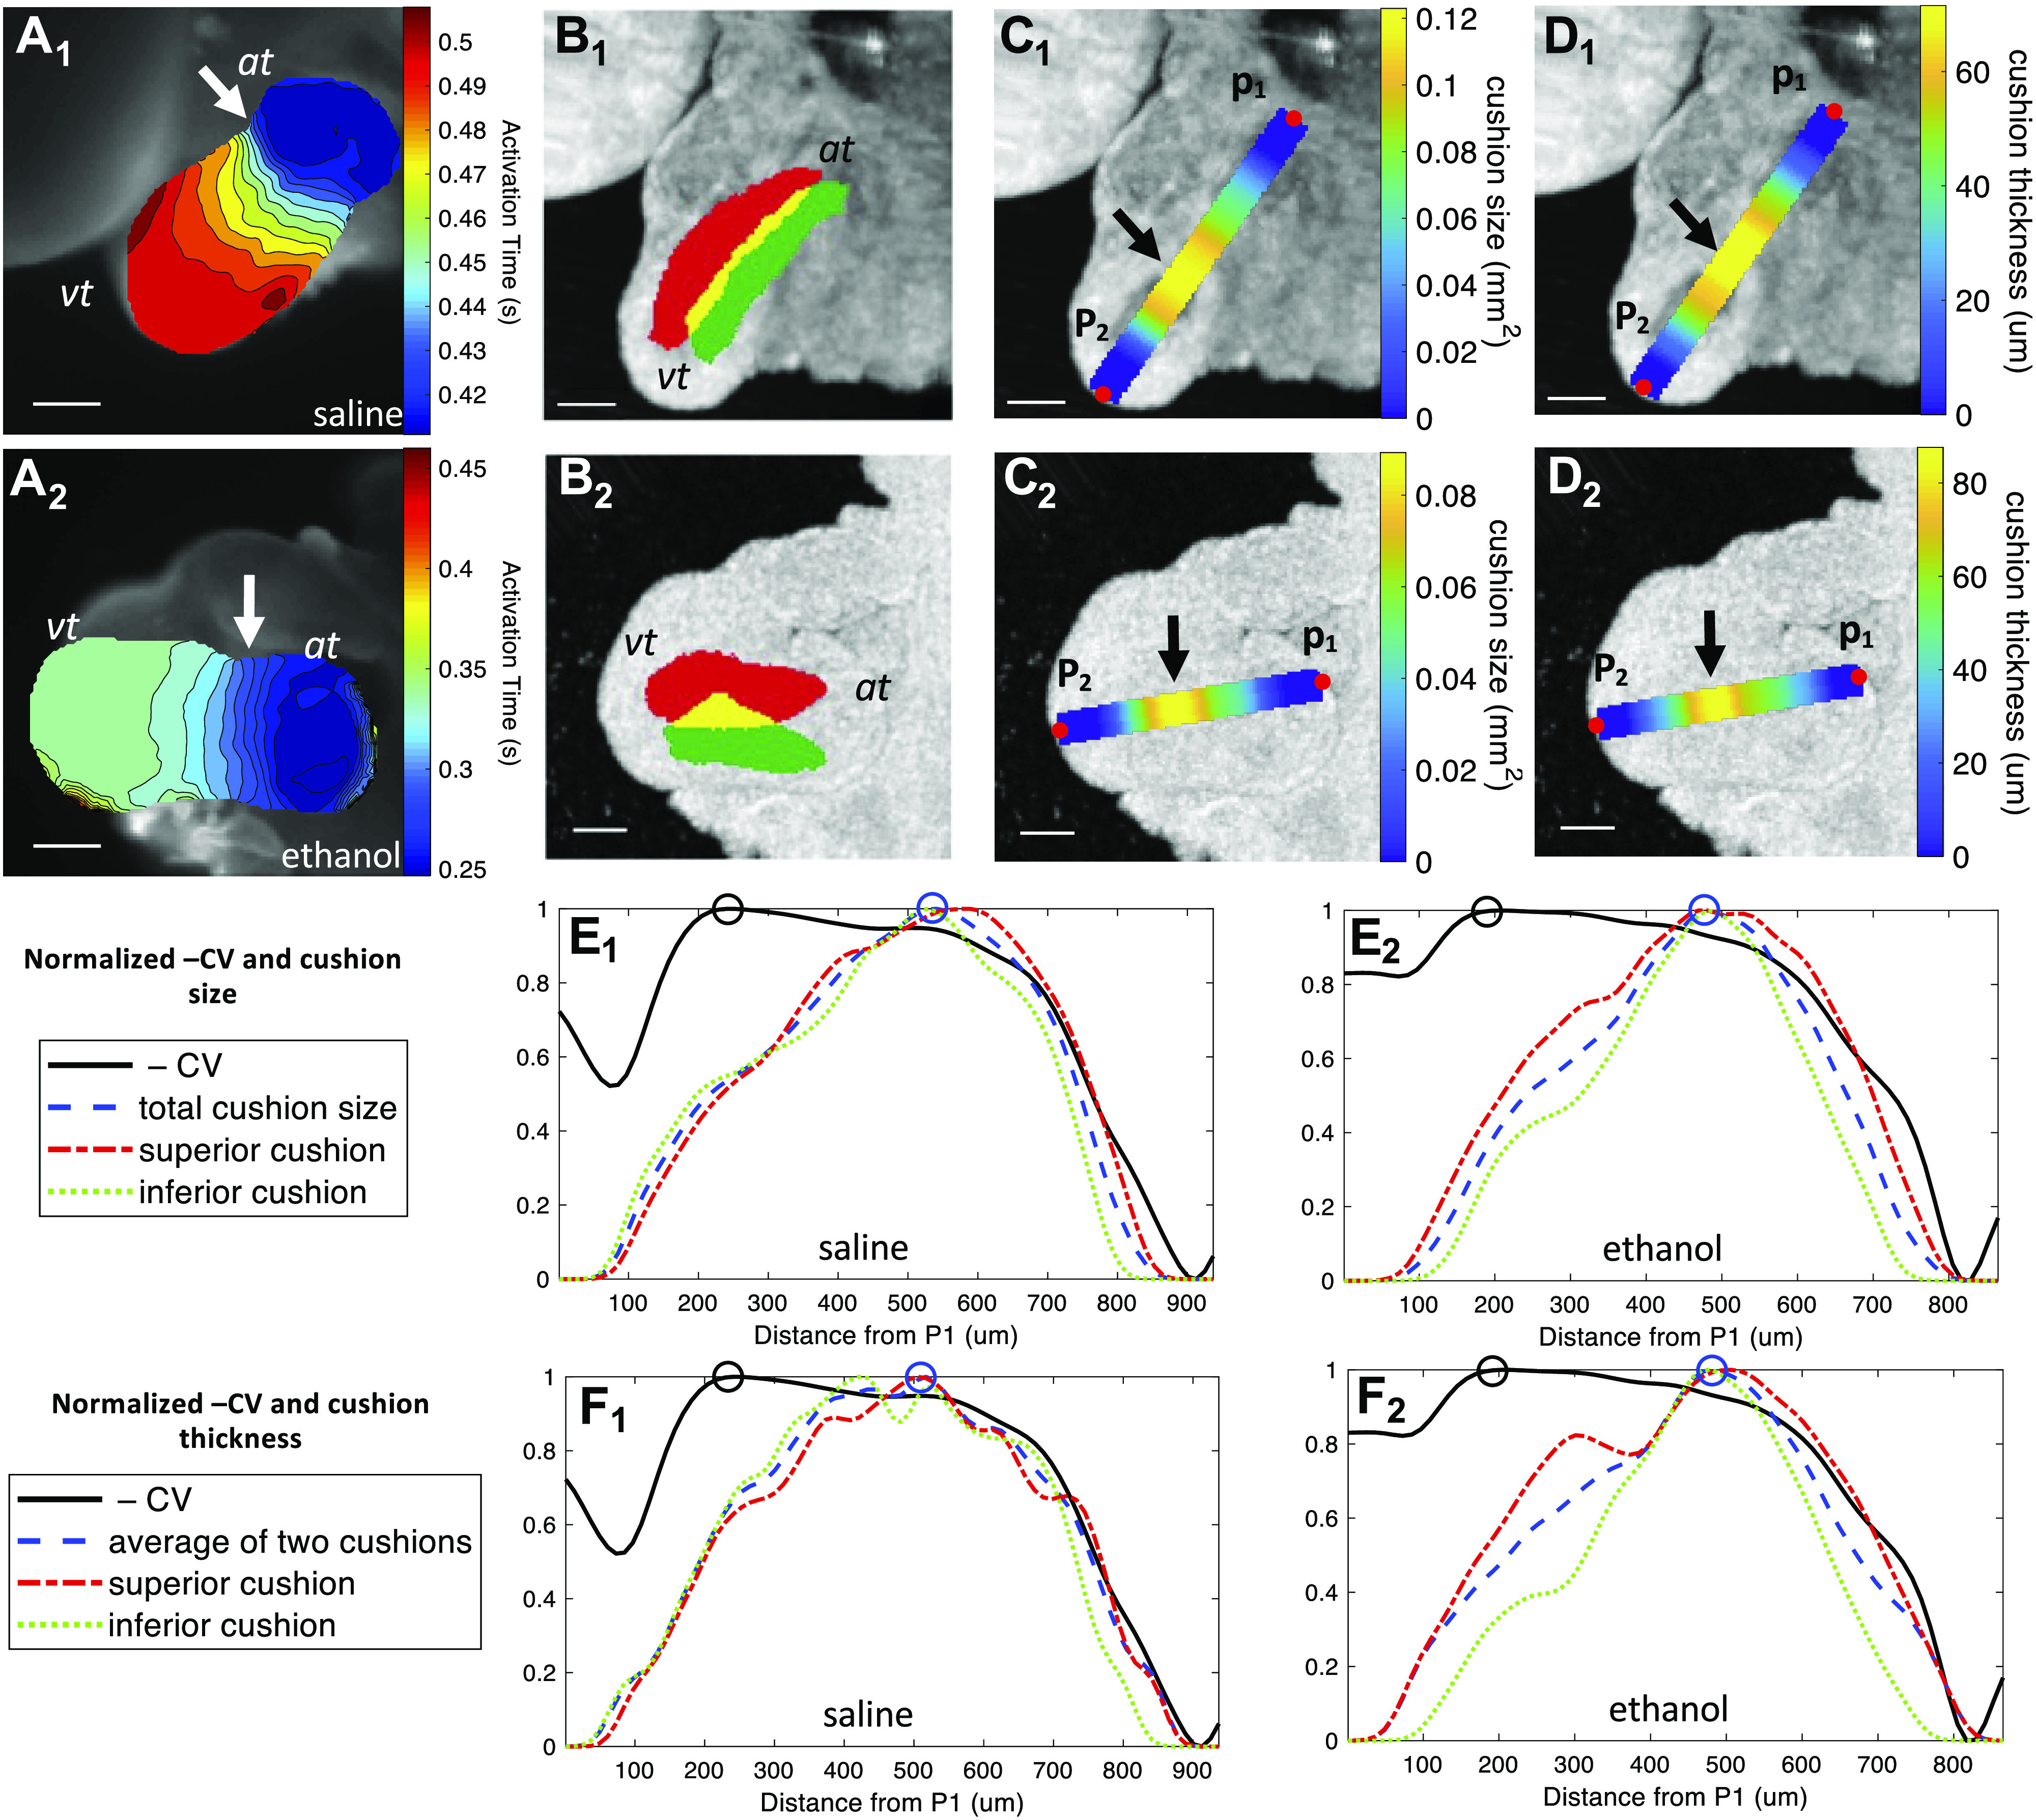
The area with slowest conduction at the AVJ did not match the region with largest cushion. A1 and A2: activation time maps of two embryonic hearts at HH stage 20 from the saline and ethanol groups, respectively. The isochrone time interval is 0.01 s. The arrows point to the areas with slowest conduction. Scale bar = 200 μm. B1 and B2: the en face OCT projections of the two hearts overlaid by labeled cushions. The red color is the superior AVJ cushion, whereas the green color labels the inferior AVJ cushion. The yellow color is the overlap between the two cushions. Scale bar = 200 μm. C1 and C2: the en face OCT projections of the two hearts overlaid by the cushion-size curve calculated along the centerline of the heart tube from point P1 to point P2 along the direction of conduction. The arrows indicate the areas with the largest cushion size. D1 and D2: the en face OCT projections of the two hearts overlaid by the cushion thickness curve calculated along the centerline of the heart tube from point P1 to point P2. The arrows indicate the areas with the thickest cushions. E1: the normalized CV and cushion-size curves of the saline heart (same as the heart in A1–D1) calculated from point P1 to point P2. E2: the normalized CV and cushion size curves of the ethanol heart (same as the heart in A2–D2) calculated from point P1 to point P2. F1: the CV and cushion thickness curves of the saline heart calculated from point P1 to point P2. F2: the CV and cushion thickness curves of the ethanol heart calculated from point P1 to point P2. The CV was inverted and all measurements were normalized into the range [0,1] for ready comparison. The black circle represents the slowest conduction. The blue circle represents the largest cushion size in area (E1 and E2) or thickness (F1 and F2). At, atrium; AVJ, atrioventricular junction; CV, conduction velocity; HH, Hamburger–Hamilton; OCT, optical coherence tomography; Vt, ventricle.
DISCUSSION
Abnormalities of cardiac electrophysiology during embryonic development usually associate with congenital heart diseases (51–53) and include Wolff–Parkinson White syndrome which can cause sudden death if left untreated (54, 55), and congenital heart block, which has high mortality and requires an early diagnosis for therapy (56, 57). Although many studies have focused on the effects of ethanol exposure on the development of heart morphology and cardiac hemodynamics (11, 12, 14–23, 48), none have investigated the impact of ethanol exposure on the early conduction system. To fill this gap, this study investigated whether ethanol exposure would alter the conduction pattern at the AVJ during looping heart stages after the formation of endocardial cushions and the differentiation of the conduction pattern. A previous study (41) demonstrated that the formation of endocardial cushions was required for patterning the conduction delay at the AVJ. The normal, slow conduction at the AVJ ensures the completion of the atrial contraction before the initiation of the ventricular contraction for efficient blood pumping. Our previous studies showed that ethanol exposure reduced the AVJ cushion size (15). In this study, we aimed to investigate the effect of ethanol exposure on AVJ conduction using OM and whether this effect was related to the reduced cushion size.
Our results showed that ethanol treatment at gastrulation stages resulted in a delay in embryo development. After 71 h of development, 8 out of 21 ethanol-treated embryos were at HH stage 19, whereas all control embryos were at HH stage 20. This kind of developmental delay induced by ethanol was also found in zebrafish (16). Interestingly, in our study, five out of eight HH stage 19 (delayed) ethanol embryos showed a twisted body axis, suggesting that the developmental delay may be linked to the structural defects in the bending and flexure of the trunk. However, the causal relationship between the body defects and the developmental delay, or the interplay between the two, remains unclear.
The ethanol-exposed group developed smaller cushions than the two control groups (Fig. 5). The reduced cushion volume in ethanol-exposed embryos was consistent with the results of our previous study (15). In addition, as shown in Fig. 6, the AVJ cushions of ethanol-treated embryos were thinner compared with the two control groups.
The ethanol exposed-embryos also exhibited faster AVJ conduction compared with controls (Fig. 8). This indicated that ethanol exposure at the gastrulation stage would impair the AVJ conduction delay in very early looping hearts. This combination of smaller cushions and abnormally fast conduction at the AVJ may explain the increase in retrograde flow at the AVJ that we observed in previous studies (15, 20–22, 58–60). The smaller cushions may not appose as tightly and the fast conduction may result in the ventricle contracting prematurely without the appropriate timed delay at the AVJ. Defects in the cardiac conduction system are thought to contribute to development of CHDs by altering patterns of myocardial contraction, in turn, affecting blood flow and the hemodynamics of the heart (61–64). Our previous study has indicated that quail embryos exposed to ethanol at an early stage exhibited an increased retrograde blood flow without affecting the heart rate (15). Because cardiac conduction and hemodynamics are interrelated, the abnormal hemodynamics caused by ethanol exposure might be associated with the altered conduction observed in this study. However, the regulatory pathways connecting them are poorly understood. Therefore, future investigation of the relationship between the AV conduction velocity and the retrograde blood flow of ethanol-exposed embryos is warranted.
We analyzed the correlation between cushion size and AVJ CV to investigate whether the altered conduction pattern in ethanol-treated embryos was caused by their abnormally small cushions, because cushions at the AVJ were demonstrated to be essential for patterning the AVJ conduction delay (41). However, the low R2 value indicated that there was no strict linear correlation between AVJ conduction velocity and endocardial cushion size at this stage (Fig. 9). This result seems to be different from the conclusion of another study (41) that decreasing the distance between the myocardium and endocardium would increase AVJ CV. However, in that study (41), the cardiac jelly between the endocardium and myocardium of the heart was digested by injecting hyaluronidase into the pericardial space around the embryo hearts. This was a much more drastic cushion removal compared with ethanol exposure: in our study, the ethanol-treated embryos still developed endocardial cushions, although smaller in volume and thickness, and thus retained a distance between the myocardium and endocardium. In addition, one factor, cushion thickness, is unlikely to be the only determinant of AVJ CV. For example, if we consider Et-1 signaling alone, it can be affected at many steps from Et-1 transcription, Et-1 processing, to the ability of the activated Et-1 to percolate through the endocardial cushion matrix (65–67).
If we consider other factors, Bmp2 and its downstream targets Tbx2 and Tbx3 have been found to play a significant role in delaying the conduction at the AVJ by downregulating the expression of Cx40 (34–40). Moreover, cardiac hemodynamics may also play a role in patterning the cardiac conduction of the looping heart. Endocardial cells at the AVJ encounter much higher shear stress than those cells lining the chambers, because of the narrower lumen space caused by the expanded cardiac jelly (68). A study found that high laminar shear stress would reduce Et-1 expression in endothelial cells (HUVECs in vitro) (67). Therefore, the high shear stress encountered by the AVJ endocardial cells may also contribute to the delayed AVJ conduction by suppressing the Et-1 expression in these cells.
To further investigate the relationship between the cushion morphology and conduction velocity, we calculated the cushion size, cushion thickness and CV along the heart tube. As shown in Fig. 10, in all hearts examined, the myocardial region with slowest conduction velocity was not the location of the thickest cushion. The atrial side of the AVJ exhibited the slowest conduction but smaller and thinner cushions than on the ventricular side of the AVJ. Why the looping heart develops this cushion size and conduction velocity pattern at the AVJ is not known. Future investigations that follow the longitudinal timeline and the many pathways and networks involved in AVJ development superimposed on its structure, hemodynamics, and CV may elucidate why different properties emerge within different segments of the AVJ and why they might be critical for the next steps in its differentiation. This improved understanding of heart development may potentially be valuable toward efforts to develop engineered cardiac conduction tissues as treatment for diseased or damaged hearts (68–70). Our previous studies have demonstrated that supplementing folic acid (20), betaine (22), or glutathione (21) could prevent structural and functional heart defects induced by prenatal ethanol exposure, so future research will investigate whether these compounds may also rescue the altered conduction found in this study. This could potentially guide clinical strategies for the prevention of congenital heart defects associated with fetal alcohol syndrome.
GRANTS
This work was supported by the National Institutes of Health Grants R01HL126747 and R01EY028667.
DISCLOSURES
No conflicts of interest, financial or otherwise, are declared by the authors.
AUTHOR CONTRIBUTIONS
M.W.J., M.W., and A.M.R. conceived and designed research; S.L. performed experiments; S.L. analyzed data; S.L. interpreted results of experiments; S.L. prepared figures; S.L. drafted manuscript; M.W.J., M.W., S.M.F., and A.M.R. edited and revised manuscript; S.L., M.W.J., M.W., S.M.F., and A.M.R. approved final version of manuscript.
ACKNOWLEDGMENTS
We thank Yehe Liu for valuable advice on optical clearing and OCT imaging.
REFERENCES
- 1.Riley EP, Infante MA, Warren KR. Fetal alcohol spectrum disorders: an overview. Neuropsychol Rev 21: 73–80, 2011. doi: 10.1007/s11065-011-9166-x. [DOI] [PMC free article] [PubMed] [Google Scholar]
- 2.Jones KL. The effects of alcohol on fetal development. Birth Defects Res C Embryo Today 93: 3–11, 2011. doi: 10.1002/bdrc.20200. [DOI] [PubMed] [Google Scholar]
- 3.Chernoff GF. The fetal alcohol syndrome in mice: an animal model. Teratology 15: 223–229, 1977. doi: 10.1002/tera.1420150303. [DOI] [PubMed] [Google Scholar]
- 4.Clarren SK, Smith DW. The fetal alcohol syndrome. N Engl J Med 298: 1063–1067, 1978. doi: 10.1056/NEJM197805112981906. [DOI] [PubMed] [Google Scholar]
- 5.Warner RH, Rosett HL. The effects of drinking on offspring. an historical survey of the American and British literature. J Stud Alcohol 36: 1395–1420, 1975. doi: 10.15288/jsa.1975.36.1395. [DOI] [PubMed] [Google Scholar]
- 6.Denny CH, Acero CS, Naimi TS, Kim SY. Consumption of alcohol beverages and binge drinking among pregnant women aged 18-44 years - United States, 2015-2017. MMWR Morb Mortal Wkly Rep 68: 365–368, 2019. doi: 10.15585/mmwr.mm6816a1. [DOI] [PMC free article] [PubMed] [Google Scholar]
- 7.May PA, Chambers CD, Kalberg WO, Zellner J, Feldman H, Buckley D, Kopald D, Hasken JM, Xu R, Honerkamp-Smith G, Taras H, Manning MA, Robinson LK, Adam MP, Abdul-Rahman O, Vaux K, Jewett T, Elliott AJ, Kable JA, Akshoomoff N, Daniel F, Arroyo JA, Hereld D, Riley EP, Charness ME, Coles CD, Warren KR, Jones KL, Hoyme HE. Prevalence of fetal alcohol spectrum disorders in 4 US communities. J Am Med Assoc 319: 474–482, 2018. doi: 10.1001/jama.2017.21896. [DOI] [PMC free article] [PubMed] [Google Scholar]
- 8.Burd L, Deal E, Rios R, Adickes E, Wynne J, Klug MG. Congenital heart defects and fetal alcohol spectrum disorders. Congenit Heart Dis 2: 250–255, 2007. doi: 10.1111/j.1747-0803.2007.00105.x. [DOI] [PubMed] [Google Scholar]
- 9.Loser H, Majewski F. Type and frequency of cardiac defects in embryofetal alcohol syndrome report of 16 cases. Br Heart J 39: 1374–1379, 1977. doi: 10.1136/hrt.39.12.1374. [DOI] [PMC free article] [PubMed] [Google Scholar]
- 10.Oster ME, Gurvitz M. Why lifelong care for patients with congenital heart defects is important. AAP News 36: 8, 2015. doi: 10.1542/aapnews.2015363-8. [DOI] [Google Scholar]
- 11.Fang T-T, Bruyere HJ, Kargas SA, Nishikawa T, Takagi Y, Gilbert EF. Ethyl alcohol-induced cardiovascular malformations in the chick embryo. Teratology 35: 95–103, 1987. doi: 10.1002/tera.1420350113. [DOI] [PubMed] [Google Scholar]
- 12.Serrano M, Han M, Brinez P, Linask KK. Fetal alcohol syndrome: cardiac birth defects in mice and prevention with folate. Am J Obstet Gynecol 203: 75.e7–75.e15, 2010. doi: 10.1016/j.ajog.2010.03.017. [DOI] [PubMed] [Google Scholar]
- 13.Yelin R, Yelin D, Oh W-Y, Yun SH, Boudoux C, Vakoc BJ, Bouma BE, Tearney GJ. Multimodality optical imaging of embryonic heart microstructure. J Biomed Opt 12: 064021, 2007. doi: 10.1117/1.2822904. [DOI] [PMC free article] [PubMed] [Google Scholar]
- 14.Daft PA, Johnston MC, Sulik KK. Abnormal heart and great vessel development following acute ethanol exposure in mice. Teratology 33: 93–104, 1986. doi: 10.1002/tera.1420330112. [DOI] [PubMed] [Google Scholar]
- 15.Karunamuni G, Gu S, Qiu Doughman Y, Peterson LM, Mai K, McHale Q, Jenkins MW, Linask KK, Rollins AM, Watanabe M, Doughman YQ, Peterson LM, Mai K, McHale Q, Jenkins MW, Linask KK, Rollins AM, Watanabe M. Ethanol exposure alters early cardiac function in the looping heart: a mechanism for congenital heart defects? Am J Physiol Heart Circ Physiol 306: H414–H421, 2014. doi: 10.1152/ajpheart.00600.2013. [DOI] [PMC free article] [PubMed] [Google Scholar]
- 16.Sarmah S, Marrs JA. Complex cardiac defects after ethanol exposure during discrete cardiogenic events in zebrafish: prevention with folic acid. Dev Dyn 242: 1184–1201, 2013. doi: 10.1002/dvdy.24015. [DOI] [PMC free article] [PubMed] [Google Scholar]
- 17.Ruckman RN, Messersmith DJ, O'Brien SA, Getson PR, Boeckx RL, Morse DE. Chronic ethanol exposure in the embryonic chick heart: effect on myocardial function and structure. Teratology 37: 317–327, 1988. doi: 10.1002/tera.1420370405. [DOI] [PubMed] [Google Scholar]
- 18.Twal WO, Zile MH. Retinoic acid reverses ethanol-induced cardiovascular abnormalities in quail embryos. Alcohol Clin Exp Res 21: 1137–1143, 1997. [PubMed] [Google Scholar]
- 19.Wang X, Williams E, Haasch ML, Dasmahapatra AK. Japanese medaka (Oryzias latipes): developmental model for the study of alcohol teratology. Birth Defects Res B Dev Reprod Toxicol 77: 29–39, 2006. doi: 10.1002/bdrb.20072. [DOI] [PubMed] [Google Scholar]
- 20.Ford SM, Pedersen CJ, Ford MR, Kim JW, Karunamuni GH, McPheeters MT, Jawaid S, Jenkins MW, Rollins AM, Watanabe M. Folic acid prevents functional and structural heart defects induced by prenatal ethanol exposure. Am J Physiol Heart Circ Physiol 320: H1313–H1320, 2021. doi: 10.1152/ajpheart.00817.2020. [DOI] [Google Scholar]
- 21.Jawaid S, Strainic JP, Kim J, Ford MR, Thrane L, Karunamuni GH, Sheehan MM, Chowdhury A, Gillespie CA, Rollins AM, Jenkins MW, Watanabe M, Ford SM. Glutathione protects the developing heart from defects and global DNA hypomethylation induced by prenatal alcohol exposure. Alcohol Clin Exp Res 45: 69–78, 2021. doi: 10.1111/acer.14511. [DOI] [PMC free article] [PubMed] [Google Scholar]
- 22.Karunamuni G, Sheehan MM, Doughman YQ, Gu S, Sun J, Li Y, Strainic JP, Rollins AM, Jenkins MW, Watanabe M. Supplementation with the methyl donor betaine prevents congenital defects induced by prenatal alcohol exposure. Alcohol Clin Exp Res 41: 1917–1927, 2017. doi: 10.1111/acer.13495. [DOI] [PMC free article] [PubMed] [Google Scholar]
- 23.Peterson LM, Gu S, Karunamuni G, Jenkins MW, Watanabe M, Rollins AM. Embryonic aortic arch hemodynamics are a functional biomarker for ethanol-induced congenital heart defects [Invited]. Biomed Opt Express 8: 1823–1837, 2017. doi: 10.1364/BOE.8.001823. [DOI] [PMC free article] [PubMed] [Google Scholar]
- 24.Markwald RR, Fitzharris TP, Manasek FJ. Structural development of endocardial cushions. Am J Anat 148: 85–119, 1977. doi: 10.1002/aja.1001480108. [DOI] [PubMed] [Google Scholar]
- 25.Person AD, Klewer SE, Runyan RB. Cell biology of cardiac cushion development. Int Rev Cytol 243: 287–335, 2005. doi: 10.1016/S0074-7696(05)43005-3. [DOI] [PubMed] [Google Scholar]
- 26.Hamburger V, Hamilton HL. A series of normal stages in the development of the chick embryo. Dev Dyn 195: 231–272, 1992. doi: 10.1002/aja.1001950404. [DOI] [PubMed] [Google Scholar]
- 27.Calkoen EE, Hazekamp MG, Blom NA, Elders BBLJ, Gittenberger-De Groot AC, Haak MC, Bartelings MM, Roest AAW, Jongbloed MRM. Atrioventricular septal defect: from embryonic development to long-term follow-up. Int J Cardiol 202: 784–795, 2016. doi: 10.1016/j.ijcard.2015.09.081. [DOI] [PubMed] [Google Scholar]
- 28.Webb S, Anderson RH, Brown NA. Endocardial cushion development and heart loop architecture in the trisomy 16 mouse. Dev Dyn 206: 301–309, 1996. doi:. [DOI] [PubMed] [Google Scholar]
- 29.Mikawa T, Hurtado R. Development of the cardiac conduction system. Semin Cell Dev Biol 18: 90–100, 2007. doi: 10.1016/j.semcdb.2006.12.008. [DOI] [PubMed] [Google Scholar]
- 30.van Weerd JH, Christoffels VM. The formation and function of the cardiac conduction system. Development 143: 197–210, 2016. doi: 10.1242/dev.124883. [DOI] [PubMed] [Google Scholar]
- 31.Fujii S, Hirota A, Kamino K. Optical recording of development of electrical activity in embryonic chick heart during early phases of cardiogenesis. J Physiol 311: 147–160, 1981. doi: 10.1113/jphysiol.1981.sp013578. [DOI] [PMC free article] [PubMed] [Google Scholar]
- 32.Hirota A, Kamino K, Komuro H, Sakai T. Mapping of early development of electrical activity in the embryonic chick heart using multiple-site optical recording. J Physiol 383: 711–728, 1987. doi: 10.1113/jphysiol.1987.sp016437. [DOI] [PMC free article] [PubMed] [Google Scholar]
- 33.De Jong F, Opthof T, Wilde AAM, Janse MJ, Charles R, Lamers WH, Moorman AFM. Persisting zones of slow impulse conduction in developing chicken hearts. Circ Res 71: 240–250, 1992. doi: 10.1161/01.res.71.2.240. [DOI] [PubMed] [Google Scholar]
- 34.Aanhaanen WTJ, Brons JF, Domínguez JN, Rana MS, Norden J, Airik R, Wakker V, De Gier-De Vries C, Brown NA, Kispert A, Moorman AFM, Christoffels VM. The Tbx2+ primary myocardium of the atrioventricular canal forms the atrioventricular node and the base of the left ventricle. Circ Res 104: 1267–1274, 2009. doi: 10.1161/CIRCRESAHA.108.192450. [DOI] [PubMed] [Google Scholar]
- 35.Christoffels VM, Burch JBE, Moorman AFM. Architectural plan for the heart: early patterning and delineation of the chambers and the nodes. Trends Cardiovasc Med 14: 301–307, 2004. doi: 10.1016/j.tcm.2004.09.002. [DOI] [PubMed] [Google Scholar]
- 36.Christoffels VM, Hoogaars WMH, Tessari A, Clout DEW, Moorman AFM, Campione M. T-Box transcription factor Tbx2 represses differentiation and formation of the cardiac chambers. Dev Dyn 229: 763–770, 2004. doi: 10.1002/dvdy.10487. [DOI] [PubMed] [Google Scholar]
- 37.Horsthuis T, Buermans HPJ, Brons JF, Verkerk AO, Bakker ML, Wakker V, Clout DEW, Moorman AFM, t’ Hoen PAC, Christoffels VM. Gene expression profiling of the forming atrioventricular node using a novel Tbx3-based node-specific transgenic reporter. Circ Res 105: 61–69, 2009. doi: 10.1161/CIRCRESAHA.108.192443. [DOI] [PubMed] [Google Scholar]
- 38.Kokubo H, Tomita-Miyagawa S, Hamada Y, Saga Y. Hesr1 and Hesr2 regulate atrioventricular boundary formation in the developing heart through the repression of Tbx2. Development 134: 747–755, 2007. doi: 10.1242/dev.02777. [DOI] [PubMed] [Google Scholar]
- 39.Ma L, Lu MF, Schwartz RJ, Martin JF. Bmp2 is essential for cardiac cushion epithelial-mesenchymal transition and myocardial patterning. Development 132: 5601–5611, 2005. doi: 10.1242/dev.02156. [DOI] [PubMed] [Google Scholar]
- 40.Singh MK, Christoffels VM, Dias JM, Trowe MO, Petry M, Schuster-Gossler K, Bürger A, Ericson J, Kispert A. Tbx20 is essential for cardiac chamber differentiation and repression of Tbx2. Development 132: 2697–2707, 2005. doi: 10.1242/dev.01854. [DOI] [PubMed] [Google Scholar]
- 41.Bressan M, Yang PB, Louie JD, Navetta AM, Garriock RJ, Mikawa T. Reciprocal myocardial-endocardial interactions pattern the delay in atrioventricular junction conduction. Development 141: 4149–4157, 2014. doi: 10.1242/dev.110007. [DOI] [PMC free article] [PubMed] [Google Scholar]
- 42.NIAAA. NIAAA council approves definition of binge drinking (Online). https://pubs.niaaa.nih.gov/publications/Newsletter/winter2004/Newsletter_Number3.pdf . [2004 Winter].
- 43.Urso T, Gavaler JS, Van Thiel DH. Blood ethanol levels in sober alcohol users seen in an emergency room. Life Sci 28: 1053–1056, 1981. doi: 10.1016/0024-3205(81)90752-9. [DOI] [PubMed] [Google Scholar]
- 44.Wang YT, Gu S, Ma P, Watanabe M, Rollins AM, Jenkins MW. Optical stimulation enables paced electrophysiological studies in embryonic hearts. Biomed Opt Express 5: 1000–1013, 2014. doi: 10.1364/BOE.5.001000. [DOI] [PMC free article] [PubMed] [Google Scholar]
- 45.de Oliveira MAB, Brandi AC, dos Santos CA, Cortez JLL, Braile DM. Modes of induced cardiac arrest: hyperkalemia and hypocalcemia - literature review. Rev Bras Cir Cardiovasc 29: 432–436, 2014. doi: 10.5935/1678-9741.20140074. [DOI] [PMC free article] [PubMed] [Google Scholar]
- 46.Hu Z, Rollins AM. Fourier domain optical coherence tomography with a linear-in-wavenumber spectrometer. Opt Lett 32: 3525–3527, 2007. doi: 10.1364/ol.32.003525. [DOI] [PubMed] [Google Scholar]
- 47.Jenkins MW, Watanabe M, Rollins AM. Longitudinal imaging of heart development with optical coherence tomography. IEEE J Sel Top Quantum Electron 18: 1166–1175, 2012. doi: 10.1109/JSTQE.2011.2166060. [DOI] [PMC free article] [PubMed] [Google Scholar]
- 48.Karunamuni G, Gu S, Doughman YQ, Noonan AI, Rollins AM, Jenkins MW, Watanabe M. Using optical coherence tomography to rapidly phenotype and quantify congenital heart defects associated with prenatal alcohol exposure: OCT of heart defects associated with alcohol. Dev Dyn 244: 607–618, 2015. doi: 10.1002/dvdy.24246. [DOI] [PMC free article] [PubMed] [Google Scholar]
- 49.Gu S, Wang YT, Ma P, Rollins AM, Jenkins MW. Mapping conduction velocity of early embryonic hearts with a robust fitting algorithm. Biomed Opt Express 6: 2138–2157, 2015. doi: 10.1364/BOE.6.002138. [DOI] [PMC free article] [PubMed] [Google Scholar]
- 50.Patten BM, Kramer TC, Barry A. Valvular action in the embryonic chick heart by localized apposition of endocardial masses. Anat Rec 102: 299–311, 1948. doi: 10.1002/ar.1091020305. [DOI] [PubMed] [Google Scholar]
- 51.Jongbloed MRM, Vicente Steijn R, Hahurij ND, Kelder TP, Schalij MJ, Gittenberger-de Groot AC, Blom NA. Normal and abnormal development of the cardiac conduction system; implications for conduction and rhythm disorders in the child and adult. Differentiation 84: 131–148, 2012. doi: 10.1016/j.diff.2012.04.006. [DOI] [PubMed] [Google Scholar]
- 52.Lev M. Conduction system in congenital heart disease. Am J Cardiol 21: 619–627, 1968. doi: 10.1016/0002-9149(68)90259-2. [DOI] [PubMed] [Google Scholar]
- 53.Vaidya D, Tamaddon HS, Lo CW, Taffet SM, Delmar M, Morley GE, Jalife J. Null mutation of connexin43 causes slow propagation of ventricular activation in the late stages of mouse embryonic development. Circ Res 88: 1196–1202, 2001. doi: 10.1161/hh1101.091107. [DOI] [PubMed] [Google Scholar]
- 54.Wang Y, Scheinman MM, Chien WW, Cohen TJ, Lesh MD, Griffin JC. Patients with supraventricular tachycardia presenting with aborted sudden death: incidence, mechanism and long-term follow-up. J Am Coll Cardiol 18: 1711–1719, 1991. doi: 10.1016/0735-1097(91)90508-7. [DOI] [PubMed] [Google Scholar]
- 55.Wellens HJJ, Bär FW, Farre J, Ross D, Vanagt EJ. Sudden death in the Wolff-Parkinson-White syndrome. In: Sudden Death. Developments in Cardiovascular Medicine, edited by Kulbertus HE, Wellens HJJ. Dordrecht: Springer, 1980, p. 392–399. doi: 10.1007/978-94-009-8834-7_27. [DOI] [Google Scholar]
- 56.Capone C, Buyon JP, Friedman DM, Frishman WH. Cardiac manifestations of neonatal lupus: a review of autoantibody-associated congenital heart block and its impact in an adult opulation. Cardiol Rev 20: 72–76, 2012. doi: 10.1097/CRD.0b013e31823c808b. [DOI] [PMC free article] [PubMed] [Google Scholar]
- 57.Friedman D, Duncanson L, Glickstein J, Buyon J. A review of congenital heart block. Images Paediatr Cardiol 5: 36–48, 2003. [PMC free article] [PubMed] [Google Scholar]
- 58.Boselli F, Freund JB, Vermot J. Flow mechanics in cardiovascular development. Cell Mol Life Sci 72: 2545–2559, 2015. doi: 10.1007/s00018-015-1885-3. [DOI] [PMC free article] [PubMed] [Google Scholar]
- 59.Ford SM, McPheeters MT, Wang YT, Ma P, Gu S, Strainic J, Snyder C, Rollins AM, Watanabe M, Jenkins MW. Increased regurgitant flow causes endocardial cushion defects in an avian embryonic model of congenital heart disease. Congenit Heart Dis 12: 322–331, 2017. doi: 10.1111/chd.12443. [DOI] [PMC free article] [PubMed] [Google Scholar]
- 60.Vermot J, Forouhar AS, Liebling M, Wu D, Plummer D, Gharib M, Fraser SE. Reversing blood flows act through klf2a to ensure normal valvulogenesis in the developing heart. PLoS Biol 7: e1000246, 2009. doi: 10.1371/journal.pbio.1000246. [DOI] [PMC free article] [PubMed] [Google Scholar]
- 61.Chi NC, Bussen M, Brand-Arzamendi K, Ding C, Olgin JE, Shaw RM, Martin GR, Stainier DYR. Cardiac conduction is required to preserve cardiac chamber morphology. Proc Natl Acad Sci USA 107: 14662–14667, 2010. doi: 10.1073/pnas.0909432107. [DOI] [PMC free article] [PubMed] [Google Scholar]
- 62.Chi NC, Shaw RM, Jungblut B, Huisken J, Ferrer T, Arnaout R, Scott I, Beis D, Xiao T, Baier H, Jan LY, Tristani-Firouzi M, Stainier DYR, Chi N, Shaw R, Jungblut B, Huisken J, Ferrer T, Arnaout R, Scott I, Beis D, Xiao T, Baier H, Jan L, Tristani-Firouzi M, Stainier DF. Genetic and physiologic dissection of the vertebrate cardiac conduction system. PLOS Biol 6: e109, 2008. doi: 10.1371/journal.pbio.0060109. [DOI] [PMC free article] [PubMed] [Google Scholar]
- 63.King JH, Huang CLH, Fraser JA. Determinants of myocardial conduction velocity: implications for arrhythmogenesis. Front Physiol 4: 154, 2013. doi: 10.3389/fphys.2013.00154. [DOI] [PMC free article] [PubMed] [Google Scholar]
- 64.Kirchhoff S, Nelles E, Hagendorff A, Krüger O, Traub O, Willecke K. Reduced cardiac conduction velocity and predisposition to arrhythmias in connexin40-deficient mice. Curr Biol 8: 299–302, 1998. doi: 10.1016/s0960-9822(98)70114-9. [DOI] [PubMed] [Google Scholar]
- 65.Houde M, Desbiens L, D’Orléans-Juste P. Endothelin-1: biosynthesis, signaling and vasoreactivity. In: Advances in Pharmacology. Cambridge, MA: Academic Press Inc. 2016, p. 143–175. doi: 10.1016/bs.apha.2016.05.002. [DOI] [PubMed] [Google Scholar]
- 66.Ottosson-Seeberger A, Ahlborg G, Hemser A, Lundberg JM, Alvestrand A. Hemodynamic effects of endothelin-1 and big endothelin-1 in chronic hemodialysis patients. J Am Soc Nephrol 10: 1037–1044, 1999. doi: 10.1681/ASN.V1051037. [DOI] [PubMed] [Google Scholar]
- 67.Vozzi F, Bianchi F, Ahluwalia A, Domenici C. Hydrostatic pressure and shear stress affect endothelin-1 and nitric oxide release by endothelial cells in bioreactors. Biotechnol J 9: 146–154, 2014. doi: 10.1002/biot.201300016. [DOI] [PubMed] [Google Scholar]
- 68.Yalcin HC, Shekhar A, McQuinn TC, Butcher JT. Hemodynamic patterning of the avian atrioventricular valve. Dev Dyn 240: 23–35, 2011. doi: 10.1002/dvdy.22512. [DOI] [PMC free article] [PubMed] [Google Scholar]
- 69.Cingolani E, Ionta V, Cheng K, Giacomello A, Cho HC, Marbán E. Engineered electrical conduction tract restores conduction in complete heart block: from in vitro to in vivo proof of concept. J Am Coll Cardiol 64: 2575–2585, 2014. doi: 10.1016/j.jacc.2014.09.056. [DOI] [PMC free article] [PubMed] [Google Scholar]
- 70.Meyers JD, Jay PY, Rentschler S. Reprogramming the conduction system: onward toward a biological pacemaker. Trends Cardiovasc Med 26: 14–20, 2016. doi: 10.1016/j.tcm.2015.03.015. [DOI] [PMC free article] [PubMed] [Google Scholar]


