Abstract.
Purpose: The invention of carbon nanotube (CNT) x-ray source arrays has enabled the development of novel imaging systems, including stationary tomosynthesis and stationary computed tomography (CT) with fast data acquisition, mechanically robust structures, and reduced image blur from source–detector motion. In this work, we report the results of simulation studies of potential system configurations for a stationary head CT (s-HCT) using linear CNT x-ray sources and detector arrays.
Approach: We explored s-HCT configurations that utilize one, two, and three linear CNT source arrays. Simulations were implemented using three digital phantoms with both CPU and GPU computing. Sinogram coverage was used for qualitative evaluation of the CT projection collection efficiency for each configuration. A modified low-contrast Shepp–Logan (SL) phantom was implemented for image quality assessment using quantitative metrics. Different iterative reconstruction (IR) methods were compared with both qualitative and quantitative assessments.
Results: Sinogram coverage of s-HCT configurations was sensitive to the number of CNT source arrays and geometry. The simulations suggest that a s-HCT configuration with three planes gives near complete sinogram coverage. Such a configuration enables accurate reconstruction of the low-contrast SL phantom and considerably diminished artifacts caused by the system geometry.
Conclusions: An optimized s-HCT system configuration with three linear CNT x-ray source arrays is feasible. IR algorithms can diminish artifacts caused by sparse and asymmetrical scans. The proposed s-HCT system configuration is currently under construction.
Keywords: carbon nanotube x-ray source, stationary computed tomography, fan beam, head computed tomography, limited-angle reconstruction
1. Introduction
The rapid diagnosis of traumatic brain injury is of paramount importance in combat casualty care. In resource-poor environments, the lack of advanced cross-sectional imaging such as computed tomography (CT) limits the ability of forward surgical teams to diagnose life-threatening head injuries. Current CT systems are highly complex instruments with the rapid rotation of an x-ray tube and detector, requiring a physically stable structure. Furthermore, the slip ring technology and high precision motion necessitates a well-controlled environmental setting, which may not be available at forward operating bases. The CT gantry’s physical movement limits the total acquisition time for a thick volume, and this type of movement produces non-negligible motion artifacts. Improvements have been made by employing more sources and detectors,1 increasing the detector size,2 reducing the rotation time,3 and optimizing the reconstruction techniques.4 The electron beam CT was proposed to remove the movement of CT rotational gantry thus providing high temporal resolution for cardiac CT imaging.5,6 New imaging techniques such as inverse-geometry computed tomography system7 and tetrahedron beam computed tomography (TBCT)8 demonstrate the potential for image quality improvement and radiation dose efficiency with innovative CT configurations using stationary x-ray tubes with multiple focal spots. Carbon nanotube (CNT) x-ray source arrays have provided a path for designing and constructing stationary tomographic imaging systems without mechanical motion. Stationary digital tomosynthesis systems for breast,9 chest,10 and dental11 imaging based on CNT linear arrays have been constructed and evaluated in translational human studies. Furthermore, gated imaging can also be performed with the field-emission sources, for either prospectively gating micro-CT for small animal imaging12 or gated chest tomosynthesis.13
This paper investigates the feasibility of a stationary head CT (s-HCT) system designed using stationary linear CNT x-ray source arrays and stationary detectors. In our approach, emitters on each linear CNT x-ray source array fire sequentially and provide sufficient coverage in the object domain to fulfill CT image reconstruction requirements. Multiple s-HCT configurations were explored through simulation and evaluated for sinogram coverage and reconstruction quality. Due to sparse data sampling, iterative algorithms were utilized for reconstruction. Results show that a three-plane s-HCT configuration provided sufficient data for CT reconstruction while limiting the system complexity.
The paper is structured as follows: In Sec. 2, the definition of sinogram coverage and two iterative algorithms are described. In Sec. 3, simulation results for different s-HCT configurations are reported. The discussion and conclusion are given in Secs. 4 and 5.
2. Materials and Methods
2.1. Sinogram Coverage
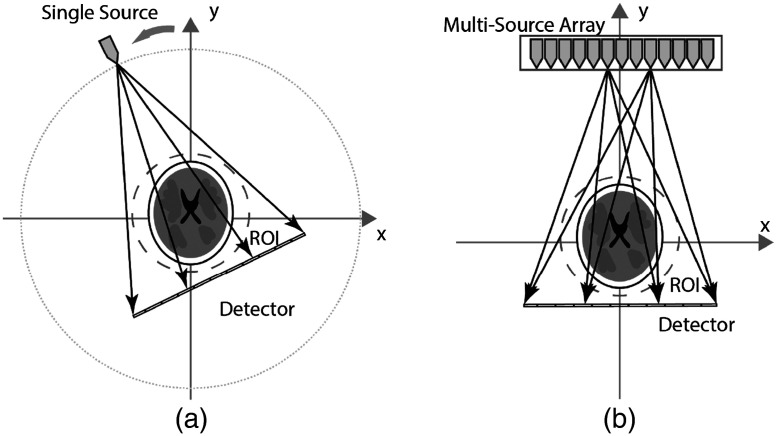
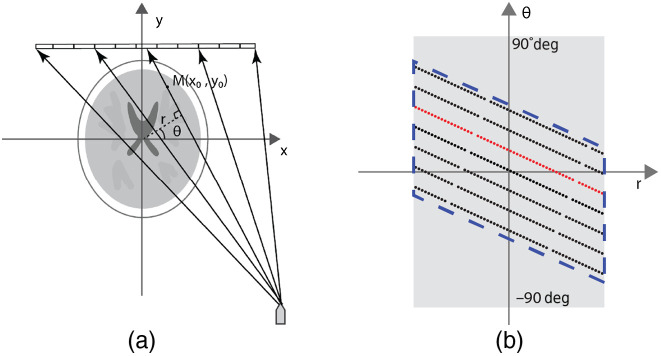
A conventional rotating geometry fan beam CT using a single x-ray source emitter and the corresponding set-up using a linear x-ray source array is shown in Fig. 1. A standard sinogram plot shows the source–detector’s rotational angle with each projection angle generating points on the plot that represent the connection between the x-ray focal source to each detector pixel [Fig. 2(b)]. Sinogram coverage provides an intuitive visual evaluation of possible s-HCT configurations. For a ray passing through a voxel in the object space, the corresponding point in the sinogram space is defined by the radon transform,14 where is the displacement of the ray, and is the angle of the ray as
| (1) |
Fig. 1.
Fan beam CT illustration. (a) Conventional rotating geometry with single source emitter and a linear detector. (b) Sample stationary geometry with a CNT multi-source array and a linear detector.
Fig. 2.
Sinogram definition for the stationary CT system. (a) A fan beam projection in the stationary CT system with ray passing through a mass . (b) Fan beam projections in sinogram space. Each point represents a single ray in the fan beam projection. Each dotted line (e.g., the red line) corresponds to a projection from a focal spot and the gaps within the dotted line indicate the spacing between detector panels. The sinogram coverage is calculated as the ratio of area covered by the test sinogram (region within the dashed line) to the ideal complete sinogram (gray region).
In the ideal case, every voxel of the object is traversed by an x-ray beam from all projection angles between 0 deg and 180 deg. Each ray then maps to a point in the sinogram space. However, in the s-HCT configuration, the available focal spots are limited by the source array physical dimensions, which limit the number of focal spots and the spacing between them. As a result, not all object voxels are traversed by all x-ray beams in the stationary CT configuration. The detector length and pixel size also potentially limit options in system geometry, especially if the detector receptor area does not reach the edge of its housing. Clearly, longer detectors will increase sinogram coverage but will also enlarge the system size. Thus, we restricted the length of the detector and fixed the detector pixel size at . Each projection image from a focal spot was discretized into multiple rays and mapped into sinogram space as a dotted line. We evaluated focal spot separations of 12 and 4 mm. The projections of a linear source array correspond to a series of dotted lines as shown in Fig. 2(b). To maintain a fair comparison, the spacing of rotation angles was converted to the same focal spot spacing as in s-HCT. The minimum complete sinogram coverage of a conventional fan beam rotating-gantry CT is 180 deg rotation plus fan angle. However, to simplify the simulation, we used a single-source CT system with 360 deg rotation as the configuration for full sinogram coverage. Figure 2(b) schematically illustrates the sinogram of s-HCT systems. For a circular field-of-view (FOV), the sinogram of the 360° rotational CT is illustrated as the gray box. The sinogram coverage for each possible configuration is calculated by calculating the area of corresponding sinogram [area within the dashed line in Fig. 2(b)] in comparison with the area of full-coverage sinogram. This provided an intuitive gauge of potential reconstruction image quality for the configuration.
2.2. Reconstruction Algorithm
Reconstruction code in this work is based on the AIR Tools II MATLAB package15 and the ASTRA Toolbox16 in MATLAB (Mathworks, Inc. Natick Massachusetts). Iterative Reconstruction (IR) techniques including algebraic reconstruction techniques (ART) and simultaneous iterative reconstruction techniques (SIRT) were evaluated for the s-HCT system to improve upon analytical methods for limited projection views. The modified algorithms enable simulation of different s-HCT geometries with variable placement of source and detector arrays. GPU enabled reconstruction was applied to reduce reconstruction time.
The fan-beam CT system can be approximated using a discrete linear system of equations
| (2) |
where is a vector that represents the object with voxels to be reconstructed, is a vector that represents the projection data with , the total number of discretized rays given by the production of – number of source points and – number of detector pixels, and is the system matrix defined by the s-HCT configuration.
2.2.1. Randomized ART method
Denoting rows of system matrix as and set , the contribution of the th row (projection) for the iterative improvement in the ART algorithm can be written as
| (3) |
where denotes in the ’th iteration. For each iteration, the order of is randomized to improve the convergence rate of the method for the s-HCT system.17
2.2.2. SIRT method
The SIRT method was implemented in a GPU environment (MATLAB R2019a, with Intel Core i5-9600K CPU @ 3.70 GHz and NVIDIA GeForce RTX 2070 graphics card). The SIRT algorithm is denoted as
| (4) |
where is a diagonal matrix denoting the inverse column sums of , i.e., , and is a diagonal matrix denoting the inverse row sums of , i.e., .
2.3. Image Quality Assessment
Both subjective and objective methods were used to assess the reconstructed image quality. Qualitative image quality assessment was conducted based on the subjective comparison of reconstructed images. Quantitative image quality metrics including the root-mean-square error (RMSE), the peak signal-to-noise ratio (PSNR), and the Structural Similarity Index (SSIM)18 were also used to evaluate reconstructed image quality with different reconstruction algorithms and different configurations. Given a reference image and a test image , both of size , the metrics can be written as
| (5) |
| (6) |
| (7) |
where
| (8) |
The SSIM is designed to assess any image distortion as a combination of three factors: luminance distortion , contrast distortion , and loss of correlation . In Eq. (8), and are the mean luminance of the two images. Parameters and denote the standard deviations of and . The covariance between the two images is given by . Parameters , , and are small positive constants used to avoid a null denominator.
2.4. Dataset
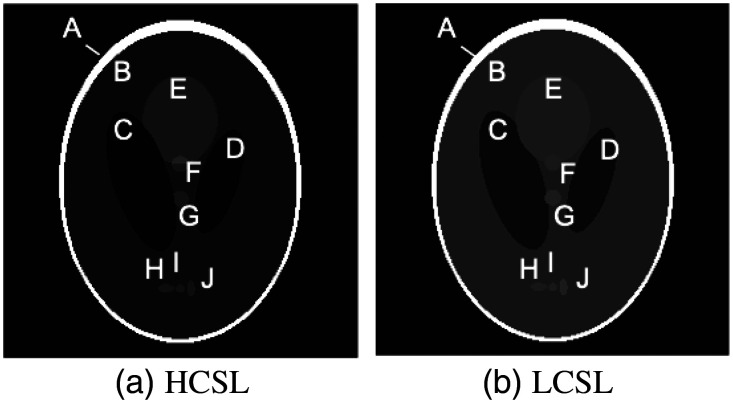
Two modified Shepp–Logan (SL) digital phantoms19 were used in this study. A high-contrast SL phantom [HCSL, Fig. 3(a)] was used to compare different s-HCT configurations. A low-contrast SL phantom [LCSL, Fig. 3(b)] modified based on the SL phantom was used to evaluate the reconstructed image quality of the proposed head CT system for the purpose of diagnosing brain hemorrhages. The index values for both phantoms are given in Table 1, in Hounsfield units. Hypothetically, matter labeled with A, B, and C/D represents the cranial bone, white/gray matter, and lateral ventricles in the human’s head, respectively. All the other masses represent soft tissue and/or blood clots with different attenuations. It is worth noting that different display windows are used for the two SL phantoms.
Fig. 3.
Two Shepp-Logan digital phantoms used in the simulation with (a) high contrast (display window: [0,1]) and (b) low contrast [display window: [0.55, 0.70])].
Table 1.
Specification of the contrast objects used in the two SL phantoms.
| Region | A | B | C | D | E | F | G | H | I | J |
|---|---|---|---|---|---|---|---|---|---|---|
| HCSL | 1 | 0.2 | 0 | 0 | 0.3 | 0.3 | 0.3 | 0.2 | 0.2 | 0.2 |
| LCSL | 1 | 0.6 | 0.577 | 0.577 | 0.606 | 0.608 | 0.611 | 0.608 | 0.611 | 0.614 |
| LCSL (HU) | 750 | 50 | 10 | 10 | 60 | 65 | 70 | 65 | 70 | 75 |
| Tissue | Bone | White matter | Ventricles | Tumor and blood | ||||||
2.5. Source–Detector Module Selection
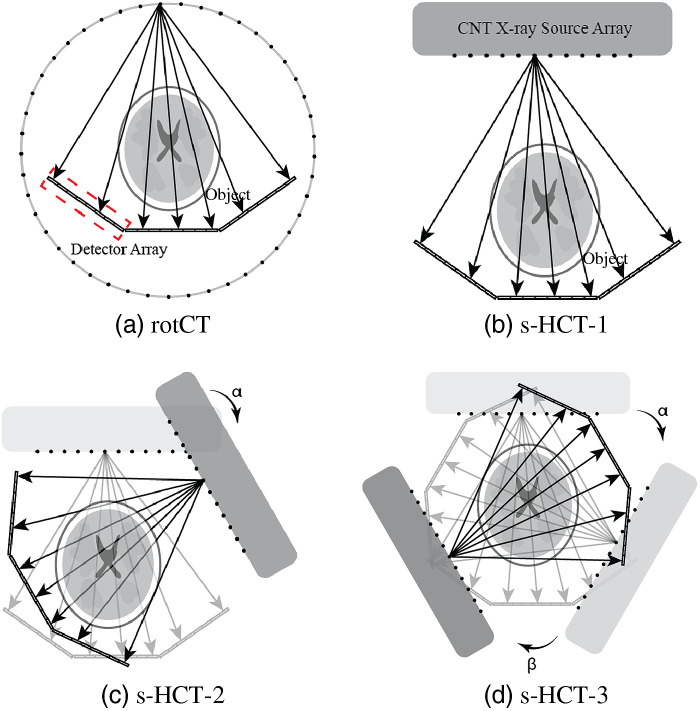
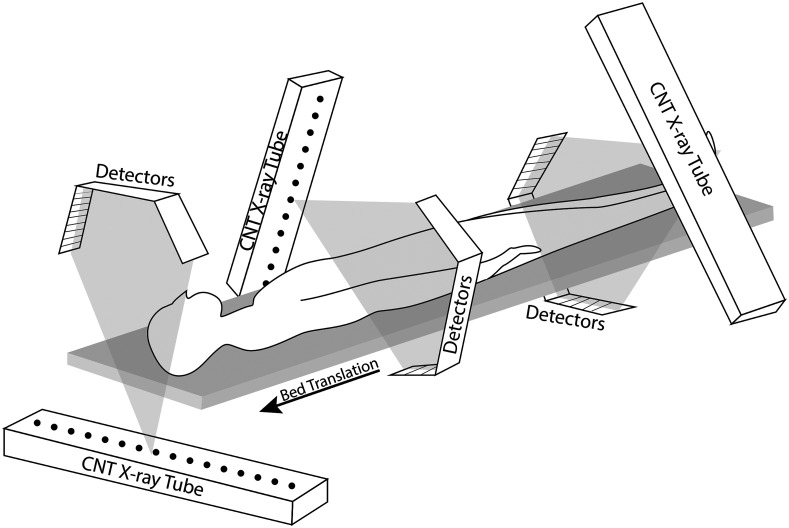
The proposed s-HCT system is to be constructed with multiple copies of the same x-ray module to simplify the design and simplify manufacturing. Each module consists of a linear CNT x-ray source array paired with segments of linear detector arrays [Fig. 4(b)]. Instead of using one long linear detector array to pair with the source array, three shorter detector arrays provided more efficient angular coverage in the fan beam type geometry. With these source–detector components, the exploration of different s-HCT configurations is simplified by either employing different numbers of modules or different layouts with the same number of modules. In the simulation, each x-ray source array has multiple emitters arranged linearly over a length of 530 mm and is paired with multiple segments of linear detector array with an effective length of 690 mm. Two source densities were evaluated. First, a dense source array at 128 emitters per source array was used to examine the sinogram coverage. Second, a sparse 45 emitter per source array was used to represent a more realistic physical implementation and evaluate different reconstruction algorithms. The distance of each source array to object center was fixed at 360 mm, and the distance of the source array center to the detector array center was 470 mm. These parameters reflect the currently available CNT x-ray source array parameters and the desire to have a reconstruction FOV of for head imaging. The rotational CT system [rotCT, Fig. 4(a)] with the same number of projections and same detector structure was set as a reference. The proposed stationary CT configurations with a different number of source–detector modules and different angles between modules are shown in Fig. 4. To keep the same source-to-detector distance and source-to-object distance, the placement of different modules solely utilized rotation around the center of the object. The rotation angle between the first module and the second module is defined as . The rotation angle between the second module and the third module is defined as . For the s-HCT, continuous full coverage of the sinogram is difficult to achieve in a single plane configuration because each x-ray source array requires packaging space for isolating the high voltage and radiation shielding. Thus, the potential arrangement of the x-ray source arrays is constrained by their physical structure. A practical solution is to separate the source–detector paired modules into different imaging planes.20 A schematic diagram showing the 3D structure is illustrated in Fig. 5. In this study, we focused on the 2D fan beam reconstruction and considered all source–detector modules to be in the same imaging plane despite the potential for hardware overlap.
Fig. 4.
Modular head CT configurations. (a) Rotational CT (rotCT) configuration with a single source array and 3-detector segments structure with the gantry rotating in a circular trajectory. An individual short detector segment is highlighted by the dashed lines. (b) Stationary CT configuration with 1 source–detector module (s-HCT-1) using a CNT x-ray source array and 3-detector segments structure. The source emitters fire sequentially along the array. (c) Stationary CT configuration with 2 source–detector modules (s-HCT-2). A second module is added based on s-HCT-1 and rotated around the region of interest (ROI) by an angle of . (d) Stationary CT configuration with 3 source–detector modules (s-HCT-3). The angle between the third module added and the second module as in s-HCT-2 is . For actual implementation, the modules may need to be displaced along the axial axis (see Fig. 5).
Fig. 5.
Schematic 3D diagram of a three plane s-HCT system configuration with three source–detector modules.
3. Results
3.1. Sinogram Coverage and Non-Uniformity Analysis with Uniform Disk Phantom
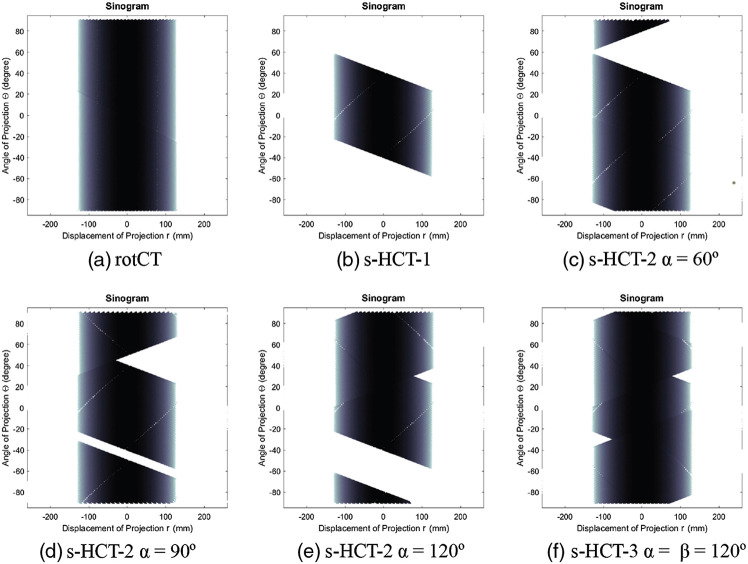
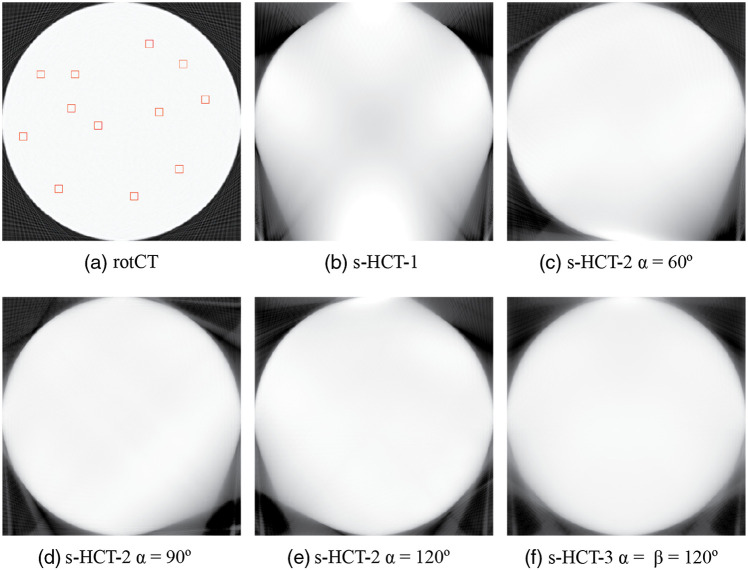
The evaluation of sinogram coverage for each CT system is simplified by using a uniform disk phantom with consistent size of ROI in this section. In the evaluation, 128 source emitters are used in each module to allow more dense sinogram coverage. The total ROI has a size of , . The display window is [0, 1]. Figure 6 shows the sinograms of some of the proposed CT systems. Figure 6(a) presents the complete sinogram coverage from the rotational CT. A single source–detector module provided approximately 45% of the full sinogram space according to the sinogram in Fig. 6(b). This lack of coverage in the sinogram lead to obvious missing projections [Fig. 7(b)], introducing artifacts in the image. These artifacts exist because the single source–detector configuration is essentially stationary digital tomosynthesis.21 When a second source–detector module is added by simply rotating the first module around the center of the ROI by an angle of , the sinogram coverage increases as increases from 0. The value reached a maximum of 87% when . The coverage percentage then fell as increased further to 180 deg, as expected when the second pair reaches a mirror image position. The blurry regions caused by missing information at certain angles shrink when the sinogram coverage increases. To complete the coverage gap in the s-HCT-2 system, a third source–detector module is thus necessary. The s-HCT-3 system with increases the coverage in sinogram up to 98% (see Table 2), where is the rotation angle between the second module and the third module. Non-uniformity (NU) was evaluated by creating 12 randomly selected ROIs to evaluate the attenuation fluctuations in the reconstructed images. The ROIs were randomly positioned in the homogeneous region on the phantom as shown in Fig. 7(a). NU is calculated by taking the standard deviation of the mean value in all ROIs for each image, i.e. . As shown in Table 2, lower RMSE and higher PSNR can be acquired when the sinogram coverage increases, which is consistent with the fact that when the coverage is low, the image is more blurry and has more defects. This qualitative evaluation also agreed with the NU values in Table 2. Overall, the s-HCT-3 system has the highest sinogram coverage that provides low NU and fewer artifacts visually.
Fig. 6.
Sinograms of different system configurations using uniform disk phantom. (a) Rotational CT system. (b) Stationary CT system with 1 source–detector module. (c)–(e) Stationary CT system with 2 source–detector modules and . (f) Stationary CT system with 3 source–detector modules and .
Fig. 7.
Reconstructed images for different CT system using a uniform disk phantom. (a) Rotational CT system. (b) Stationary CT system with 1 source–detector module. (c)–(e) Stationary CT system with 2 source–detector modules and . (f) Stationary CT system with 3 source–detector modules and .
Table 2.
Quantitative evaluation of sinogram and reconstructed image quality for different CT system with uniform disk phantom.
| Config | rotCT | s-HCT-1 | s-HCT-2 | s-HCT-3 | |||
|---|---|---|---|---|---|---|---|
| 60 deg | 80 deg | 90 deg | 120 deg | ||||
| Sino(%) | 100.00 | 44.91 | 78.28 | 87.41 | 85.43 | 77.41 | 98.59 |
| NU | 0.00 | 0.04 | 0.01 | 0.01 | 0.01 | 0.01 | 0.01 |
| RMSE | 0.04 | 0.18 | 0.12 | 0.11 | 0.10 | 0.11 | 0.11 |
| PSNR | 29.08 | 16.07 | 19.22 | 19.55 | 20.02 | 20.57 | 19.17 |
3.2. Reconstruction Image Quality Analysis with HCSL Phantom
Three types of s-HCT configurations were studied with one source–detector module, two source–detector modules and three source–detector modules respectively on the HCSL phantom. In this evaluation, 128 source emitters are used in each module to provide a greater number of views. The total FOV has a size of , . The display window is [0, 1]. A conventional fan beam CT with full 360 deg rotation was used as the benchmark. The sinogram was recast to to remove redundant information, with the physical dimension shown in mm. All modules were held stationary throughout the scans. The Randomized ART method from the AIR Tool II toolbox was used to reconstruct the image for the different configurations.
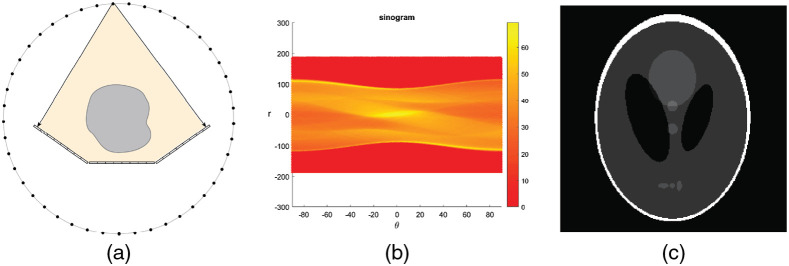
In the rotational CT with full 360 deg rotation (Fig. 8), the sinogram was fully covered from to 90 deg, as expected. This coverage served as a benchmark for evaluating the s-HCT configurations. The high quality reconstructed image was used as the reference image.
Fig. 8.
Rotational CT configuration. (a) Layout for the reference rotational CT configuration. The x-ray source emitter and detector arrays rotate simultaneously around the center of object domain. (b) Sinogram. This configuration gives a full sinogram coverage from to 90 deg. (c) Reconstructed image with ART algorithm. The sinogram and reconstructed phantom image for this configuration was used as the benchmark for comparison of other configurations. Display window: [0, 1].
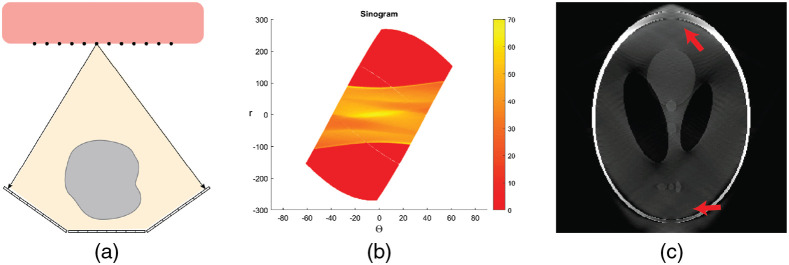
With only one source array and detector set (Fig. 9), only about 80 deg of view is covered in this configuration. A large area of sinogram space coverage is absent. The reconstructed image is of poor quality in the upper and lower regions, which corresponded to the missing sinogram coverage.
Fig. 9.
One source–detector pair configuration. (a) Layout. The black dots represent the x-ray source emitters and are linearly arranged on an linear array (the red box). Three detector segments are paired with this source array. Each emitter shines sequentially to acquire data from different angles of view. (b) Sinogram. The sinogram coverage is near 80 deg; less than half of the sinogram space is covered. (c) Reconstructed HCSL phantom image with the ART algorithm. The phantom is recovered only for the central portion of the image. For the top and bottom sections, the lack of projection information caused large distortions and blurs. Display window: [0, 1].
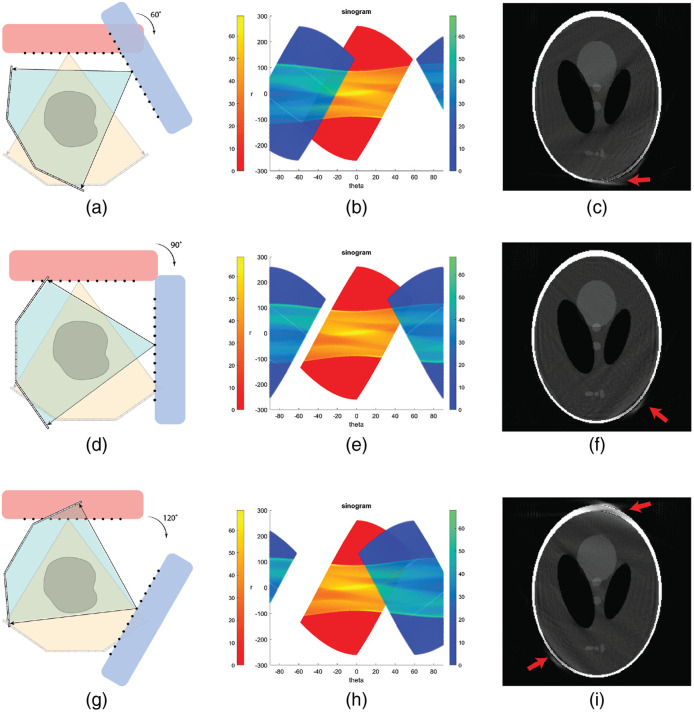
With two source–detector pairs, there were several possible ways of arranging the pairs in a single plane or in two imaging planes. Figure 10 shows three possible configurations. To identify the different source–detector pairs, the source array in the first pair is marked as red, as is the sinogram data generated by this pair. The second pair is rotated clockwise from the first around the object center, this source array as well as the corresponding sinogram data block are labeled in blue. As the relative angle between the two pairs increases from 0 deg (second pair overlapped with the first pair) to 180 deg (second pair opposite to the first pair), sinogram data contributed by the second source–detector pair (blue) moves to left, i.e. along the negative axis () direction. Three angles of interest 60 deg, 90 deg, and 120 deg were selected to illustrate the impact on reconstructed images. When the angle is between 80 deg and 100 deg, the sinogram had the largest coverage with the least overlap between the two blocks of data. Nevertheless, artifacts in reconstructed images still exist at the top and bottom region near the skull due to the missing data in the sinogram space. It was concluded that the two-module configuration is not sufficient in sinogram coverage for generating acceptable CT images.
Fig. 10.
Two source–detector pair configurations and reconstruction using HCSL phantom. (a)–(c) Layout, sinogram and reconstructed image for a two source–detector pair configuration with the second pair rotated by 60 deg. (d)–(f) Layout, sinogram and reconstructed image for a two source–detector pair configuration with the second pair rotated by 90 deg. (g)–(i) Layout, sinogram and reconstructed image for a two source–detector pair configuration with the second pair rotated by 120 deg. Display window: [0, 1].
With three source–detector modules, near complete sinogram coverage can be achieved. Figure 11 shows plots that are similar to that in the Fig. 10 with the third pair of source and detector arrays (labeled in black) added. The angle between each pair is 120 deg. With such a centrosymmetric layout, data points are spread evenly in the sinogram space and provide a nearly full coverage for the object. The quality of reconstructed image is high and close to that of the rotating CT configuration. From the sinogram it can be seen that objects as large as will have sufficient coverage and be properly imaged.
Fig. 11.
Three source–detector pair configurations. (a) Layout. Three source–detector pairs sit at 0 deg, 120 deg, and 240 deg individually. (b) Sinogram. The sinogram coverage in the phantom region is nearly complete. (c) Reconstructed image with ART algorithm using HCSL phantom. Display window: [0, 1].
3.3. Different Reconstruction Algorithms Comparison with LCSL Phantom
As anticipated, the image quality of the reconstruction is significantly improved by increasing the sinogram coverage. Given the geometric constraints caused by the physical structure of CNT x-ray tubes and detector panels, at least three source–detector pairs are required to achieve sufficient coverage in the sinogram space. To physically implement this three-module configuration, each source–detector pair is separated to an individual plane to avoid overlapping onto each other and blocking x-ray beams.
In the preliminary experimental set-up,22 a single linear CNT x-ray source tube with 45 beam emitters was used to collect projection data. The interval between source emitters was 12 mm. The detector panel has 2304 by 68 pixels with a pixel size. The phantom was set to with voxel size. Due to physical constraints, the three modules need to be placed in three separate planes. The scanned object travels axially through the system to allow the targeted slice to be scanned by all three source–detector pairs. In this section, the LCSL phantom was utilized to mimic both normal and pathologic materials in the human head. The values of the LCSL phantom were mapped to the corresponding Hounsfield unit scale to represent the brain and skull. The HU map is given in Table 1 – LCSL(HU). The ASTRA toolbox was utilized for reconstruction and leveraged GPU acceleration. The IR speeds were also compared for both CPU and GPU. Two regions of interest (ROI) marked in red boxes with 1 and 2 ( and ) were selected for quantitative measure of the Contrast Ratio (CR). , or 2. The red box marked with 0 () was used as a background.
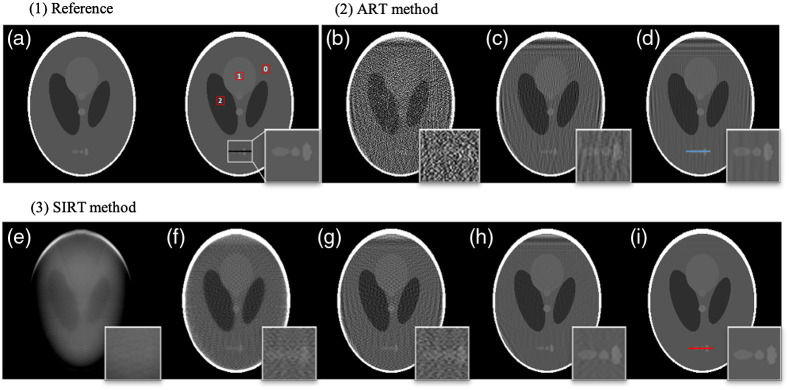
Two IR methods were evaluated and compared for the three-plane configuration in Fig. 12 with different iteration numbers. Without any photon or electronic noise applied, the image quality of reconstruction is improved by increasing the total number of iterations. All low contrast objects can be identified in the two algorithms; the difference in object H, I, and J was only 5 HU, which is identical in both algorithms. When the iteration number is low, artifacts appeared prominently throughout the images. A higher number of iterations reduced and nearly eliminated the error caused by the missing coverage in sinogram space and the sparsity of views. Figure 13 shows the horizontal profile of lines drawn in the reference image [Fig. 12(a)], the reconstruction image with randomized ART, 100 iterations [Fig. 12(d)], and the reconstruction image with SIRT, 100,000 iterations [Fig. 12(i)]. From the profiles, it can be seen that both algorithms are capable of reconstructing the low contrast objects even with a small, 5 HU difference. With higher number of iterations employed, SIRT almost completely restores the intensity and sharpness of the low-contrast SL phantom. Even with a high iteration number, artifacts still appear within the low-contrast area near the periphery of the head phantom especially in the frontal region where the thick bone is located. This is due to the missing sinogram coverage in the corresponding area. Longer detectors can provide coverage of the missing sinogram area, but longer detectors would also increase the size of the system and the cost to physically implement.
Fig. 12.
Different reconstruction algorithms for the three-plane configuration using a LCSL phantom without noise. (a) Reference image, (b)–(d) Randomized ART method with AIR Tool II toolbox using 1 iteration, 10 iterations and 100 iterations, (e)–(i) SIRT with ASTRA Toolbox using iterations of 10; 100; 1000; 10,000; and 100,000. Display window: [0.55, 0.70].
Fig. 13.
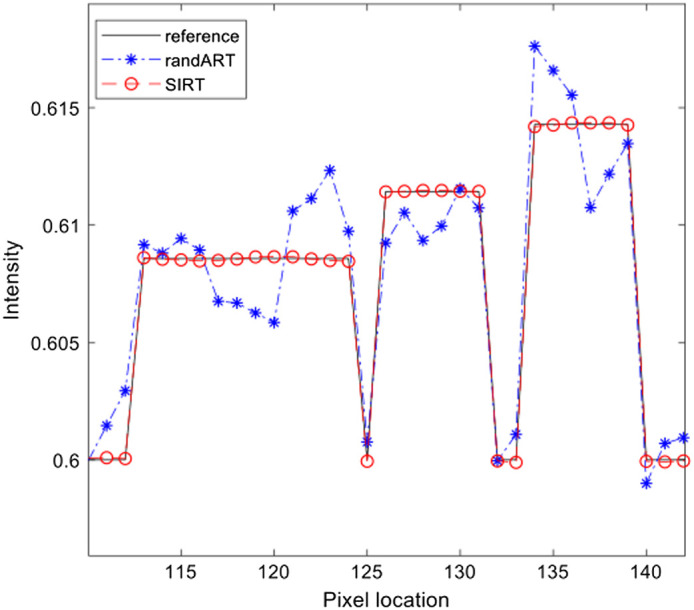
Line profile comparison for different reconstruction algorithms used in the three-plane configuration. The lines are marked in Fig. 12 (a), (d), and (i) corresponding to the reference image, reconstruction image using randomized ART with 100 iterations and reconstruction image using SIRT with 100,000 iterations.
Quantitative assessment was conducted by calculating the image quality metrics for each algorithm (Table 3). Both algorithms perform well in the periphery region given the low RMSE values. As the iteration number increases, the RMSE value becomes smaller and the image quality was improved significantly with higher similarity values. With the lowest RMSE and highest SSIM, the SIRT method with 100,000 iterations gave the best result quantitatively for the proposed configuration. Consistent with the qualitative evaluation, contrast ratios of both ROIs (CR1 and CR2 are the contrast ratios of regions 1 and 2 and region 0 in Fig. 12) had minor variations and the SIRT algorithm with 100,000 iterations resulted in the highest quality values out of all the tested methods. This result will provide guidance for our future work in selection of iteration numbers.
Table 3.
Image quality metrics comparison for different reconstruction algorithms. ART implementation is on Intel Core i5-9600K CPU @ 3.70 GHz while SIRT implementation is on NVIDIA GeForce RTX 2070 graphics card.
| Algorithm | ART (CPU) | SIRT (GPU) | ||||||
|---|---|---|---|---|---|---|---|---|
| Iteration | 1 | 10 | 100 | 10 | 100 | 1000 | 10,000 | 100,000 |
| RMSE | 0.05 | 0.02 | 0.01 | 0.12 | 0.05 | 0.03 | 0.01 | 0.00 |
| PSNR | 26.49 | 34.54 | 37.51 | 18.09 | 25.36 | 31.10 | 41.23 | 71.57 |
| SSIM | 0.40 | 0.86 | 0.94 | 0.57 | 0.72 | 0.76 | 0.94 | 1.00 |
| CR1 | 0.13 | 0.14 | 0.16 | 0.62 | 0.27 | 0.16 | 0.17 | 0.20 |
| CR2 | 0.84 | 0.83 | 0.82 | 0.29 | 0.82 | 0.85 | 0.81 | 0.80 |
| Run time (s) | 99 | 320 | 2476 | 0.05 | 0.3 | 3 | 29 | 299 |
4. Discussion
In this work, different head CT configurations were compared using a design of source–detector module with a single linear CNT x-ray source array and linear detector strips. This modular design provided the feasibility and flexibility to simulate potential s-HCT systems. The configurations were evaluated for both sinogram coverage and reconstructed image quality using three digital phantoms. The image quality of a configuration was sensitive to the number and layout of the source–detector modules. Three modules were found to be necessary and provided almost sufficient sinogram coverage for CT reconstruction. The reconstructed images were recovered with low error and high peak signal-to-noise ratio for the high contrast objects, and it was possible to differentiate low contrast (5 to 10 HU difference) tissue with further improvement in reconstruction and data processing.
With the same iteration number (100 iterations as an example), the randomized ART method provided slightly better image quality given the algorithm’s randomized selection of rows in Eq. (3) but at the cost of computing time (about 40 minutes per image slice) as it was not yet implemented in GPU processing. The SIRT method gave comparable image quality, and with GPU implementation, the reconstruction time for each slice was less than one second. When the number of source emitters on each CNT source array decreased from 128 to 45, the error in the reconstructed image increased substantially, making it more difficult to differentiate low contrast objects. By increasing the total number of iterations, the artifacts were almost eliminated. This demonstrated the feasibility of building a three-plane s-HCT system.
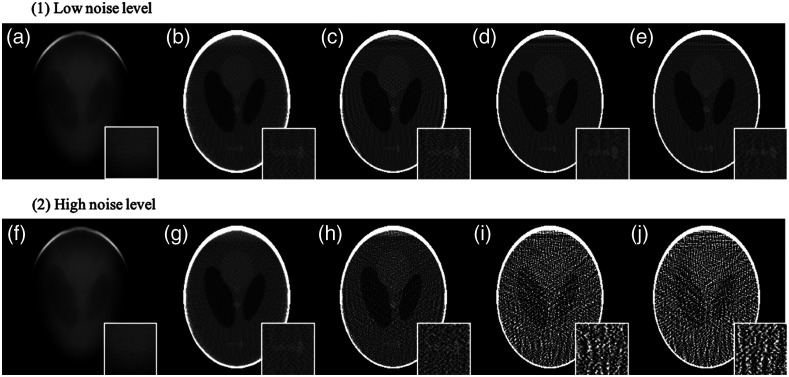
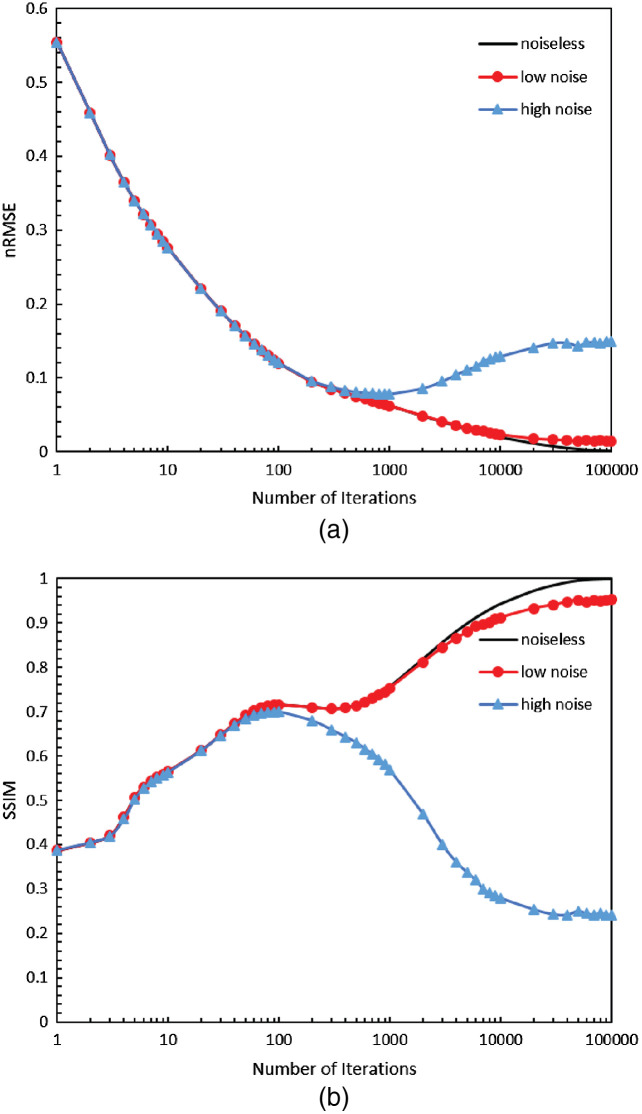
In the previous section, the image quality was only assessed using digital phantoms without any noise. Noise due to primary or scattered photons was not considered. We performed a preliminary investigation of image reconstruction with noisy data in Fig. 14. In the laboratory setup, the source array was operated at 120 kVp and each emitter had a reliable output of 0.06 mAs. The average signal-to-noise ratio measured in the projection images is 52.86. Different Poisson-noise levels were applied to the same LCSL phantom in this simulation. Figure 15 shows metrics of reconstructions from noiseless data, low noise-level data with PSNR of and high noise-level data with PSNR of . Normalized RMSE (nRMSE) is measured as . With no noise or low-level noise, more iterations reduce the RMSE and improve the SSIM, which proved the IR recovers the image quality despite the absence of projection views. But with high noise-levels, higher iteration numbers introduced a loss of image fidelity and ruined the structural similarity of the reconstructions. The metrics indicated that there is a need to carefully choose iteration number in clinical imaging applications.
Fig. 14.
Reconstructed image of LCSL phantom with noise. (a)–(e) Reconstruction with low noise level () using SIRT 10; 100; 1000; 10,000; and 100,000 iterations. (f)–(j) Reconstruction with high noise level () using SIRT 10; 100; 1000; 10,000; and 100,000 iterations respectively. Display window: [0.55,0.70].
Fig. 15.
Metrics nRMSE(a) and SSIM(b) of LCSL phantom reconstruction with noiseless data (line), low-noise data (circle) and high-noise data (triangle) using different iterations of SIRT algorithm.
Some limitations of the study are noted. First, digital phantoms with simple morphology were studied. We are evaluating the system with more complicated phantoms such as the ACR phantom, which includes spatial resolution inserts and clinical CT images of human head anatomies. Second, no regularization has yet been applied in the reconstruction algorithm as shown in the result. An implementation of TV regularization is under evaluation during iterations of the reconstruction, the overall error was reduced but at the cost of a loss in spatial resolution. This suggested that further improvements in image quality can be gained with advanced iterative algorithms such as TV-POCS,23 ASD-POCS,24 EPTV,25 and AwTV26 can be gained. Additionally, The image quality of an actual s-HCT system remains to be validated with an experimental system. The construction of the s-HCT based on this configuration study is underway, and we hope to report the results in a future publication.
5. Conclusion
In this work, we simulated different s-HCT configurations and compared the quality of the reconstructed images with different digital phantoms. Three types of s-HCT systems were studied with one, two and three linear CNT x-ray source arrays and corresponding detector segments. Qualitative and quantitative evaluations were conducted in terms of the sinogram coverage and image quality metrics. Two IR algorithms were compared to test their performance in image reconstruction for low-contrast head images. The artifacts caused by missing sinogram coverage were significantly reduced by applying more iterations for noiseless projections. When noise was applied, artifacts were initially reduced with more iterations. But, beyond an optimal iteration number, the artifacts increased, especially in regions with low attenuation. This suggests that a careful selection of iteration number in future applications of the IR algorithm is needed. Finally, we showed that a three-plane s-HCT configuration has sufficient sinogram coverage for image reconstruction with high fidelity, low errors, and fewer artifacts. Further study on the physical implementation will be reported.
Acknowledgments
The work is supported by U.S. Department of Defense (DOD) under Grant DM180025. The research is partly reported in SPIE Proceedings for Medical Imaging 2020: Physics of Medical Imaging.27
Biography
Biographies of the authors are not available.
Disclosures
Otto Zhou has equity ownership and serves on the board of directors of Xintek, Inc., to which the technologies used or evaluated in this project have been or will be licensed. Jianping Lu has equity ownership in Xintek, Inc. All activities have been approved by institutional COI committees.
Contributor Information
Yueting Luo, Email: yueting@live.unc.edu.
Derrek Spronk, Email: spronk@live.unc.edu.
Yueh Z. Lee, Email: yueh_lee@med.unc.edu.
Otto Zhou, Email: zhou@email.unc.edu.
Jianping Lu, Email: jpl@physics.unc.edu.
References
- 1.Flohr T. G., et al. , “First performance evaluation of a dual-source CT (DSCT) system,” Eur. Radiol. 16(2), 256–268 (2006). 10.1007/s00330-005-2919-2 [DOI] [PubMed] [Google Scholar]
- 2.Ropers D., et al. , “Usefulness of multidetector row spiral computed tomography with 64- × 0.6-mm collimation and 330-ms rotation for the noninvasive detection of significant coronary artery stenoses,” Am. J. Cardiol. 97(3), 343–348 (2006). 10.1016/j.amjcard.2005.08.050 [DOI] [PubMed] [Google Scholar]
- 3.Schardt P., et al. , “New x-ray tube performance in computed tomography by introducing the rotating envelope tube technology,” Med. Phys. 31(9), 2699–2706 (2004). 10.1118/1.1783552 [DOI] [PubMed] [Google Scholar]
- 4.Willemink M. J., et al. , “Iterative reconstruction techniques for computed tomography part 1: technical principles,” Eur. Radiol. 23(6), 1623–1631 (2013). 10.1007/s00330-012-2765-y [DOI] [PubMed] [Google Scholar]
- 5.Boyd D., et al. , “A proposed dynamic cardiac 3-D densitometer for early detection and evaluation of heart disease,” IEEE Trans. Nucl. Sci. 26(2), 2724–2727 (1979). 10.1109/TNS.1979.4330523 [DOI] [Google Scholar]
- 6.Lipton M., et al. , “Cardiac imaging with a high-speed cine-CT scanner: preliminary results,” Radiology 152(3), 579–582 (1984). 10.1148/radiology.152.3.6540463 [DOI] [PubMed] [Google Scholar]
- 7.Schmidt T. G., et al. , “A prototype table-top inverse-geometry volumetric CT system,” Med. Phys. 33(6Part1), 1867–1878 (2006). 10.1118/1.2192887 [DOI] [PubMed] [Google Scholar]
- 8.Zhang T., et al. , “Tetrahedron beam computed tomography (TBCT): a new design of volumetric ct system,” Phys. Med. Biol. 54(11), 3365 (2009). 10.1088/0031-9155/54/11/006 [DOI] [PubMed] [Google Scholar]
- 9.Qian X., et al. , “High resolution stationary digital breast tomosynthesis using distributed carbon nanotube x-ray source array,” Med. Phys. 39(4), 2090–2099 (2012). 10.1118/1.3694667 [DOI] [PMC free article] [PubMed] [Google Scholar]
- 10.Shan J., et al. , “Stationary chest tomosynthesis using a carbon nanotube x-ray source array: a feasibility study,” Phys. Med. Biol. 60(1), 81–100 (2014). 10.1088/0031-9155/60/1/81 [DOI] [PubMed] [Google Scholar]
- 11.Shan J., et al. , “Stationary intraoral digital tomosynthesis using a carbon nanotube x-ray source array,” Dentomaxillofac. Radiol. 44(9), 20150098 (2015). 10.1259/dmfr.20150098 [DOI] [PMC free article] [PubMed] [Google Scholar]
- 12.Cao G., et al. , “A dynamic micro-CT scanner based on a carbon nanotube field emission x-ray source,” Phys. Med. Biol. 54(8), 2323 (2009). 10.1088/0031-9155/54/8/005 [DOI] [PubMed] [Google Scholar]
- 13.Lee Y. Z., et al. , “Initial clinical evaluation of gated stationary digital chest tomosynthesis,” Proc. SPIE 10573, 105730I (2018). 10.1117/12.2293713 [DOI] [Google Scholar]
- 14.Radon J., “On the determination of functions from their integral values along certain manifolds,” IEEE Trans. Med. Imaging 5(4), 170–176 (1986). 10.1109/TMI.1986.4307775 [DOI] [PubMed] [Google Scholar]
- 15.Hansen P. C., Jørgensen J. S., “AIR Tools II: algebraic iterative reconstruction methods, improved implementation,” Numer. Algorithms 79(1), 107–137 (2018). 10.1007/s11075-017-0430-x [DOI] [Google Scholar]
- 16.Van Aarle W., et al. , “Fast and flexible x-ray tomography using the astra toolbox,” Opt. Express 24(22), 25129–25147 (2016). 10.1364/OE.24.025129 [DOI] [PubMed] [Google Scholar]
- 17.Strohmer T., Vershynin R., “A randomized Kaczmarz algorithm with exponential convergence,” J. Fourier Anal. Appl. 15(2), 262 (2009). 10.1007/s00041-008-9030-4 [DOI] [PMC free article] [PubMed] [Google Scholar]
- 18.Wang Z., et al. , “Image quality assessment: from error visibility to structural similarity,” IEEE Trans. Image Process. 13(4), 600–612 (2004). 10.1109/TIP.2003.819861 [DOI] [PubMed] [Google Scholar]
- 19.Shepp L. A., Logan B. F., “The Fourier reconstruction of a head section,” IEEE Trans. Nucl. Sci. 21(3), 21–43 (1974). 10.1109/TNS.1974.6499235 [DOI] [Google Scholar]
- 20.Spronk D., et al. , “Evaluation of carbon nanotube x-ray source array for stationary head computed tomography,” Med. Phys. 48, 1089–1099 (2020). 10.1002/mp.14696 [DOI] [PubMed] [Google Scholar]
- 21.Qian X., et al. , “Design and characterization of a spatially distributed multibeam field emission x-ray source for stationary digital breast tomosynthesis,” Med. Phys. 36(10), 4389–4399 (2009). 10.1118/1.3213520 [DOI] [PMC free article] [PubMed] [Google Scholar]
- 22.Spronk D., et al. , “Feasibility of a stationary head CT scanner using a CNT x-ray source array,” Proc. SPIE 11312, 1131237 (2020). 10.1117/12.2549335 [DOI] [Google Scholar]
- 23.Sidky E. Y., Kao C.-M., Pan X., “Accurate image reconstruction from few-views and limited-angle data in divergent-beam CT,” J. X-Ray Sci. Technol. 14(2), 119–139 (2006). [Google Scholar]
- 24.Sidky E. Y., Pan X., “Image reconstruction in circular cone-beam computed tomography by constrained, total-variation minimization,” Phys. Med. Biol. 53(17), 4777 (2008). 10.1088/0031-9155/53/17/021 [DOI] [PMC free article] [PubMed] [Google Scholar]
- 25.Tian Z., et al. , “Low-dose ct reconstruction via edge-preserving total variation regularization,” Phys. Med. Biol. 56(18), 5949 (2011). 10.1088/0031-9155/56/18/011 [DOI] [PMC free article] [PubMed] [Google Scholar]
- 26.Liu Y., et al. , “Adaptive-weighted total variation minimization for sparse data toward low-dose x-ray computed tomography image reconstruction,” Phys. Med. Biol. 57(23), 7923 (2012). 10.1088/0031-9155/57/23/7923 [DOI] [PMC free article] [PubMed] [Google Scholar]
- 27.Luo Y., et al. , “Simulation and optimization of system configuration for the stationary head CT using CNT x-ray source array: reconstruction and quality evaluation,” Proc. SPIE 11312, 1131238 (2020). 10.1117/12.2549996 [DOI] [Google Scholar]


