

Abstract
Lysine acetylation plays vital roles in the regulation of fundamental cellular processes, which is mediated by lysine acetyltransferases (KATs). Developing chemical biology probes for KAT activity detection is of important value in providing improved understanding of their biological functions. We reported a panel of “turn-on” fluorescent probes for sensitive and selective detection of KAT enzymatic activity through a simple mix-and-read format. Combined with bioorthogonal substrate labelling and click chemistry, these probes produced strong “turn-on” fluorescent signals in response to KAT-mediated acylation process. This chemical biology strategy diversifies the assay toolboxes to investigate functions and mechanisms of acetyltransferase enzymes.
Acetylation of lysine residues in proteins represents a pivotal post-translational modification (PTM) conserved from prokaryotes to yeasts and higher organisms. Lysine acetyltransferases (KATs) and lysine deacetylases (KDACs) are two types of enzymes with opposing activities that fine tune the dynamic homeostasis of lysine acetylation.1 Since their genetic identification in the mid-1990s, KATs have been extensively studied in aspects of structural characterization, biochemical properties, and functions in physiology and pathology. Mounting evidence reveals that dysregulation of KATs is causative to the pathogenesis of many human diseased phenotypes, including neurodegenerative disorders, inflammation, diabetes, and cancer.2-4
Chemical biology probes that detect and quantify KAT activities are essential tools for understanding the scope and depth of acetyltransferase biology.5,6 Because of the chemically inert nature of the acetyl group, direct detection of KAT-medicated protein acetylation has been technically challenging, which typically relies on either radioisotope labeling or antibody recognition. The radiometric assays have satisfying sensitivity and reliability.7,8 However, radiometric assays suffer from issues such as high cost of radioactive materials, radioactive hazard concerns, and experimental inflexibility (i.e. discontinuous endpoint measurement). Non-radioactive spectroscopic methods such as fluorescent assays, have been explored as alternative strategies.6,9,10 However, almost all fluorescent methods detect KAT activity by examining the formation of byproduct CoA through either enzyme or chemical reagent coupling. Drawbacks such as background fluorescence, inner filter effect, and incapability for in vivo detection limit their biological applications.
We and others recently explored the bioorthogonal strategy that utilizes synthetic acetyl-CoA analogs and engineered KAT enzymes to provide a chemically maneuverable technology to interrogate substrate profiles of KAT enzymes.11-13 As an extension of the bioorthogonal labeling strategy, here we created a set of small molecule nitrobenzoxadiazole (NBD) probes to achieve mix-and-read, “turn-on” fluorescence detection of KAT activities. The design takes advantage of the principles that: (1) nucleophilic amino acid residues (lysine, arginine) abundantly exist in histone and non-histone proteins; (2) acetyl-CoA surrogates such as 3-azidopropanoyl CoA (3AZ-CoA) can be excellent bioorthogonal cofactors of specific wild-type or engineered KAT enzymes; and (3) oxygen-linked NBD unit (O-NBD) is non-fluorescent, while nitrogen-linked NBD unit (N-NBD) exhibits strong fluorescence in the wavelength range of 520–550 nm. As a potential fluorophore precursor, the NBD unit has little interference on the ligand–target interaction due to its small size and planar structure. The unique fluorescence-switchable property of NBD makes it a good candidate for probe design,14-16 which was recently applied to study KDAC activities.15,16 We report here the first application of NBD-based probes to detect KAT activity through integral alignment of bioorthogonal acylation labeling, alkyne–azide click chemistry, and “turn-on” fluorescence. As illustrated in Scheme 1, upon KAT-catalyzed bioorthogonal acylation, 3-azidopropanoyl group is transferred from 3AZ-CoA to the substrate, which is further conjugated to an alkynyl-O-NBD probe through click chemistry. This event would subsequently trigger a proximity-promoted intramolecular nucleophilic substitution of O-NBD by free amines of adjacent lysine residues in the substrate and thus turn on the fluorescence of the resulting N-NBD motif.
Scheme 1.

Illustration of the bioorthogonal “turn-on” fluorescence strategy for KAT activity detection.
As a proof of concept, we chose p300 as the KAT enzyme to design the bioorthogonal “turn-on” fluorescent probes for KAT activity detection. p300 was previously shown to utilize bulky acetyl-CoA surrogates such as 3AZ-CoA to modify histone substrates.12,13 Giving that the length of the linker in the NBD probe may affect the efficiency of intramolecular N-substitution reaction, two propargyl NBD probes (PN-1 and PN-2) bearing different lengths of linkers were synthesized from NBD fluoride (NBD-F) (Fig. 1a and Schemes S1, S2, ESI†).15 Briefly, NBD-F was treated with propargyl alcohol or PTG-1 under basic condition to yield PN-1 and PN-2, respectively.
Fig. 1.

Synthetic route and click reaction time dependent spectral study of the O-NBD probes. (a) Synthesis of PN-1 and PN-2. (b) Fluorescence change of PN-1 (5 μM) and PN-2 (5 μM) with or without adding p300 as a function of click reaction time. H4(1-21) peptide: 5 μM, 3AZ-CoA: 10 μM, p300: 0.2 μM. λex = 485 nm. λem = 545 nm. (c) Absorption spectra of PN-2 with and without adding p300. Enzymatic reaction time was 30 min. Click reaction time was 2 h.
Before testing our designed assay strategy on KAT activity detection, we first studied the fluorescent responses of PN-1 with the chemical components present in the KAT reaction and the subsequent click reaction. As shown in Fig. S1a and b (ESI†), the fluorescence intensity of PN-1 (10 μM) is similar to NBD-F and remained unchanged upon addition of either HEPES buffer (pH 8.0) or 3AZ-CoA, while addition of H4(1-21) substrate peptide (N-terminal 21 residues of histone H4 protein, for full sequence see the ESI†) brought to a slight increase of the fluorescence intensity. In contrast, when the H4(1-21) peptide was first reacted with 3AZ-CoA in the presence of p300, then treated with PN-1 together with click reaction cocktail, a dramatic increase of fluorescence signals was observed (Fig. S1b, ESI†). The results demonstrated that the fluorescence of PN-1 was selectively turned on only by reacting with the acylated substrate. We then explored the “turn-on” fluorescent responses with respect to the click/N-intramolecular substitution reaction time. In the model study, H4(1-21) was used as the KAT substrate, 3AZ-CoA as the cofactor, and p300 as the KAT enzyme. The KAT enzymatic reaction was allowed to proceed under ambient temperature for 30 min and then the click reaction cocktail in DMSO containing PN-1 was added. The fluorescence signals were recorded during further incubation at room temperature. As shown in Fig. 1b, the fluorescence signals were weak initially, then increased pronouncedly during incubation and plateaued at 2 h. In contrast, fluorescence signals of the control group without the treatment of p300 stayed at a very low level. For PN-2, the fluorescence increase was slightly higher than that of PN-1 with the addition of p300, while remained unchanged for the negative control. Likely, the PEG linker in PN-2 has a higher degree of flexibility and hydrophilicity that helps to reduce the nonspecific intermolecular N-substitution reactions.14-16
Absorption spectral changes of PN-2 upon KAT acylation reaction were also measured. As seen in Fig. 1c, the spectrum of the reaction mixture containing PN-2 without the treatment of p300 at enzymatic acylation stage showed a strong absorption peak at 380 nm, which corresponded to the maximum absorption wavelength of the O-NBD group.16 In contrast, when the enzymatic reaction was performed in the presence of p300, a new absorption peak appeared at 485 nm, which corresponded to the maximum absorption peak of N-NBD group. These experiments together demonstrated that the fluorescence of NBD can be turned on as a function of click reaction time only together with the occurrence of bioorthogonal KAT labeling. We also tested the fluorescence responses of PN-2 to the acylation of human H3 protein by p300. As expected, the fluorescence spectra showed a steady increase as a function of CuAAC/N-substitution reaction time (Fig. S2, ESI†).
To further demonstrate that the fluorescence enhancement was caused by O-NBD to N-NBD transformation through reacting with the adjacent amine groups in the substrate, we prepared H4(1-21) peptide with a 3AZ group on its K16 lysine residue [H4(1-21)K163AZ] and performed click reaction with PN-2 at pH 2.0 (Fig. S3a, ESI†). After click reaction (3 h), the pH was adjusted to 8.0 to allow the intramolecular substitution reaction to occur. The process was monitored by HPLC (Fig. S3b, ESI†). At pH 2.0, no further reaction occurred after the click cycloaddition because amine residues on the substrate peptide were protonated so that intramolecular N-substitution was hindered. After increasing the pH to 8.0, however, amine groups on the substrate were activated which led to the nucleophilic attack on the O-NBD group. Indeed, two new peaks formed on the HPLC chromatogram, which possessed the same mass value (Fig. S3 and S4, ESI†). We also measured the absorption spectra of the reaction solution at pH 2.0 and 8.0. Our observation showed that the maximum absorption wavelength shifted from 380 nm to 485 nm after pH adjustment (Fig. S3c, ESI†), which corresponded to the maximum absorption wavelength of the O-NBD and N-NBD group, respectively.16 By contrast, PN-2 at two different pH conditions showed identical absorption spectrum (380 nm), which demonstrated that the absorption spectral change was not caused by pH (Fig. S3d, ESI†). These results together proved our hypothesized click chemistry/N-intramolecular substitution two-step reaction mechanism.
Next, we explored the suitability of PN-2 as a fluorescent reporter to quantify KAT activity. We first tested the fluorescence response of PN-2 corresponding to KAT reaction time. For the p300-catalyzed KAT reaction, the enzymatic process was quenched at different time points with the addition of the click reaction cocktail containing PN-2. As expected, the fluorescence signals displayed a linear increase with time over the course of 50 min, with a total of 3.2-fold increase (Fig. S5a, ESI†). The fluorescence signals in response to varying enzyme concentrations were also conducted. As p300 concentrations increased from 0 to 0.32 μM, the fluorescence intensity increased linearly by 6.5-fold (Fig. 2a and Fig. S5b, ESI†). These results support that this ‘turn-on” fluorescent assay offers a quantitative approach to detect KAT catalyzed acylation reaction.
Fig. 2.
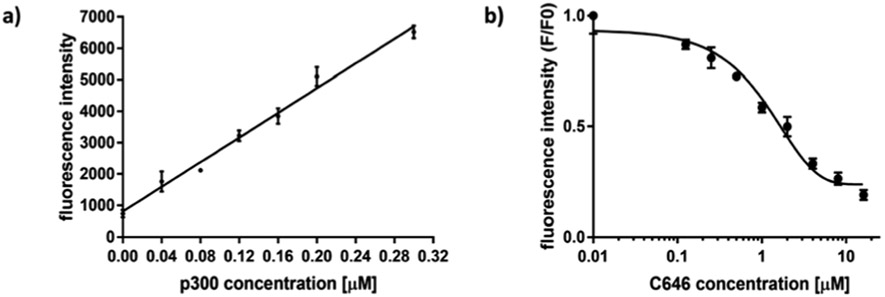
Turn-on fluorescence of p300 catalyzed acylation. (a) p300 concentration dependent fluorescence change of PN-2. PN-2: 5 μM, H4(1-21): 5 μM, 3AZ-CoA: 5 μM. Enzymatic reaction time was 30 min and “click” reaction time was 3 h. (b) Measurement of C646 potency for p300 inhibition.
We also investigated the capability of PN-2 to quantify the potency of p300 inhibitors by exposing p300 to a known selective small-molecule KAT inhibitor, C646. Different concentrations of C646 were pre-incubated with p300 for 30 min prior to the addition of H4(1-21) peptide and 3AZ-CoA. The enzymatic reaction was allowed to occur for 1 h, then the click reaction cocktail containing PN-2 was added to quench the enzymatic reaction and initiate the click reaction at the meantime. The dose-dependent fluorescence signals were measured (Fig. 2b and Fig. S5c, ESI†) and the data points were fitted to the Hill equation (eqn (S1), ESI†). The IC50 value was calculated to be 1.8 ± 0.1 μM, which was similar to the value reported in the literature.17 These data clearly proved that the detection platform is effective for quantitative KAT inhibitor evaluations.
With the above encouraging results, we performed fluorescence imaging experiments to examine the labeling efficiency of 3AZ-CoA on the cellular proteome by PN-1 and PN-2. Human embryonic kidney (HEK) 293T cell lysate was incubated with p300 and 3AZ-CoA, followed by CuAAC click reaction to tag 3AZ-labeled proteins with PN-2. As shown in Fig. 3, treatment of the cell lysate with 3AZ-CoA in the presence of p300 and PN-2 resulted in strong fluorescence signals, indicating efficient labeling of protein substrates with the 3AZ group (lane 1). In contrast, the absence of p300 resulted in very weak fluorescence signals that were close to the negative control without PN-2 (lane 2 and 4). Similar result was observed when without 3AZ-CoA treatment (lane 3). Additionally, the fluorescence signals became modestly weaker in the presence of inhibitor C646 (5 μM) (lane 5), and stronger when increasing the concentration of p300 (lane 6). The modest effect of C646 may attribute to the high electrophilicity of pyrazolone-furan that lowers its KAT inhibitory activity in cell lysate mixtures.18 NBD-F was also tested as a replacement of PN-2 and as expected, no fluorescence was observed (lane 7). Combined, these data support that the O-NBD group is essential for the “turn-on” fluorescence, and PN-2 can be used as a specific reporter to visualize p300 catalyzed histone acylation in vitro. Analogously, the fluorescence response of PN-1 towards HEK 293T cell lysate acylation showed consistent “turn-on” fluorescence results, though the fluorescence signals are slightly lower than that of PN-2 (Fig. S6, ESI†). The lower labelling efficiency of PN-1 than PN-2 is consistent with the result shown in Fig. 1. Also given that the labeling pattern of PN-1 in the in-gel fluorescence imaging seems to be a bit different from PN-2 (Fig. 3 vs. Fig. S6, ESI†), it is quite clear that the flexible and hydrophilic PEG linker in PN-2 plays a role in fine tuning the N-substitution reaction of the NBD group with proximal amine groups.
Fig. 3.

In-gel fluorescence imaging of protein labelling in 293T cell lysate by PN-2. Labelling condition: cell lysate 20 μg, 3AZ-CoA 100 μM, p300 1.2 μM, PN-2 150 μM. ++ double the concentration of p300. * NBD-F was used instead of PN-2.
Although with tremendous success in different areas of chemistry, the cytotoxicity of copper, however, is a potential disadvantage of the CuAAC reaction for biomedical applications.19 Therefore, strain-promoted alkyne–azide cycloaddition (SPAAC) reaction has been used as the alternative for biocompatible labeling. With this idea in mind, a strained O-NBD probe PN-3 was synthesized in one-step from BCN-1 with moderate yield (25%) (Fig. 4a). PN-3 displayed low background fluorescence signals that were similar to PN-1, PN-2 and NBD-F (Fig. S1a, ESI†). In-gel fluorescence visualization was conducted to examine the labeling efficiency of PN-3 in vitro (Fig. 4b). Clearly, PN-3 exhibited specific selectivity towards 3AZ-labeled proteins (Fig. 4b, lane 1), this was further corroborated by negative control experiments in which either p300, 3AZ-CoA or PN-3 was omitted from the reaction mixture (Fig. 4b, lane 2–4), or with the addition of KAT inhibitor C646 (Fig. 4b, lane 5). Additionally, stronger fluorescence signals were observed when the concentration of either PN-3 or p300 was increased (Fig. 4b, lanes 6 and 7).
Fig. 4.

(a) Synthesis of PN-3. (b) In-gel fluorescence imaging of protein labeling in 293T cell lysate by PN-3. Labeling condition: cell lysate 20 μg, 3AZ-CoA 100 μM, p300 1.2 μM, PN-3 300 mM. ++ double the concentration of PN-3 or p300.
Altogether, we designed smart O-NBD probes as “turn-on” fluorescence reporters to achieve sensitive fluorescent detection of p300 enzymatic activity. In combination with bioorthogonal acylation, alkyne–azide click chemistry, and proximity-promoted intramolecular substitution reaction, this technological platform serves as an enabling technology for the detection, quantification, and imaging of KAT activities. While several fluorescent methods have been explored for KAT study,6,20-22 the mix-and-read, “turn-on” fluorescence strategy reported herein does not need enzymatic coupling or product separation, and is free of washing procedure, thus greatly reducing assay complexity and expanding throughput capacity. We anticipate this activity-based chemical labeling strategy will find great application in exploring and imaging activities of acetyltransferases.
Supplementary Material
Footnotes
Conflicts of interest
There are no conflicts to declare.
Electronic supplementary information (ESI) available. See DOI: 10.1039/c8cc02987c
Notes and references
- 1.Drazic A, Myklebust LM, Ree R and Arnesen T, Biochim. Biophys. Acta, 2016, 1864, 1372–1401. [DOI] [PubMed] [Google Scholar]
- 2.Yang XJ, Nucleic Acids Res., 2004, 32, 959–976. [DOI] [PMC free article] [PubMed] [Google Scholar]
- 3.Iyer A, Fairlie DP and Brown L, Immunol. Cell Biol, 2012, 90, 39–46. [DOI] [PubMed] [Google Scholar]
- 4.Dekker FJ and Haisma HJ, Drug Discovery Today, 2009, 14, 942–948. [DOI] [PubMed] [Google Scholar]
- 5.Cole PA, Nat. Chem. Biol, 2008, 4, 590–597. [DOI] [PMC free article] [PubMed] [Google Scholar]
- 6.He M, Han Z, Liu L and Zheng YG, Angew. Chem., Int. Ed, 2018, 57, 1162–1184. [DOI] [PubMed] [Google Scholar]
- 7.Aherne GW, Rowlands MG, Stimson L and Workman P, Methods, 2002, 26, 245–253. [DOI] [PubMed] [Google Scholar]
- 8.Berndsen CE and Denu JM, Methods, 2005, 36, 321–331. [DOI] [PubMed] [Google Scholar]
- 9.Ma F and Zhang CY, Expert Rev. Mol. Diagn, 2016, 16, 297–306. [DOI] [PubMed] [Google Scholar]
- 10.Luan Y, Ngo L, Han Z, Wang X, Qu M and Zheng YG, in Epigenetic Technological Applications, ed. Zheng YG, Academic Press, San Diego, 2015, ch. 14, pp. 291–317. [Google Scholar]
- 11.Yang Y-Y, Ascano JM and Hang HC, J. Am. Chem. Soc, 2010, 132, 3640–3641. [DOI] [PMC free article] [PubMed] [Google Scholar]
- 12.Yang C, Mi J, Feng Y, Ngo L, Gao T, Yan L and Zheng YG, J. Am. Chem. Soc, 2013, 135, 7791–7794. [DOI] [PMC free article] [PubMed] [Google Scholar]
- 13.Han Z, Chou CW, Yang X, Bartlett MG and Zheng YG, ACS Chem. Biol, 2017, 12, 1547–1555. [DOI] [PubMed] [Google Scholar]
- 14.Yamaguchi T, Asanuma M, Nakanishi S, Saito Y, Okazaki M, Dodo K and Sodeoka M, Chem. Sci, 2014, 5, 1021–1029. [Google Scholar]
- 15.Gober IN and Waters ML, J. Am. Chem. Soc, 2016, 138, 9452–9459. [DOI] [PubMed] [Google Scholar]
- 16.Xie Y, Ge J, Lei H, Peng B, Zhang H, Wang D, Pan S, Chen G, Chen L, Wang Y, Hao Q, Yao SQ and Sun H, J. Am. Chem. Soc, 2016, 138, 15596–15604. [DOI] [PubMed] [Google Scholar]
- 17.Bowers EM, Yan G, Mukherjee C, Orry A, Wang L, Holbert MA, Crump NT, Hazzalin CA, Liszczak G, Yuan H, Larocca C, Saldanha SA, Abagyan R, Sun Y, Meyers DJ, Marmorstein R, Mahadevan LC, Alani RM and Cole PA, Chem. Biol, 2010, 17, 471–482. [DOI] [PMC free article] [PubMed] [Google Scholar]
- 18.Shrimp JH, Sorum AW, Garlick JM, Guasch L, Nicklaus MC and Meier JL, ACS Med. Chem. Lett, 2016, 7, 151–155. [DOI] [PMC free article] [PubMed] [Google Scholar]
- 19.Merker K, Hapke D, Reckzeh K, Schmidt H, Lochs H and Grune T, BioFactors, 2005, 24, 255–261. [DOI] [PubMed] [Google Scholar]
- 20.Gao T, Yang C and Zheng YG, Anal. Bioanal. Chem, 2013, 405, 1361–1371. [DOI] [PMC free article] [PubMed] [Google Scholar]
- 21.Han Y, Li P, Xu Y, Li H, Song Z, Nie Z, Chen Z and Yao S, Small, 2015, 11, 877–885. [DOI] [PubMed] [Google Scholar]
- 22.Duval R, Fritsch L, Bui LC, Berthelet J, Guidez F, Mathieu C, Dupret JM, Chomienne C, Ait-Si-Ali S and Rodrigues-Lima F, Anal. Biochem, 2015, 486, 35–37. [DOI] [PubMed] [Google Scholar]
Associated Data
This section collects any data citations, data availability statements, or supplementary materials included in this article.