Abstract
Background
Catechins are crucial in determining the flavour and health benefits of tea, but it remains unclear that how the light intensity regulates catechins biosynthesis. Therefore, we cultivated tea plants in a phytotron to elucidate the response mechanism of catechins biosynthesis to light intensity changes.
Results
In the 250 μmol·m− 2·s− 1 treatment, the contents of epigallocatechin, epigallocatechin gallate and total catechins were increased by 98.94, 14.5 and 13.0% respectively, compared with those in the 550 μmol·m− 2·s− 1 treatment. Meanwhile, the photosynthetic capacity was enhanced in the 250 μmol·m− 2·s− 1 treatment, including the electron transport rate, net photosynthetic rate, transpiration rate and expression of related genes (such as CspsbA, CspsbB, CspsbC, CspsbD, CsPsbR and CsGLK1). In contrast, the extremely low or high light intensity decreased the catechins accumulation and photosynthetic capacity of the tea plants.
The comprehensive analysis revealed that the response of catechins biosynthesis to the light intensity was mediated by the photosynthetic capacity of the tea plants. Appropriately high light upregulated the expression of genes related to photosynthetic capacity to improve the net photosynthetic rate (Pn), transpiration rate (Tr), and electron transfer rate (ETR), which enhanced the contents of substrates for non-esterified catechins biosynthesis (such as EGC). Meanwhile, these photosynthetic capacity-related genes and gallic acid (GA) biosynthesis-related genes (CsaroB, CsaroDE1, CsaroDE2 and CsaroDE3) co-regulated the response of GA accumulation to light intensity. Eventually, the epigallocatechin gallate content was enhanced by the increased contents of its precursors (EGC and GA) and the upregulation of the CsSCPL gene.
Conclusions
In this study, the catechin content and photosynthetic capacity of tea plants increased under appropriately high light intensities (250 μmol·m− 2·s− 1 and 350 μmol·m− 2·s− 1) but decreased under extremely low or high light intensities (150 μmol·m− 2·s− 1 or 550 μmol·m− 2·s− 1). We found that the control of catechin accumulation by light intensity in tea plants is mediated by the plant photosynthetic capacity. The research provided useful information for improving catechins content and its light-intensity regulation mechanism in tea plant.
Supplementary Information
The online version contains supplementary material available at 10.1186/s12870-021-03260-7.
Keywords: Light intensity, Photosynthetic capacity, Catechin biosynthesis, Tea plant
Background
Catechins, which are the major secondary metabolites in tea, promote the sensory qualities and health benefits of tea, including cancer prevention and antioxidant activity [1–3], neurodegenerative disease prevention and diabetes prevention [4, 5]. On the basis of whether the galloyl is attached to the C ring, catechins in tea plants have been divided into non-esterified catechins including catechin (C), epicatechin (EC), epigallocatechin (EGC) and esterified catechins including catechin gallate (CG), gallocatechin gallate (GCG), epicatechin gallate (ECG), epigallocatechin gallate (EGCG) [6]. As the major monomeric catechin in tea [7], EGCG is important for increasing the health benefits quality and flavor quality of tea [8, 9], such as cancer prevention [10–12], and blood sugar control [13].
Light is the core environmental factor affecting the growth and quality of tea [14, 15], As the necessary factor for all plant function, light affected flavonoid biosynthesis, which can protect plants under the high light conditions [16]. Significant advances have been made in the research on the enhancement of flavonoids, phenols and anthocyanins by high light intensity [17–24], whereas decreasing of those by shading treatments [25–27]. Previous study showed that the catechins content of tea plants at low altitudes, in summer and at the plains is higher than that at high altitudes, in other seasons and at the hills [28–32]. Light was important for catechins biosynthesis [33], and the catechins content decreased under darkness and shading treatments [14, 34–40], indicating that the lower light intensity probably limits the catechins accumulation.
The genes involved in catechins biosynthesis are related to the phenylalanine pathway, flavonoid pathway and shikimic acid pathway [41, 42]. Light intensity regulates gene expression to affect the catechins content. For example, shading repressed the expression of genes in the flavonoid pathway such as F3H, F3’H and DFR in tea plants [43], while light induced the expression of CHS, DFR1, DER2, ANS and ANR1 [44]. Meanwhile, the expression pattern of catechines-related genes (ANR, ANS, LAR, C4H, PAL, CHI, CHS and DFR) were related to high light intensity in summer [39]. However, the responses of catechins-related genes to light intensity changes have been inconsistent in previous studies. ANS plays a critical role in catechin biosynthesis in tea plants [45]: low light induces ANS1 expression in safflower flowers, whereas high light upregulated ANS expression in red leaf lettuce [46, 47]. The response of CsANS expression to light is also inconsisitent [35, 43]. We speculate that genes also are regulated by other environmental factors that are dynamic in the field.
Catechins content is also affected by other environmental factors in the field, and there remains relatively few studies regarding the response mechanisms of catechins biosynthesis in tea plants to light intensity. Our research used the same of environmental conditions between for five light treatments (150, 250, 350, 450, 550 μmol·m− 2·s− 1) to explore: 1) the effect of light intensity to catechins content; 2) the response of catechins biosynthesis to light intensity; and 3) the relationship between catechins content and photosynthesis.
Methods
Plant materials
Tea seedlings (Camellia sinensis (L.) O. Kuntze), which were one-year-old cuttings of the Huangdan cultivar, were purchased from the Qianhe Tea Cooperative, Anxi County, China. The seedlings were transplanted into breeding bags (diameter = 16 cm and height = 18 cm), and cultivated in the nursery of Sino-Science Photobiotech Co. from March to August 2019. The composition of the culture medium was coconut bran, peat soil, vermiculite and perlite, and the volume ratio was 2:2:1:1. The composition of the culture medium was optimised by the Sino-Science Photobiotech Co. to provide a good growth environment for the roots of tea plants. In September, we transported the seedlings indoors to adapt to the environment of the plant growth facility, and the culture conditions are described in the Supplementary Table 1. Three biological replicates, including 120 plants that were clipped according to a standard procedure, were randomly distributed among the light treatments on October 1, 2019. Half of the samples were dried in an oven in two stages (120 °C10 min, 90 °C30 min) and stored at − 20 °C, and the other half were immediately frozen in liquid nitrogen and stored at − 80 °C until further experiments.
Cultivation conditions
The tea seedlings used in this study were cultivated in a series of phytotrons under different conditions as shown in Supplementary Table 1. The nutrient solution was optimised as provided in Shigeki Konishi, Miyamoto, and Taki (1985), [48], and was provided by Sino-Science Photobiotech Company.
Photosynthetic pigments and parameters
The pigment content was measured by 95% ethanol extraction. Fresh leaves (0.2 g, accurate to 0.0001 g) were ground in a centrifuge tube, and then 25 ml 95% ethanol was added. The mixtures were placed in the dark for 24 h and shaken every 5-6 h. The supernatant was extracted and analysed with a spectrophotometer (Mapada, China), and the absorbance at the following wavelengths was recorded: 665 nm, 649 nm and 470 nm.
Chlorophyll fluorescence was measured with an Imaging-PAM (Heinz Walz, Effeltrich, Germany). Tea plants were dark-adapted for 30 min before the measurement, and the third mature leaf from the top was used for the measurements. The minimum fluorescence (Fo) and maximum fluorescence (Fm) were obtained by applying measuring light pulses at a low frequency. The yield of variable fluorescence (Fv) was calculated as Fm − Fo, from which the maximum PSII quantum yield (Fv/Fm) was automatically calculated by the ImagingWin software (Walz). Other parameters (NPQ, qP, ETR, Fm′, Fo’) were also automatically calculated by the ImagingWin software (Walz).
The photosynthesis characteristics including net photosynthetic rate (Pn), transpiration rate (Tr), stomatal conductance (Gs), and intercellular CO2 concentration (Ci), were measured using a Li-6800 portable photosynthesis system (LI-COR Inc., Lincoln, NE, USA). All measurements were conducted from 10:00 to 12:00 am. The irradiance and temperature of the leaf chamber were set according to the conditions in each treatment, and the results were recorded when Pn reached a steady state.
Catechin content determination
The catechins content determination was performed according to the method described by Lin et al. (2017) [49]. Catechins were determined by HPLC. Tea samples (0.2 g, accurate to 0.0001 g) were weighed into a 10 mL centrifuge tube, and 5 ml of 70% methanol solution heated in a water bath was added. After being shaken by a mixer, the tea was immediately transferred to a 70 °C water bath. The tea was immersed for 10 min and shaken once at 5 min, and the centrifuge tube was transferred to the centrifuge after 10 min (3500 r/min, 10 min). The residue combined with 5 ml of 70% methanol solution was extracted once, and the procedure was repeated as above. The combined extract volume was brought to 10 mL, shaken, and pour 1 ml liquor into a 10 mL volumetric flask with a pipette and brought to 10 mL with a stable solution. The mixture was then filtered with 0.45 μM membrane before being analysed by HPLC. The HPLC instrument was a Waters Acquity UPLC HSS T3 column (2.1 *100 mm, RP181.7 um) with a 35 °C column temperature.
Mobile phase A:100% pure water + 0.02% EDTA-2Na + 2% glacial acetic acid; Mobile phase B: 100% acetonitrile + 2% glacial acetic acid. PDA detection conditions: scanning range of 200 nm-400 nm, characteristic detection wavelength of 278 nm, scanning time of 10 min, injection volume of 2 ul. Standard stock solution is listed as follows: caffeine stock solution 2.00 mg/ml, gallic acid (GA) stock solution 0.100 mg/ml, catechin stock solution: C 1.00 mg/ml, EC 1.00 mg/ml, EGC 2.00 mg/ml, EGCG 2.00 mg/ml, ECG 2.00 mg/ml. All samples were analysed with three biological replicates, and the average values were used for data analysis.
RNA extraction and quantitative RT-PCR
Total RNA was isolated using the RNAprep Pure Plant Kit (DP441, TIANGEN Company, China) according to the operating instructions. First-strand cDNAs were synthesized using FastKing gDNA Dispelling RT SuperMix (KR118, TIANGEN Company, China). The qRT-PCR analyses were carried out on an ABI 7500 HT Real-time PCR system (ABI Company, USA). The PCR reaction conditions were as follows: incubation at 95 °C for 15 min, 40 cycles at 95 °C for 10s, and annealing at 61 °C for 32 s, in triplicate for each reaction. All primers used for qRT-PCR are listed in Supplementary Table 2, and β-Actin was used as an endogenous control in this assay. The expression levels of related genes were calculated using the 2−ΔΔCt method.
Statistical analyses
One-way analysis of variance was used to determine significance, and Duncan’s multiple range test was used to evaluate differences between groups with SPSS 21.0 statistical software. This software was also be used for the correlation analysis and regression analysis between the content of catechins and other variables. The data are presented as the means ± standard deviations from three biological replicates, and the different letters represent significant differences between groups (lowercase letters represent a significant difference, and uppercase letters represent an extremely significant difference).
Principal component analysis (PCA) of nine morphological traits was performed using the SIMCA 13.0 software with the nine variables as the primary ID and the treatments as the second ID. The figure legend indicates the representation of the three biological replicates.
Partial least square (PLS) analysis was performed using the Minitab 16 software, and the confidence level was set to 95%. The r-squared value represents the degree of fitting between the measured ranking and predicted ranking in PLS.
Results
Light intensity controlled catechins accumulation and related gene expression
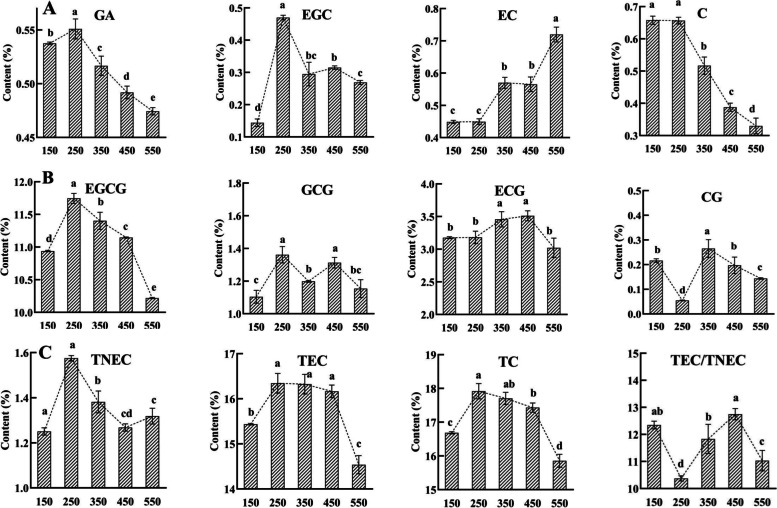
When tea plants were grown in the same environment at different light intensities, the contents of EGCG, gallic acid (GA) and total catechins (TC) under an appropriately high light intensity (250 μmol·m− 2·s− 1) were significantly higher than those under extremely high and low light intensities (550 μmol·m− 2·s− 1 and 150 μmol·m− 2·s− 1), which suggested that an appropriately high light intensity promoted catechins accumulation.
The contents of the precursor of esterified catechins biosynthesis, non-esterified catechins and gallic acid (GA), were the highest in the 250 μmol·m− 2·s− 1 treatment, and the contents of gallic acid (GA), total non-esterified catechins (TNEC), EGC and C were 16.16, 74.73, 98.94 and 19.50% higher than those in 550 μmol·m− 2·s− 1 treatment, respectively (Fig. 1). When grown under the different light intensity treatments, the contents of EGCG, total esterified catechins (TEC) and total catechins (TC) in tea plants exhibited a similar response pattern, reaching maxima in the highest in 250 μmol·m− 2·s− 1 treatment, decreased with the 350, 450 and 150 μmol·m− 2·s− 1 treatments, and reaching minima in the lowest in 550 μmol·m− 2·s− 1 treatment. These results implied that appropriately high light increased the catechins content by enhancing the contents of the precursor of esterified catechins biosynthesis.
Fig. 1.
Catechins content is controlled by light intensity. A, B and C represent the content non-esterified catechins, esterified catechins and total catechins, respectively.150,250,350,450,550 represent the treatment of 150, 250, 350, 450, 550 μmol·m− 2·s− 1 light intensity
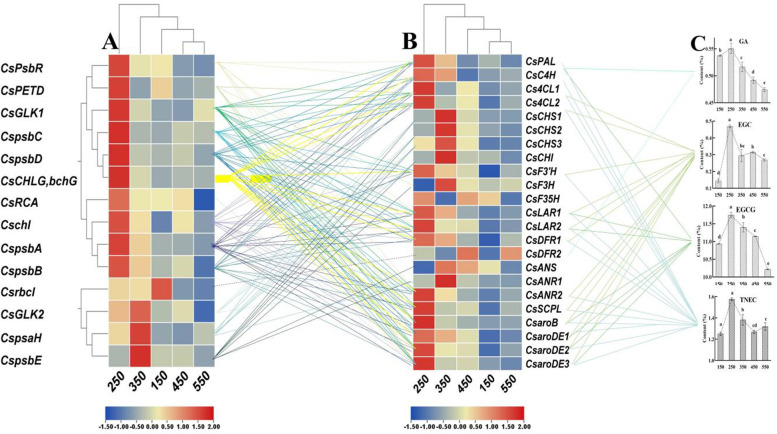
Similar to the accumulation patterns of catechins content, the expression of 14 catechins-related genes (CsPAL, CsC4H, Cs4CL1, Cs4CL2, CsF3’H, CsLAR1, CsLAR2, CsDFR1, CsANR2, CsSCPL, CsaroB, CsaroDE1, CsaroDE2 and CsaroDE3) was the highest in the 250 μmol·m− 2·s− 1 treatment but was suppressed in the extremely high and low light intensity (550 μmol·m− 2·s− 1 and 150 μmol·m− 2·s− 1). Notably, the response patterns of 8 catechins-related genes to the light intensity changes were similar to those of the content of EGCG, TEC and TC (Fig. 6, Supplemental Fig. 2). These results demonstrated that appropriately high light intensity increased the catechins content by inducing the expression of catechins-related genes, whereas extremely high or low light intensity suppressed those expressions and decreased catechins content.
Fig. 6.
Gene related to photosynthesis capacity regulated the expression of catechins-related genes and then mediated the response of catechins content to light intensity. A, B, and C represent genes expression related to photosynthesis capacity, catechins-related genes expression, and the catechins content. Solid lines represents the person> 0.7 and significance< 0.005, and the dotted line represents the person<− 0.7 and significance< 0.005
Light intensity controlled photosynthetic capacity and related gene expression
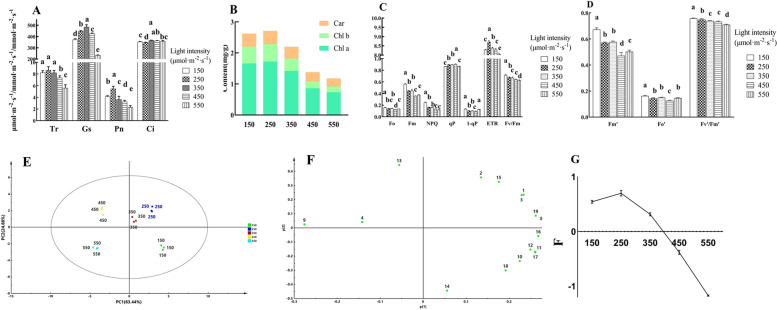
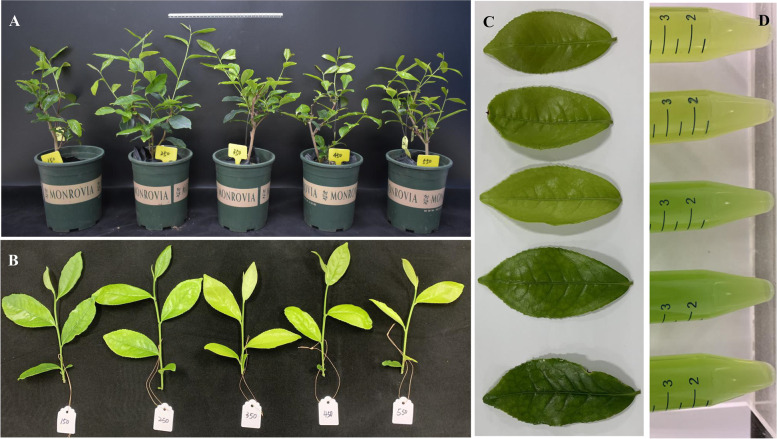
Photosynthesis-related parameters were significantly affected by light intensity. Appropriately high light (250 μmol·m− 2·s− 1) resulted in the highest photosynthetic rate (Pn), transpiration rate (Tr) and electron transport rate (ETR), which were 130.49, 53.88 and 8.10% higher than those at 550 μmol·m− 2·s− 1, respectively (Fig. 2A, C). The chlorophyll a (Chla), chlorophyll b (Chlb) and carotenoid (Car) contents increased under the 150 μmol·m− 2·s− 1 and 250 μmol·m− 2·s− 1 treatments but decreased under the 450 μmol·m− 2·s− 1 and 550 μmol·m− 2·s− 1 treatments, which was in agreement with the observed leaf colour of the tea plants (Fig. 2B, Fig. 3). All of the photosynthesis-related parameters decreased in the 550 μmol·m− 2·s− 1 treatment, but chlorophyll fluorescence parameters were higher in the 150 μmol·m− 2·s− 1 treatment. These results suggested the accelerated photosynthesis of tea plants under appropriately high light.
Fig. 2.
Photosynthesis capacity is controlled by light intensity. A and B represent the photosynthesis parameters and photosynthetic pigment content; C and D represent chlorophyll fluorescence under different light intensities. E is the score plot of PCA, and 150,250,350,450,550 represents the treatment of 150, 250,350,450,550 μmol·m− 2·s− 1 light intensity. F is the loading plot of PCA,and the corresponding indexes of the numbers are as follows: 1 = Pn, 2 = Tr, 3 = Gs, 4 = Ci, 5 = Chla, 6 = Chlb, 7 = Car, 8 = Chla+b, 9 = Chla/b, 10 = Fo, 11 = Fm, 12 = NPQ, 13 = qP, 14 = 1-qP, 15 = ETR, 16 = Fv/Fm, 17 = Fm′, 18 = Fo’, 19 = Fv’/Fm′. G represents photosynthesis capacity
Fig. 3.
Phenotypes of the tea plant under different light treatments. From left to right and from top to bottom, they represent the treatment of 150, 250,350,450,550 μmol·m− 2·s− 1
The 19 photosynthesis-related parameters were analysed by PCA, and the cumulative contribution rate of the first three principal components were 95.49% (F1, F2, F3 and F represent the score of principal components 1, 2, 3 and the comprehensive evaluation in the model). The scattered tea samples grown under the different light intensities in the PCA score plot and the score of comprehensive evaluation (F) in the model demonstrated the diverse photosynthesis capacities of the different treatments (Fig. 2E). F was the highest in the 250 treatment but gradually decreased with the increasing light intensity from the 350 μmol·m− 2·s− 1 to 550 μmol·m− 2·s− 1 treatment (Fig. 2G), which meant extremely high light intensity exceeding the light saturation point inhibited photosynthesis of tea plants. Accordingly, we deduced that appropriately high light enhanced the photosynthetic capacity of tea plants.
Similar to the response pattern of the photosynthetic capacity, appropriately high light (250 μmol·m− 2·s− 1) upregulated the expression of 9 photosynthesis-related genes (CspsbA, CspsbB, CspsbC, CspsbD, CsPsbR, CsGLK1, Cschl, CsCHLG, bchG, CsRCA and CsPETD; Fig. 6A, Supplemental Fig. 2), and the response patterns of 6 genes expression were similar to those of Pn and Tr. Thus, appropriately high light resulted in higher photosynthetic capacity by upregulating the expression of related genes, whereas the suppressed expression of those genes resulted in slower photosynthesis in tea plants under excessively high light intensity.
Photosynthetic capacity positively regulated the response of catechins biosynthesis to light intensity in tea plants
Catechins accumulation was related to photosynthetic capacity
The results of regression and correlation analysis indicated that the catechins accumulation and photosynthetic capacity of tea plants under different light intensities were closely related: the contents of EGCG, TEC and TC were regulated by photosynthetic capacity, while the non-esterified catechins content was significantly related to the photosynthetic pigments content.
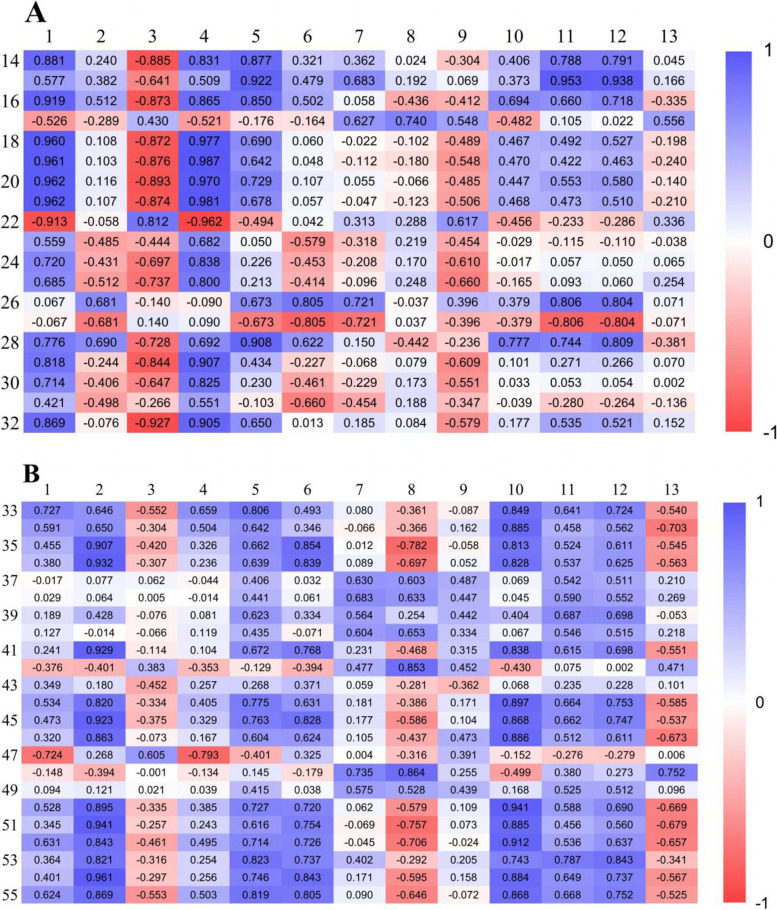
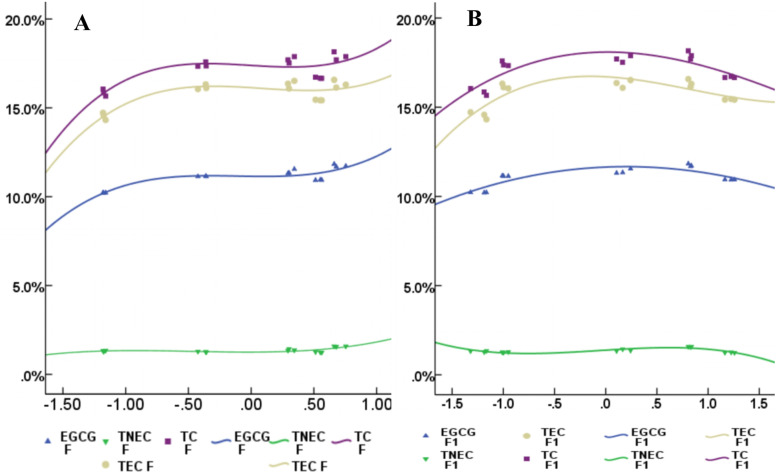
Correlation analysis suggested that the precursors for synthesizing esterified catechins (GA and C) were significantly and positively related to the photosynthetic pigment content (Chla, Chlb, Car and F1), but the contents of EGCG, TEC and TC were significantly and positively related to chlorophyll fluorescence (qP, ETR, Fv’/FM’) and photosynthetic capacity (Fig. 4A). Meanwhile, a cubic function described the relationship between the contents of EGCG, TEC, TC and F, F1, but the R2 of the equation between TNEC and F1 (67.0%, Fig. 5B) was higher than that between TNEC and F (47.9%, Fig. 5A, Supplemental Table 3), indicating that esterified catechins were affected by photosynthetic capacity, whereas non-esterified catechins were mostly regulated by photosynthetic pigments. Using partial least squares analysis, a high degree of model fit could be detected between catechins content and photosynthetic parameters (R2 > 80%, Supplemental Fig. 1), which suggested that the response of catechins content, especially EGCG to light intensity was related to the photosynthetic capacity of tea plants.
Fig. 4.
The correlation between catechins content and photosynthesis-related indexes and catechins-related genes expression, and the corresponding indexes of the numbers were shown in the supplemental data 2
Fig. 5.
The curve fitting between catechins content and photosynthesis capacity under different light intensities. A represents the curve fitting between F and EGCG, TNEC, TC respectively; B represents the curve fitting between F1 and EGCG, TNEC, TC respectively
Photosynthesis-related genes and catechins biosynthesis-related genes co-regulated the response of catechins accumulation to light intensity
The response of catechins-related genes to light intensity was regulated by gene expression related to photosynthetic capacity. The expression of 34 photosynthesis- and catechin-related genes was the highest under the 250 or 350 treatment, and the expression patterns under different treatments of 4 photosynthesis-related genes (CspsbE, CspsbC, CspsbD, CsCHLG, bchG) were similar to those of 3 catechins-related genes (CsCHI, CsaroB, CsaroDE3).
The expression levels of catechins-related genes involved in the phenylalanine pathway (CsPAL, CsC4H, Cs4CL1, Cs4CL2) were positively related to PSII-related genes (CspsbA, CspsbB, CspsbC, CspsbD, CspsbR) and ETR-related genes (CsPETD), clustering in one group (Fig. 6A, B, supplemental Fig. 2). Moreover, the expression levels of catechins-related genes in the downstream of flavonoid pathway (CsLAR2, CsDFR1, CsDFR2, CsANS, CsANR2) and in the shikimic acid pathway (CsaroB, CsaroDE1, CsaroDE2, CsaroDE3) were positively correlated with those of chlorophyll-related genes (CsGLK1, CsGLK2, CsCHLG, bchG). In contrast, the expression levels of CsRCA and Csrbcl were negatively related to CsF35H and CsANR1, respectively.
Gene expression was related to catechins biosynthesis, which was regulated by photosynthesis-related genes and thereby controls catechins accumulation (Fig. 6C). For example, the contents of EGCG, TEC and TC were positively regulated by the expression of catechins-related genes in the phenylalanine pathway (CsPAL, Cs4CL2, CsCHS2, CsCHS3, CsCHI), the downstream of flavonoid pathway (CsLAR2, CsDFR1, CsDFR2, CsANS, CsANR2) and the shikimic acid pathway (CsaroB, CsaroDE1, CsaroDE2, CsaroDE3).
Mechanisms underlying photosynthesis-regulated catechins accumulation
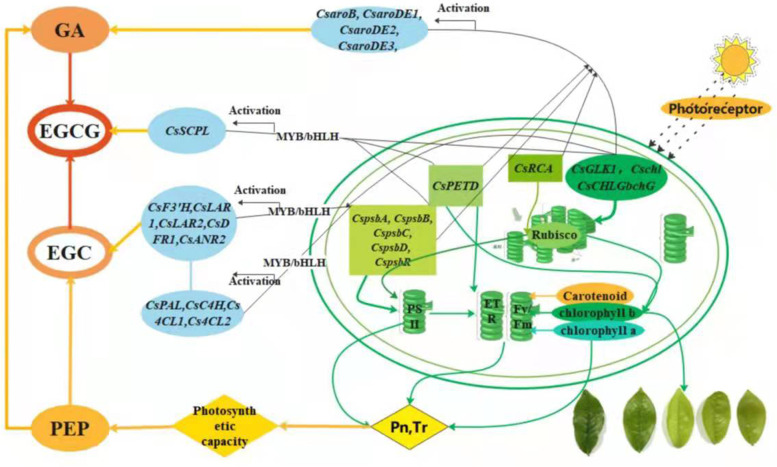
Photosynthate is the substrate for catechins synthesis. On the one hand, the expression of photosynthesis-related genes affected the photosynthesis capacity of tea plants, including Pn, Tr, and ETR, and thereby regulated the content of substrate for catechins biosynthesis. On the other hand, genes related to photosynthetic capacity regulated the expression of catechins-related genes by the promoter of structural genes and transcription factors and thereby affected the catechins content of tea plants (Fig. 7).
Fig. 7.
The mechanism of the response of catechins biosynthesis to light intensity changes by photosynthesis capacity. Pn = Net photosynthetic rate; Tr = Transpiration rate; EGC = Epigallocatechin; GA = Gallic acid; EGCG = Epigallocatechin gallate; PEP = phosphoenolpyruvate
The appropriately high light intensity upregulated the expression of genes related to PSII (CspsbA, CspsbB, CspsbC, CspsbD, CsPsbR), photosynthetic pigments (CsGLK1, Cschl, CsCHLGbchG), electron transfer rate (CsPETD), and Rubisco activity (CsRCA), which enhanced the photosynthetic capacity of tea plants, including the net photosynthetic rate (Pn), transpiration rate (Tr), and electron transfer rate (ETR). On the other hand, the genes related to PSII and photosynthetic pigments regulated the the expression of genes related to non-esterified catechins biosynthesis (CsPAL, CsC4H, Cs4CL1, Cs4CL2, CsF3’H, CsLAR1, CsLAR2, CsDFR1, CsANR2). These results suggested that the substrate content (such as PEP) and the expression of genes related non-esterified catechins biosynthesis, which were regulated by the genes related to photosynthesis capacity, co-affected the content of non-esterified catechins (such as EGC). Meanwhile, these photosynthesis-related genes also regulated the expression of gallic acid (GA) biosynthesis genes in the shikimic acid pathway (CsaroB, CsaroDE1, CsaroDE2, CsaroDE3) to affect the GA content. Eventually, the increased contents of the precursor of esterified catechins (EGC and GA) and the upregulation of CsSCPL were mediated by the photosynthetic capacity and the related genes in the tea plant, which promoted the accumulation of esterified catechins (such as EGCG).
In contrast, the low photosynthetic capacity induced by downregulated expression of photosynthesis-related genes, which suppressed the expression of catechins-related genes, and accordingly decreased catechins accumulation in tea plants under extremely high and low light intensity.
Discussion
Light controlled catechins accumulation in tea plant
In this study, the catechins content was enhanced by appropriately high light intensity but decreased under extremely low or high light intensity. The pathways of flavonoid synthesis, catechins polymerization and flavonols glycosylation were regulated by light [35, 50, 51], so we speculated that the decreased catechins content under low light intensity was due to the increased content of flavone or anthocyanin; this was consistent with the more purple bud colour in the 150 treatment. Catechin monomers responded differently to different light intensities in our research, and a previous study found that epicatechins declined but catechins was elevated in the dark [50], probably because the hydroxylation of B ring is related to the light signal [34].
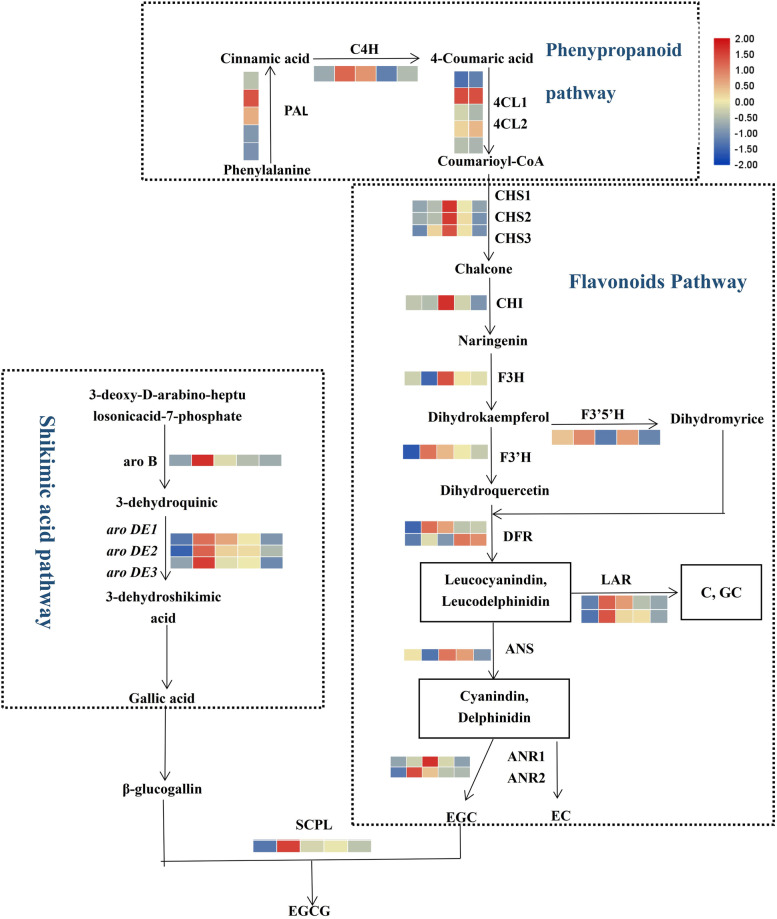
Catechins biosynthesis is involved in the shikimic acid pathway, phenylalanine pathway and flavonoid pathway. Gallic acid and non-esterified catechins are the precursors of esterified catechins [52]. The expression levels of CsF3’ H and CsDFR in the flavonoid pathway decreased rapidly in the shading treatment, resulting in decreased catechins content [43], which was consistent with the decreased catechins obtained by suppressing the expression of catechins-related genes under low light in our study (Fig. 8). The expression patterns and functions of CsDFR1 and CsDFR2 varied in our study, probably because the CsDFRs gene family is differently related to specific metabolites [32].
Fig. 8.
The regulation pathway of catechins-related genes under different light intensities
Catechins accumulation of tea plant were related to photosynthesis capacity
The flavonoids in tea plants, including catechins, flavonol and anthocyanin, and their biosynthesis require photosynthate as the substrate. Phosphoenolpyruvate (PEP) is essential for catechins biosynthesis. In the previous research, the flavonoids pathway was closely related to photosynthesis and chlorophyll content [53, 54], and there was the same response pattern between the content of total flavone and Pn when the light intensity changed [55]. Catechins biosynthesis in tea plants seriously was affected by photosynthesis [56], as well as the daily course of photosynthetic activity of tea leaves and the accumulation of catechins in tea leaves have almost parallel characteristics [57, 58]. Additionally, photosynthesis and chlorophyll influenced catechins biosynthesis and epicatechin content [59], which is consistent with our result that the catechins content was positively correlated with Pn and Tr.
We also found that the catechins content was related to Fm, ETR, FM’ and v’/FM’, and gene expression was related to photosynthetic capacity. A previous study has indicated that the differentially expressed genes between the normal plant and pale green mutant were mainly involved in photosynthesis and flavonoids pathway. Other environmental factors regulating the secondary metabolism of tea plants were dynamic under field conditions, and we confirmed the precise responses of catechins to light intensity and its underlying mechanism using phytotron. In summary, our results indicated that photosynthetic capacity controls catechins biosynthesis by regulating the substrate content and the expression of catechins-related genes when tea plants are grown under different light intensities.
The inhibition of catechin biosynthesis under the extreme light intensity was related to shoot growth of tea plant
Interestingly, consistent with the responses of catechins and photosynthetic capacity to light intensity changes, the young shoots grew slowly under excessively low or high light but grew more quickly under appropriately high light. We speculated that the regulation of catechins by light intensity was affected by shoot growth. We previously observed that catechins biosynthesis responded to temperature changes through shoot growth [60]. The higher chlorophyll and theanine contents but lower flavonoid contents under a shading treatment may have been related to the lower growth rate of young shoots [61]. High light intensity reduced growth and altered the catechins content of tea plants [62]. Therefore, the combined effects of the slow shoot growth and the decreased photosynthetic capacity inhibited catechins accumulation under excessive light intensity. We will test this hypothesis in future research. Future studies should also examine how other aspects of light conditions such as light quality and photoperiod influence catechins biosynthesis.
Conclusions
The catechins content and photosynthetic capacity of tea plants increased under appropriately high light intensity but decreased under the the extremely low or high light intensity. Photosynthesis- and catechins-related genes exhibited the same response pattern under the different light intensities. Based on PCA, correlation analysis and regression analysis, we found that catechins accumulation was affected by photosynthesis, and catechins-related genes were regulated by photosynthesis-related genes. In summary, the control of catechin accumulation by light in tea plants is mediated by the plant photosynthetic capacity. The research provided useful information for improving catechins content and its light-intensity regulation mechanism in tea plant.
Supplementary Information
Additional file 1: Supplemental Table 1. Culture conditions of tea plants.
Additional file 2: Supplemental Table 2. Primer sequences used for reverse transcription-quantitative PCR.
Additional file 3: Supplementary Table 3. The cubic function equations in curve-fitting analysis.
Additional file 4: Supplemental Figure 1. The PLS analysis between catechins content and the indexes of photosynthesis capacity of tea plants under different light intensity.
Additional file 5: Supplemental Figure 2. The expression of related genes under the different light intensity and their clustering.
Additional file 6: Supplemental data 1. The corresponding indexes of the numbers in the correlation analysis.
Acknowledgements
This research was supported by the National Natural Science Foundation of China. We thank Fujian Sanan Sino-Science Photobiotech Co., Ltd. for providing the phytotron and the specified nutrient solution of tea plant.
Abbreviations
- EGCG
Epigallocatechin gallate
- CG
Catechingallate
- GCG
Gallocatechin gallate
- ECG
Epicatechingallate
- C
Catechin
- EC
Epicatechin
- EGC
Epigallocatechin
- GA
Gallic acid
- Pn
Net photosynthetic rate
- Tr
Transpiration rate
- ETR
Electron transfer rate
- Gs
Stomatal conductance
- PCA
Principal component analysis
- PLS
Partial Least Square
- TC
Total catechins
- TNEC
Total non-esterified catechins
- TEC
Total esterified catechins
Authors’ contributions
PX conducted this research and prepared the draft manuscript; QFZ and MT (Marat Tukhvatshin) participated in investigation and revising manuscript; BSC and MT participated in investigation and data curation; JHL, XJW and JXH participated in catechin content determination; SLG, DYL and YZ participated in investigation; LYW participated in revising manuscript; JKL participated in conceiving the study, data analysis and revising the manuscript. All authors have read and approved the manuscript.
Funding
This work was supported by the National Natural Science Foundation of China under Grant 31870683.
Availability of data and materials
The datasets used and/or analysed during the current study available from the corresponding author on reasonable request (ljk213@163.com).
Declarations
Ethics approval and consent to participate
Not applicable.
Consent for publication
Not applicable.
Competing interests
The authors declare that they have no competing interests.
Footnotes
Publisher’s Note
Springer Nature remains neutral with regard to jurisdictional claims in published maps and institutional affiliations.
References
- 1.Bettuzzi S, Brausi M, Rizzi F, Castagnetti G, Peracchia G, Astancolle S, et al. Chemoprevention of human prostate cancer (PCa) by oral administration of green tea catechins (GTCs) in high-grade pin (HGPIN) subjects: a preliminary report from a 1-year proof-of-principle study. Eur Urol Suppl. 2006;5(2):166. doi: 10.1016/S1569-9056(06)60582-4. [DOI] [Google Scholar]
- 2.Cheng Z, Zhang Z, Han Y, Wang J, Wang Y, Chen X, et al. A review on anti-cancer effect of green tea catechins. J Funct Foods. 2020;74:1-20.
- 3.Qie X, Wu Y, Chen Y, Liu C, Zeng M, Qin F, et al. Competitive interactions among tea catechins, proteins, and digestive enzymes modulate in vitro protein digestibility, catechin bioaccessibility, and antioxidant activity of milk tea beverage model systems. Food Res Int (Ottawa, Ont) 2021;140:110050. doi: 10.1016/j.foodres.2020.110050. [DOI] [PubMed] [Google Scholar]
- 4.Pervin M, Unno K, Ohishi T, Tanabe H, Miyoshi N, Nakamura Y. Beneficial effects of green tea Catechins on neurodegenerative diseases. Molecules. 2018;23(6):1-17. [DOI] [PMC free article] [PubMed]
- 5.Yan J, Zhao Y, Suo S, Liu Y, Zhao B. Green tea catechins ameliorate adipose insulin resistance by improving oxidative stress. Free Radic Biol Med. 2012;52(9):1648–1657. doi: 10.1016/j.freeradbiomed.2012.01.033. [DOI] [PubMed] [Google Scholar]
- 6.Botten D, Fugallo G, Fraternali F, Molteni C. Structural properties of green tea Catechins. J Phys Chem B. 2015;119(40):12860–12867. doi: 10.1021/acs.jpcb.5b08737. [DOI] [PubMed] [Google Scholar]
- 7.Wang Y, Zheng P-C, Liu P-P, Song X-W, Guo F, Li Y-Y, et al. Novel insight into the role of withering process in characteristic flavor formation of teas using transcriptome analysis and metabolite profiling. Food Chem. 2019;272:313–322. doi: 10.1016/j.foodchem.2018.08.013. [DOI] [PubMed] [Google Scholar]
- 8.Cao Y, Cao R. Angiogenesis inhibited by drinking tea. Nature. 1999;398(6726):381. doi: 10.1038/18793. [DOI] [PubMed] [Google Scholar]
- 9.Liao S, Kao YH, Hiipakka RA. Green tea: biochemical and biological basis for health benefits. Vitam Horm. 2001;62:1–94. doi: 10.1016/S0083-6729(01)62001-6. [DOI] [PubMed] [Google Scholar]
- 10.Gilbert N. Drink tea and be merry. Nature. 2019;566(7742):S8–S9. doi: 10.1038/d41586-019-00398-1. [DOI] [PubMed] [Google Scholar]
- 11.Shin CM, Lee DH, Seo AY, Lee HJ, Kim SB, Son WC, et al. Green tea extracts for the prevention of Metachronous colorectal polyps among patients who underwent endoscopic removal of colorectal adenomas: a randomized clinical trial. Digestion. 2019;99(1):104. doi: 10.1016/j.clnu.2017.01.014. [DOI] [PubMed] [Google Scholar]
- 12.Yang CS, Wang X, Lu G, Picinich SC. Cancer prevention by tea: animal studies, molecular mechanisms and human relevance. Nat Rev Cancer. 2009;9(6):429–439. doi: 10.1038/nrc2641. [DOI] [PMC free article] [PubMed] [Google Scholar]
- 13.Liu J, Liu S, Zhou H, Hanson T, Yang L, Chen Z, et al. Association of green tea consumption with mortality from all-cause, cardiovascular disease and cancer in a Chinese cohort of 165,000 adult men. Eur J Epidemiol. 2016;31(9):853–865. doi: 10.1007/s10654-016-0173-3. [DOI] [PMC free article] [PubMed] [Google Scholar]
- 14.Liu L, Li Y, She G, Zhang X, Jordan B, Chen Q, et al. Metabolite profiling and transcriptomic analyses reveal an essential role of UVR8-mediated signal transduction pathway in regulating flavonoid biosynthesis in tea plants (Camellia sinensis) in response to shading. BMC Plant Biol. 2018;18:233. [DOI] [PMC free article] [PubMed]
- 15.Liu S, Gao J, Chen Z, Qiao X, Huang H, Cui B, et al. Comparative proteomics reveals the physiological differences between winter tender shoots and spring tender shoots of a novel tea (Camellia sinensis L.) cultivar evergrowing in winter. BMC Plant Biol. 2017;17:1-12. [DOI] [PMC free article] [PubMed]
- 16.Jaakola L, Maatta-Riihinen K, Karenlampi S, Hohtola A. Activation of flavonoid biosynthesis by solar radiation in bilberry (Vaccinium myrtillus L.) leaves. Planta. 2004;218(5):721–728. doi: 10.1007/s00425-003-1161-x. [DOI] [PubMed] [Google Scholar]
- 17.Arena ME, Postemsky PD, Curvetto NR. Changes in the phenolic compounds and antioxidant capacity of Berberis microphylla G. Forst. Berries in relation to light intensity and fertilization. Sci Hortic. 2017;218:63–71. doi: 10.1016/j.scienta.2017.02.004. [DOI] [Google Scholar]
- 18.Hwang CH, Park YG, Jeong BR. Changes in content of Total polyphenol and activities of Antioxidizing enzymes in Perilla frutescens var. acuta Kudo and Salvia plebeia R. Br. As affected by light intensity. Hortic Environ Biotechnol. 2014;55(6):489–497. doi: 10.1007/s13580-014-0010-0. [DOI] [Google Scholar]
- 19.Kawasaki S-I, Tominaga J, Yabuta S, Watanabe K, Jaiphong T, Ueno M, et al. Responses of growth, photosynthesis, and associated components to hypoxia at different light intensities in red leaf lettuce. Sci Hortic. 2015;193:330–336. doi: 10.1016/j.scienta.2015.07.029. [DOI] [Google Scholar]
- 20.Ma Z, Li S, Zhang M, Jiang S, Xiao Y. Light intensity affects growth, photosynthetic capability, and Total flavonoid accumulation of Anoectochilus plants. Hortscience. 2010;45(6):863–867. doi: 10.21273/HORTSCI.45.6.863. [DOI] [Google Scholar]
- 21.Pan J, Guo B. Effects of light intensity on the growth, photosynthetic characteristics, and flavonoid content of Epimedium pseudowushanense B.L.Guo. Molecules (Basel, Switzerland). 2016;21(11):1-12. [DOI] [PMC free article] [PubMed]
- 22.Perez-Lopez U, Sgherri C, Miranda-Apodaca J, Micaelli F, Lacuesta M, Mena-Petite A, et al. Concentration of phenolic compounds is increased in lettuce grown under high light intensity and elevated CO2. Plant Physiol Biochem. 2018;123:233–241. doi: 10.1016/j.plaphy.2017.12.010. [DOI] [PubMed] [Google Scholar]
- 23.Petrella DP, Metzger JD, Blakeslee JJ, Nangle EJ, Gardner DS. Anthocyanin production using rough bluegrass treated with high-intensity light. Hortscience. 2016;51(9):1111–1120. doi: 10.21273/HORTSCI10878-16. [DOI] [Google Scholar]
- 24.Yaginuma S, Shiraishi T, Ohya H, Igarashi K. Polyphenol increases in safflower and cucumber seedlings exposed to strong visible light with limited water. Biosci Biotechnol Biochem. 2002;66(1):65–72. doi: 10.1271/bbb.66.65. [DOI] [PubMed] [Google Scholar]
- 25.Deng B, Shang X, Fang S, Li Q, Fu X, Su J. Integrated effects of light intensity and fertilization on growth and flavonoid accumulation in Cyclocarya paliurus. J Agric Food Chem. 2012;60(25):6286–6292. doi: 10.1021/jf301525s. [DOI] [PubMed] [Google Scholar]
- 26.Estell RE, Fredrickson EL, James DK. Effect of light intensity and wavelength on concentration of plant secondary metabolites in the leaves of Flourensia cernua. Biochem Syst Ecol. 2016;65:108–114. doi: 10.1016/j.bse.2016.02.019. [DOI] [Google Scholar]
- 27.Re GA, Piluzza G, Sanna F, Molinu MG, Sulas L. Polyphenolic composition and antioxidant capacity of legume-based swards are affected by light intensity in a Mediterranean agroforestry system. J Sci Food Agric. 2019;99(1):191–198. doi: 10.1002/jsfa.9160. [DOI] [PubMed] [Google Scholar]
- 28.Dai W, Qi D, Yang T, Lv H, Guo L, Zhang Y, et al. Nontargeted analysis using Ultraperformance liquid chromatography-Quadrupole time-of-flight mass spectrometry uncovers the effects of harvest season on the metabolites and taste quality of tea (Camellia sinensis L.) J Agric Food Chem. 2015;63(44):9869–9878. doi: 10.1021/acs.jafc.5b03967. [DOI] [PubMed] [Google Scholar]
- 29.Kfoury N, Morimoto J, Kern A, Scott ER, Orians CM, Ahmed S, et al. Striking changes in tea metabolites due to elevational effects. Food Chem. 2018;264:334–341. doi: 10.1016/j.foodchem.2018.05.040. [DOI] [PubMed] [Google Scholar]
- 30.Wen B, Ren S, Zhang Y, Duan Y, Shen J, Zhu X, et al. Effects of geographic locations and topographical factors on secondary metabolites distribution in green tea at a regional scale. Food Control. 2020;110:106979.
- 31.Zhang C, Suen CL-C, Yang C, Quek SY. Antioxidant capacity and major polyphenol composition of teas as affected by geographical location, plantation elevation and leaf grade. Food Chem. 2018;244:109–119. doi: 10.1016/j.foodchem.2017.09.126. [DOI] [PubMed] [Google Scholar]
- 32.Zhu J, Xu Q, Zhao S, Xia X, Yan X, An Y, et al. Comprehensive co-expression analysis provides novel insights into temporal variation of flavonoids in fresh leaves of the tea plant (Camellia sinensis). Plant Sci. 2020;290:110306. [DOI] [PubMed]
- 33.Tai Y, Liu C, Yu S, Yang H, Sun J, Guo C, et al. Gene co-expression network analysis reveals coordinated regulation of three characteristic secondary biosynthetic pathways in tea plant (Camellia sinensis). BMC Genomics. 2018;19:616. [DOI] [PMC free article] [PubMed]
- 34.Forrest GI. Effects of light and darkness on polyphenol distribution in the tea plant (Camellia sinensis L.) Biochem J. 1969;113(5):773–781. doi: 10.1042/bj1130773. [DOI] [PMC free article] [PubMed] [Google Scholar]
- 35.Liu G-F, Han Z-X, Feng L, Gao L-P, Gao M-J, Gruber MY, et al. Metabolic flux redirection and Transcriptomic reprogramming in the albino tea cultivar 'Yu-Jin-Xiang' with an emphasis on Catechin production. Sci Rep. 2017;7:45062. [DOI] [PMC free article] [PubMed]
- 36.Shi J, Zhang X, Zhang Y, Lin X, Li B, Chen Z. Integrated metabolomic and transcriptomic strategies to understand the effects of dark stress on tea callus flavonoid biosynthesis. Plant Physiol Biochem. 2020;155:549–559. doi: 10.1016/j.plaphy.2020.07.048. [DOI] [PubMed] [Google Scholar]
- 37.Yang Z, Kobayashi E, Katsuno T, Asanuma T, Fujimori T, Ishikawa T, et al. Characterisation of volatile and non-volatile metabolites in etiolated leaves of tea (Camellia sinensis) plants in the dark. Food Chem. 2012;135(4):2268–2276. doi: 10.1016/j.foodchem.2012.07.066. [DOI] [PubMed] [Google Scholar]
- 38.Yu Z, Liao Y, Zeng L, Dong F, Watanabe N, Yang Z. Transformation of catechins into theaflavins by upregulation of CsPPO3 in preharvest tea (Camellia sinensis) leaves exposed to shading treatment. Food Res Int. 2020;129:108842. [DOI] [PubMed]
- 39.Zhang Q, Hu J, Liu M, Shi Y, De Vos RCH, Ruan J. Stimulated biosynthesis of delphinidin-related anthocyanins in tea shoots reducing the quality of green tea in summer. J Sci Food Agric. 2020;100(4):1505–1514. doi: 10.1002/jsfa.10158. [DOI] [PubMed] [Google Scholar]
- 40.Zhang Q, Shi Y, Ma L, Yi X, Ruan J. Metabolomic analysis using ultra-performance liquid chromatography-Quadrupole-time of flight mass spectrometry (UPLC-Q-TOF MS) uncovers the effects of light intensity and temperature under shading treatments on the metabolites in tea. PLoS One. 2014;9(11):e112572. [DOI] [PMC free article] [PubMed]
- 41.Eungwanichayapant PD, Popluechai S. Accumulation of catechins in tea in relation to accumulation of mRNA from genes involved in catechin biosynthesis. Plant Physiol Biochem. 2009;47(2):94–97. doi: 10.1016/j.plaphy.2008.11.002. [DOI] [PubMed] [Google Scholar]
- 42.Rani A, Singh K, Ahuja PS, Kumar S. Molecular regulation of catechins biosynthesis in tea Camellia sinensis (L.) O. Kuntze. Gene. 2012;495(2):205–210. doi: 10.1016/j.gene.2011.12.029. [DOI] [PubMed] [Google Scholar]
- 43.Wang Y, Gao L, Shan Y, Liu Y, Tian Y, Xia T. Influence of shade on flavonoid biosynthesis in tea (Camellia sinensis (L.) O. Kuntze) Sci Hortic. 2012;141:7–16. doi: 10.1016/j.scienta.2012.04.013. [DOI] [Google Scholar]
- 44.Wang Y, Gao L, Wang Z, Liu Y, Sun M, Yang D, et al. Light-induced expression of genes involved in phenylpropanoid biosynthetic pathways in callus of tea (Camellia sinensis (L.) O. Kuntze) Sci Hortic. 2012;133:72–83. doi: 10.1016/j.scienta.2011.10.017. [DOI] [Google Scholar]
- 45.Zhang X, Jiang X, He Y, Li L, Xu P, Sun Z, et al. AtHB2, a class II HD-ZIP protein, negatively regulates the expression of CsANS, which encodes a key enzyme in Camellia sinensis catechin biosynthesis. Physiol Plant. 2019;166(4):936–945. doi: 10.1111/ppl.12851. [DOI] [PubMed] [Google Scholar]
- 46.Ren C, Wang J, Xi B, Tang X, Liu X, Hu X, et al. Transcriptome analysis of flavonoid biosynthesis in safflower flowers grown under different light intensities. Peer J. 2020;8(2):e8671. [DOI] [PMC free article] [PubMed]
- 47.Zhang Y, Xu S, Cheng Y, Peng Z, Han J. Transcriptome profiling of anthocyanin-related genes reveals effects of light intensity on anthocyanin biosynthesis in red leaf lettuce. Peer J. 2018;6(2):e8671. [DOI] [PMC free article] [PubMed]
- 48.Konishi S, Miyamoto S, Taki T. Stimulatory effects of aluminum on tea plants grown under low and high phosphorus supply. Soil Sci Plant Nutr. 1985;31(3):361–368. doi: 10.1080/00380768.1985.10557443. [DOI] [Google Scholar]
- 49.Lin J, Wilson IW, Ge G, Sun G, Xie F, Yang Y, et al. Whole transcriptome analysis of three leaf stages in two cultivars and one of their F1 hybrid of Camellia sinensis L. with differing EGCG content. Tree Genet Genomes. 2017;13(1):1–14. doi: 10.1007/s11295-016-1089-5. [DOI] [Google Scholar]
- 50.Hong G, Wang J, Zhang Y, Hochstetter D, Zhang S, Pan Y, et al. Biosynthesis of catechin components is differentially regulated in dark-treated tea (Camellia sinensis L.) Plant Physiol Biochem. 2014;78:49–52. doi: 10.1016/j.plaphy.2014.02.017. [DOI] [PubMed] [Google Scholar]
- 51.Liu Y, Zhao G, Li X, Shen Q, Wu Q, Zhuang J, et al. Comparative analysis of phenolic compound metabolism among tea plants in the section Thea of the genus camellia. Food Res Int. 2020;135:1-11. [DOI] [PubMed]
- 52.Lu Z, Liu Y, Zhao L, Jiang X, Li M, Wang Y, et al. Effect of low-intensity white light mediated de-etiolation on the biosynthesis of polyphenols in tea seedlings. Plant Physiol Biochem. 2014;80:328–336. doi: 10.1016/j.plaphy.2014.04.016. [DOI] [PubMed] [Google Scholar]
- 53.Borovaya SA, Klykov AG. Some aspects of flavonoid biosynthesis and accumulation in buckwheat plants. Plant Biotechnol Rep. 2020;14(2):213–225. doi: 10.1007/s11816-020-00614-9. [DOI] [Google Scholar]
- 54.Wu M, Xu X, Hu X, Liu Y, Cao H, Chan H, et al. SlMYB72 regulates the metabolism of chlorophylls, carotenoids, and flavonoids in tomato fruit. Plant Physiol. 2020;183(3):854–868. doi: 10.1104/pp.20.00156. [DOI] [PMC free article] [PubMed] [Google Scholar]
- 55.Ni Y-W, Lin K-H, Chen K-H, Wu C-W, Chang Y-S. Flavonoid compounds and photosynthesis in Passiflora plant leaves under varying light intensities. Plants-Basel. 2020;9(5):633. [DOI] [PMC free article] [PubMed]
- 56.Hao X, Zhang W, Liu Y, Zhang H, Ren H, Chen Y, et al. Pale green mutant analyses reveal the importance of CsGLKs in chloroplast developmental regulation and their effects on flavonoid biosynthesis in tea plant. Plant Physiol Biochem. 2020;146:392–402. doi: 10.1016/j.plaphy.2019.11.036. [DOI] [PubMed] [Google Scholar]
- 57.Dzhemukhadze K: Physiology of agricultural plants. editors. Moscow: Publishing house of Moscow University; 1970. p. 468-9.
- 58.MK Daraselia VV, VP Gvasaliya. Tea culture in the USSR. editors. Tbilisi: Metsniereba; 1989. p. 486-7.
- 59.Wei K, Wang L, Zhou J, He W, Zeng J, Jiang Y, et al. Catechin contents in tea (Camellia sinensis) as affected by cultivar and environment and their relation to chlorophyll contents. Food Chem. 2011;125(1):44–48. doi: 10.1016/j.foodchem.2010.08.029. [DOI] [Google Scholar]
- 60.Xiang P, Wilson IW, Huang J, Zhu Q, Tan M, Lu J, et al. Co-regulation of catechins biosynthesis responses to temperature changes by shoot growth and catechin related gene expression in tea plants (Camellia sinensis L.) J Hortic Sci Biotechnol. 2020;96(2):228–238. doi: 10.1080/14620316.2020.1830721. [DOI] [Google Scholar]
- 61.Sano T, Horie H, Matsunaga A, Hirono Y. Effect of shading intensity on morphological and color traits and on chemical components of new tea (Camellia sinensis L.) shoots under direct covering cultivation. J Sci Food Agric. 2018;98(15):5666–5676. doi: 10.1002/jsfa.9112. [DOI] [PubMed] [Google Scholar]
- 62.Hwa SS, Jeon S-H. SangInShim, JunWoojun, Jinwoong C, SangInShim: strong solar irradiance reduces growth and alters Catechins concentration in tea plants over winter. J Crop Sci Biotechnol. 2019;22(5):475–480. doi: 10.1007/s12892-019-0215-0. [DOI] [Google Scholar]
Associated Data
This section collects any data citations, data availability statements, or supplementary materials included in this article.
Supplementary Materials
Additional file 1: Supplemental Table 1. Culture conditions of tea plants.
Additional file 2: Supplemental Table 2. Primer sequences used for reverse transcription-quantitative PCR.
Additional file 3: Supplementary Table 3. The cubic function equations in curve-fitting analysis.
Additional file 4: Supplemental Figure 1. The PLS analysis between catechins content and the indexes of photosynthesis capacity of tea plants under different light intensity.
Additional file 5: Supplemental Figure 2. The expression of related genes under the different light intensity and their clustering.
Additional file 6: Supplemental data 1. The corresponding indexes of the numbers in the correlation analysis.
Data Availability Statement
The datasets used and/or analysed during the current study available from the corresponding author on reasonable request (ljk213@163.com).


