

Abstract
Obese adolescents have increased fracture risk, but effects of alterations in adiposity on bone accrual and strength in obese adolescents are not understood. We evaluated 12-month changes in trabecular and cortical volumetric bone mineral density (vBMD) and cortical geometry in obese adolescents undergoing a randomized weight management program, and investigated the effect of body composition changes on bone outcomes. Peripheral quantitative CT of the radius and tibia, and whole body DXA scans were obtained at baseline, six and 12 months in 91 obese adolescents randomized to standard care versus behavioral intervention for weight loss. Longitudinal models assessed effects of body composition changes on bone outcomes, adjusted for age, bone length, and African-American ancestry, and stratified by sex. Secondary analyses included adjustment for physical activity, maturation, vitamin D, and inflammatory biomarkers. Baseline BMI was similar between intervention groups. Twelve-month change in BMI in the standard care group was 1.0 kg/m2 vs. −0.4 kg/m2 in the behavioral intervention group (p<0.01). Intervention groups were similar in bone outcomes, so were combined for subsequent analyses. For the tibia, BMI change was not associated with change in vBMD or structure. Greater baseline lean body mass index (LBMI) associated with higher cortical vBMD in males, trabecular vBMD in females, and polar section modulus (pZ) and periosteal circumference (Peri-C) in both sexes. In females, change in LBMI positively associated with gains in pZ and Peri-C. Baseline visceral adipose tissue (VFAT) was inversely associated with pZ in males and cortical vBMD in females. Change in VFAT did not affect bone outcomes. For the radius, BMI and LBMI changes positively associated with pZ in males. Thus, in obese adolescents, weight loss intervention with modest changes in BMI was not detrimental to radius or tibia bone strength, and changes in lean, but not adiposity, measures were beneficial to bone development.
Keywords: obesity, adolescence, bone density, pQCT, lean body mass
INTRODUCTION
Childhood obesity has reached epidemic proportions. Between 2011 and 2014, 17.5% of children ages 6 to 11 years and 20.5% of those ages 12 to 19 years were obese.1 Obesity in childhood and adolescence is associated with metabolic syndrome, type 2 diabetes mellitus, and cardiovascular disease.2–4 The effects of excess adiposity on bone development during the period of peak bone mineral accrual is less well understood and beset with inconsistent findings. Greater body mass index (BMI) in children and adults is positively associated with bone size, bone mineral content, areal bone mineral density (aBMD), and volumetric bone mineral density (vBMD).5,6 Yet, childhood obesity is also associated with increased fracture risk,7–10 and a pattern of increased fracture rates along the lower extremity and physis.11,12
Plausible mechanisms for increased fracture risk in obese children include impaired bone strength due to lack of physical activity, severe vitamin D deficits, inadequate bone strength to compensate for body habitus, lack of coordination, and increased impact of falls due to weight.8,13 The skeletal effects of excess adiposity may vary according to fat distribution. Among non-obese children and young adults, subcutaneous adipose tissue was associated with greater cortical dimensions14,15 while visceral adipose tissue and intramuscular adipose tissue were associated with trabecular and cortical deficits.14,16 The adverse effects of visceral and intramuscular adipose tissue may reflect increased inflammatory cytokines and abnormal hormonal regulators of metabolism.17–21
Studies report conflicting results regarding the effects of obesity on developing bone.5,14,16,22–27 These discrepancies may relate to differences in the skeletal sites assessed, and varying statistical approaches. Most prior studies were limited by dual x-ray absorptiometry (DXA) methods which do not distinguish between trabecular and cortical density and structure, and were subject to errors introduced by variability in soft tissue and bone thickness. In contrast, quantitative computerized tomography (QCT) provides three-dimensional measures of trabecular and cortical vBMD and cortical dimensions that correlate highly with bone strength, and are less subject to errors introduced by overlying fat mass. Prior pediatric QCT studies have been limited by cross-sectional design, and bone responses to changes in adiposity are poorly described.
The effect of weight loss on bone health during the critical period of growth and bone development is unknown. There are no studies examining the effect of change in fat distribution on bone structure during adolescence, when metabolic insults may have life-long implications for bone health. This study aimed to assess longitudinal changes in tibia and radius peripheral QCT (pQCT) measures of trabecular and cortical vBMD and cortical geometry in obese adolescents randomized to standard care versus comprehensive behavioral weight control program over one year. Secondary aims included evaluation of the impact of longitudinal changes in weight and regional adiposity on tibia and radius bone outcomes.
METHODS AND MATERIALS
Design and participants
This study was a 12-month, 1:1 randomized weight loss clinical trial (NCT00609713) of 91 obese adolescents assessing the effects of weight loss on bone health during growth. The study began in March 2008 and was completed in October 2011. Study visits were performed at baseline, six and 12 months and included measures of body composition, collection of serum samples, measurement of physical activity, and dietary assessment. The protocol was approved by the Institutional Review Board of the Children’s Hospital of Philadelphia and informed consent was obtained from all participants. Participants were recruited at the Children’s Hospital of Philadelphia and in the greater Philadelphia area through use of flyers, newspaper and radio advertisements, and referral from local clinicians.
Inclusion criteria were age ≥10 years and <15 years, the period in which peak bone mineral accretion velocity is greatest, and BMI above the 97th percentile for sex and age. Participants were excluded for syndromic or obesity secondary to other medical diagnoses, BMI Z-score greater than +3.00 SD to avoid co-morbidities associated with severe obesity or for weight greater than 136 kg due to the weight limit of the DXA table.
Exclusion criteria included reported developmental delay requiring special education, depression, psychosis, eating disorders, orthopedic problems interfering with moderate to vigorous physical activity, diabetes, polycystic ovary syndrome, use of anticonvulsant medications, weight loss medications including diet supplements, cumulative lifetime systemic corticosteroid use exceeding three months, and any other medications or chronic conditions deemed likely to interfere with the intervention or bone health. Additional exclusion criteria included weight loss of at least 5% over the preceding six months, participation in another weight loss program, cigarette smoking, and, for females, sexual activity without contraception.
Randomization and weight loss intervention
All recruited participants attended a pre-randomization behavioral assessment visit to ensure that the intervention program would be appropriate for participant and family. A blocked randomization scheme was used to achieve a balanced distribution of sex and African American ancestry (African American vs. non-African American) in each intervention arm, with participants randomized to: a nutrition education program (Arm I), considered standard care, or a comprehensive lifestyle modification program (Arm II) (Figure 1).
Figure 1:
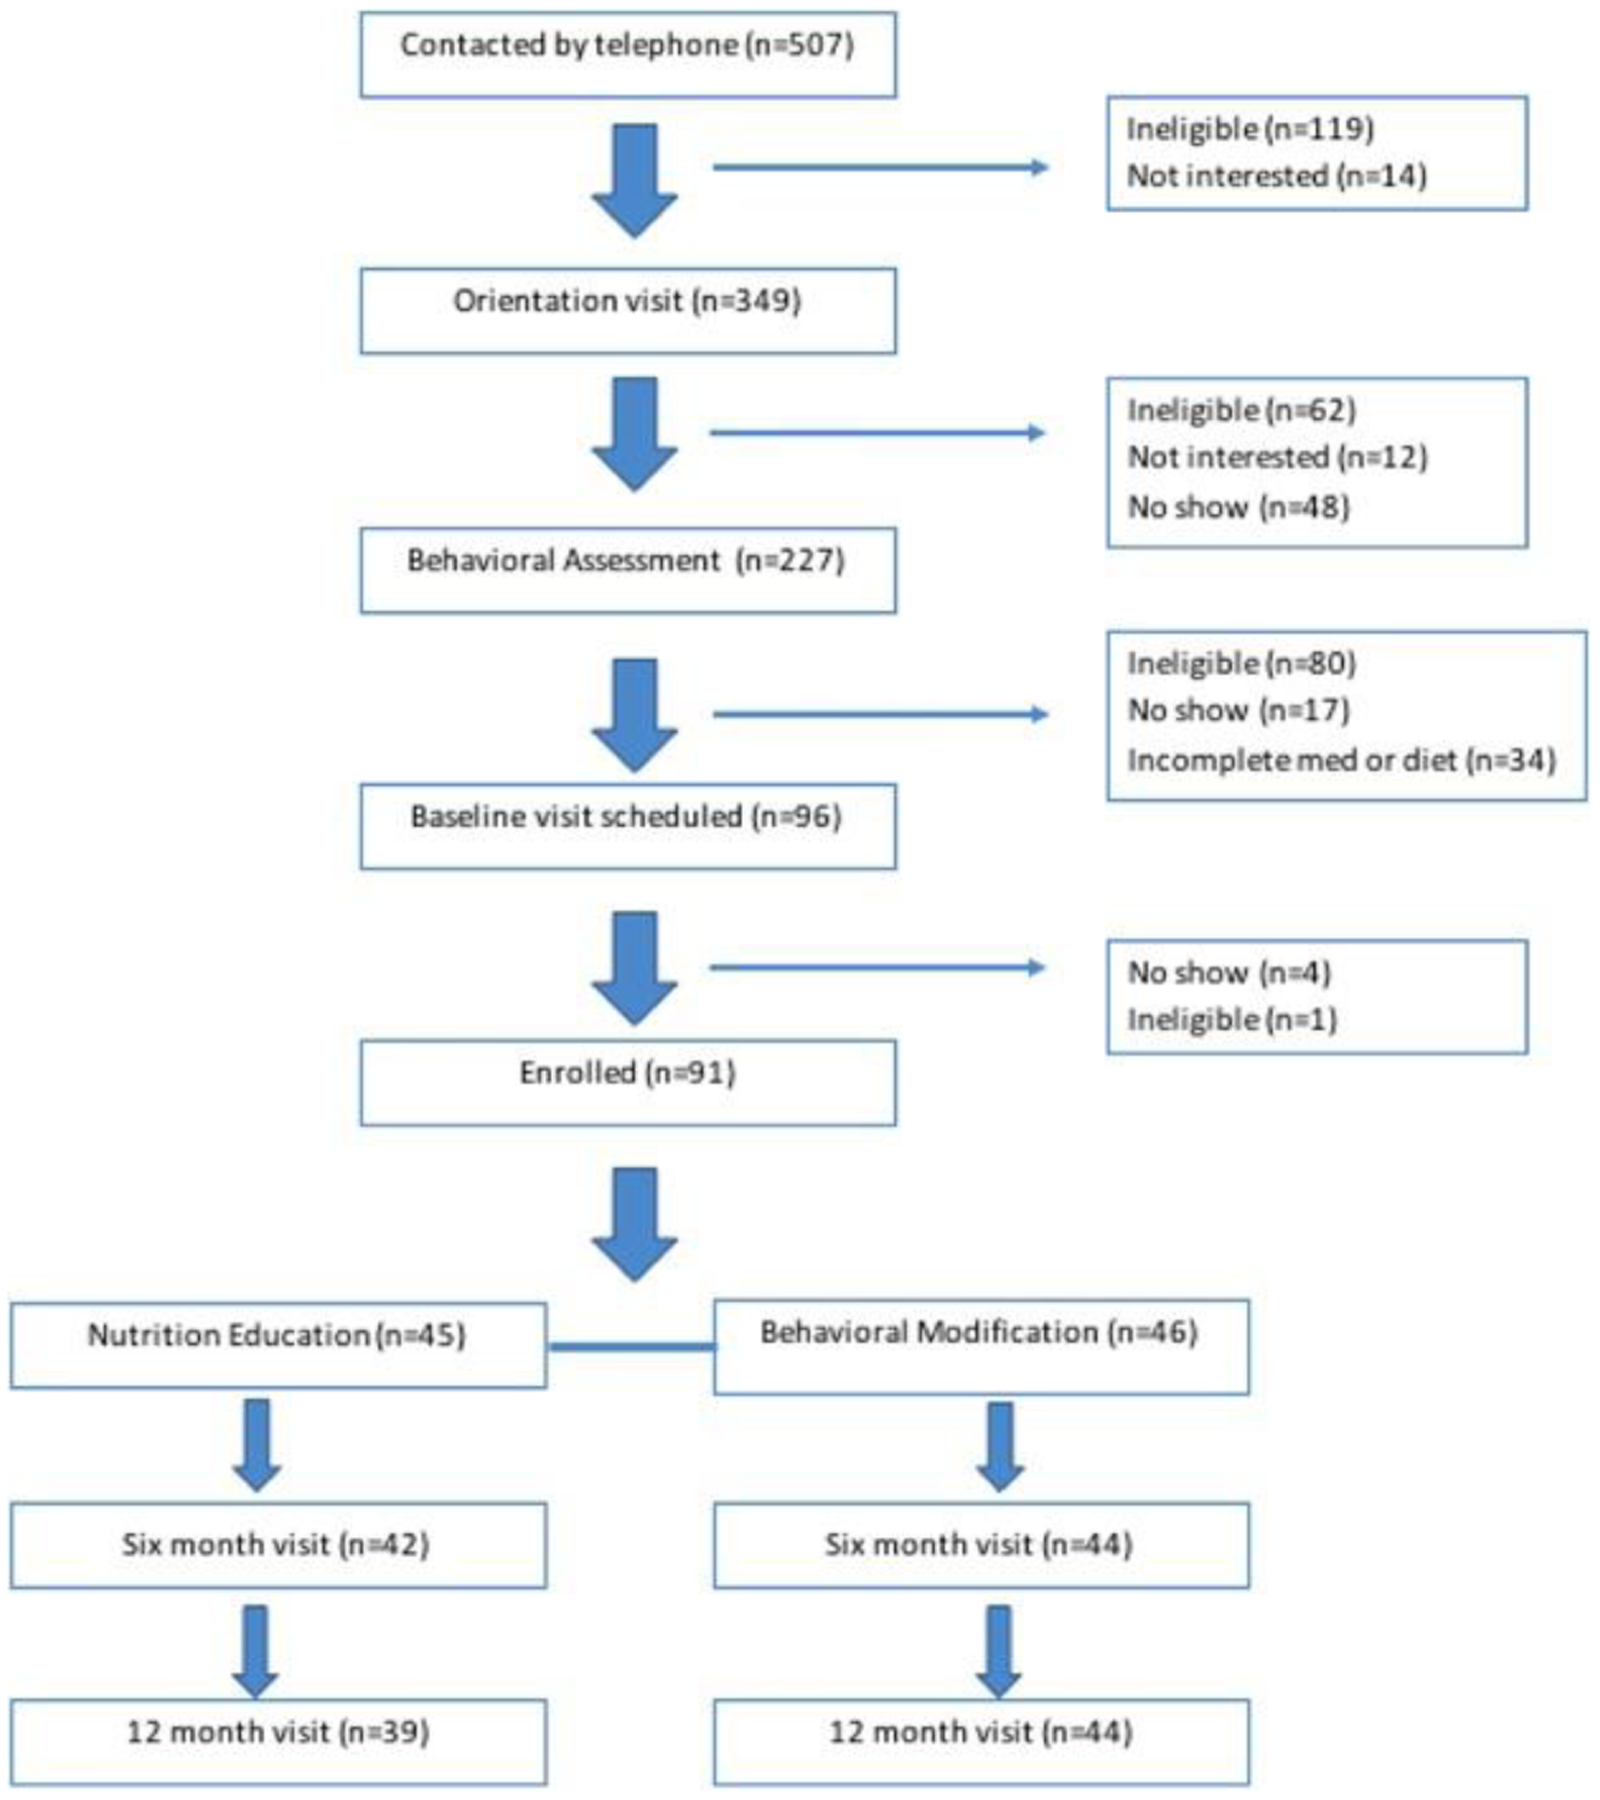
Consort diagram.
In Arm I, participants received individual nutrition education sessions with an experienced pediatric dietician. The initial consultation lasted 60 minutes and follow-up sessions lasted 30 minutes. Sessions were held monthly for the first 6 months; followed by sessions in months 8, 10 and 12. During the initial session, the dietician reviewed the adolescent’s usual diet to identify treatment targets, such as decreased consumption of high-fat foods and sweetened beverages, portion control, and decreasing snacking. Recommended dietary changes were customized to subject’s specific situation and provided to the child and family. Follow-up visits included review of challenges to implementing dietary changes, problem identification, suggestions for overcoming challenges, reinforcement of previous dietary recommendations and introduction of additional dietary recommendations as appropriate. Lifestyle physical activity recommendations corresponding to the goals of Healthy People 201028 for adolescents included engagement in vigorous physical activity ≥3 days per week for 20 or more minutes per occasion, and decrease sedentary behaviors to ≤2 hours per day.
In Arm II, participants met weekly for the first 12 weeks, then every other week for the next 12 weeks and once a month thereafter through week 52. Adolescents and parents met in separate group sessions29,30 that reviewed causes of obesity; components of healthful nutrition; self-monitoring of caloric intake, physical activity, and inactivity; stimulus control procedures; coping with high-risk social or psychological situations that trigger excess eating; increasing physical activity; and minimizing inactivity. Self-monitoring diaries and completed homework were submitted at each session, and incentives were used as an integral part of the behavior modification program.
Peripheral quantitative computed tomography (pQCT)
All measurements were collected as previously described by Leonard et al., 2015.4 A Stratec XCT-2000 pQCT device (Orthometrix, Inc., White Plains, NY) with a 12-detector unit, 0.4 mm voxel size, 2.3 mm slice thickness, 25 mm/sec scan speed, and software version 5.5 was used to measure tibia and radius bone outcomes at baseline, six, and 12 months. Placement of the reference line was guided by a scout view and placed at the proximal margin of the growth plate rather than the end of the growth plate to reduce heterogeneity given the variability in the size of the epiphysis. In participants with open growth plates, placement of the reference line was at the medial proximal border of the distal growth plate versus the medial proximal border of the endplate in participants with fused growth plates. A sliding caliper (Rosscraft, Surrey, BC, Canada) was used to measure tibia and radius length on the participants’ extremities. Tibia and radius trabecular vBMD were assessed at the 3% site in the mid-region of the metaphysis. Cortical vBMD (mg/mm3), section modulus (mm3), and periosteal and endosteal circumference (mm) were assessed in the diaphysis at the 38% site in the tibia and the 30% site in the radius. Measurements of calf muscle and subcutaneous fat cross-sectional area (mm2) were obtained at the 66% site.
Body composition
Weight and height were measured in triplicate with mean value used in analysis. Weight was measured with subjects in light clothing on a digital electronic scale (Seca, Munich, Germany) to the nearest 0.1 kg. Standing height was measured to the nearest 0.1 cm on a stadiometer (Holtain Ltd., Crymych, UK). The validated self-assessment questionnaire developed by Morris and Udry was used for pubertal assessment, with completion by the subject with parental assistance if needed.31 Pubertal assessment was based on pubic hair in both sexes as self-assessment of breast Tanner stage in obese girls may be unreliable. The left hand wrist radiograph was compared to Greulich and Pyle standard tables to obtain bone age assessment.32
Body composition was obtained by whole body DXA using the Discovery bone densitometer (Hologic, Inc., Bedford, MA) using software version 13.3 to estimate subtotal (whole body less head) fat-free mass, fat mass, and bone mass. DXA estimated abdominal visceral and subcutaneous fat were also measured.33 Muscle density (mg/cm3) was obtained from pQCT measurement of calf muscle at the 66% site and used as a surrogate measure of intramuscular adipose tissue, which is inversely related to muscle density.
Accelerometry
In order to assess the independent effect that physical activity may have on biomechanical loading and thus bone strength, physical activity was measured using the ActiGraph GT1M accelerometer (ActiGraph,LLC, Fort Walton Beach, FL). Participants were instructed to wear the device on the right side of the body, attached to a waist belt, during waking hours for seven days (including two weekend days), and to record each time the device was removed and replaced. Results were used in analysis if at least eight hours of data on at least six days, including one weekend day, were recorded. Validated activity threshold was used to measure the average number of activity counts per minute, as well as the percentage of time the participants spent in sedentary, light, moderate, moderate-to-vigorous and vigorous physical activity per 7-day period while wearing the device.34
Serum studies
Non-fasting blood samples were collected at each study visit to measure potential biochemical indicators of inflammation and poor nutritional status that may act as confounding factors in the relationship between obesity and bone. These included serum high sensitivity CRP (hsCRP, mg/L) and 25-hydroxy-vitamin D [25(OH)D; ng/mL] concentrations. Human C-Reactive Protein/CRP Quantikine ELISA kit (R&D Systems, Minneapolis, MN) was used to measure hsCRP, with a coefficient of variation (CV) of 8%. Chemiluminescence immunoassay using the DiaSorin LIAISON assay (Heartland Assays, Ames, IA) was used to measure 25(OH)D, with a CV of 5%.
Statistical analysis
For the primary aim (intention-to-treat analysis), the magnitude and significance of change in subject characteristics over the twelve-month period were assessed using a random effects model with an indicator variable for 12 months (versus baseline) and a random intercept for each subject. Between-group differences were assessed using a time by group interaction term. Participants who were present at only one visit were retained in these analyses. Missing values were not imputed.
Measures of growth, body composition and bone health in adolescents are typically converted to age and sex specific z-scores to account for the non-linear, heteroscedastic distribution of reference values associated with age. However, change in z-scores can be more difficult to interpret, especially among children with obesity.35,36 In this study, the age range was restricted to 10 to 14 years and all subjects were obese. Therefore, the change in bone and body composition measurements was used as the outcome for all analyses, with each model regressed on age, sex, and ancestry group. Because tests for interactions between sex and body composition were statistically significant, all analyses were stratified by sex.
Change in body composition measures, including BMI, fat mass index, lean body mass index, visceral fat and subcutaneous fat, were assessed individually as independent predictors of the various bone outcomes using quasi-least squares models37 and the Begg Parides method for regression analysis of clustered data, which allows for interpretation of effects at both the individual and group levels.38 Intention-to-treat analysis was performed by including all observations available from randomized participants and all models were adjusted for intervention group. The study was designed to enroll 44 participants per group (total n=88) to detect an effect size of 0.7 with a type 1 error = 0.05 and 80% power, with 25% lost to follow-up over 12 months. Change in bone outcome was modeled on change in body composition from baseline to 6 months and baseline to 12 months. Models were further adjusted for age and ancestry group. A sex by time interaction was noted during analysis and all models were then stratified by sex. Tibia and radius cortical dimensions were highly correlated with tibia or radius length, thus models were also adjusted for length of the tibia or radius.39 Secondary analyses included adjustment of BMI for vigorous and moderate-to-vigorous physical activity (MVPA) level and muscle circumference. Lean body mass index was adjusted for fat mass index to account for the expected increase in lean mass with increasing body fat, and visceral fat was adjusted for subcutaneous fat. Analyses were performed using Stata/SE 12.0 (StataCorp LP, College Station, TX) and a p-value of 0.05 was considered statistically significant.
RESULTS
Anthropometry, body composition and maturity
Baseline characteristics of the obese participants were previously reported in detail in Leonard et al.4 The study enrolled 91 participants, 45 (male=15) who were randomized into the standard care group, Arm I, and 46 (male=17) into the lifestyle intervention group, Arm II. There was no statistical difference in median baseline BMI between groups (p=0.55). Retention at 12 months was 91% (n=83). The intention to treat analysis showed differences in BMI, fat mass index and subcutaneous fat area. Mean 12 month change in BMI in the standard care group was 1.0 kg/m2 (95% CI [0.30, 1.7]) compared to −0.4 kg/m2 (95% CI [−1.24, 0.35]) in the behavioral intervention group (p=0.007). Mean 12 month change in fat mass index (0.46 kg/m2 [95% CI (−0.03,0.95)] for the standard care group and −0.77 kg/m2 [95% CI (−1.36, −0.19)] for the behavioral intervention group), p=0.002) and subcutaneous fat area (22.71 mm2 [95% CI (8.58, 36.84)]for the standard care group and −12.45 mm2 [95% CI (−38.80, 13.89)] for the behavioral intervention group, p-=0.03) also significantly differed by intervention group. The intent to treat analysis and primary a priori defined analysis for the randomized controlled trial design did not identify group differences for the other measures of body composition. The intent to treat analysis did not identify differences in bone outcomes over 12 months, including trabecular vBMD (β −4.32, 95% CI [−9.02, 0.37], p=0.07), cortical vBMD (β 0.44, 95% CI [−4.43, 5.31], p=0.86), or section modulus (β 8.52, 95% CI [−43.18, 60.22], p=0.75). Figure 2 summarizes differences in body composition and bone outcome between intervention groups. Supplemental Table 1 summarizes change in body composition and bone outcomes over 6 and 12 months by intervention group. Because there were no significant differences in bone outcomes between intervention groups, they were combined for subsequent analyses. Tests for interactions between sex and body composition measures were examined and were found to be statistically significant, so all analyses presented are stratified by sex and adjusted for intervention arm.
Figure 2:
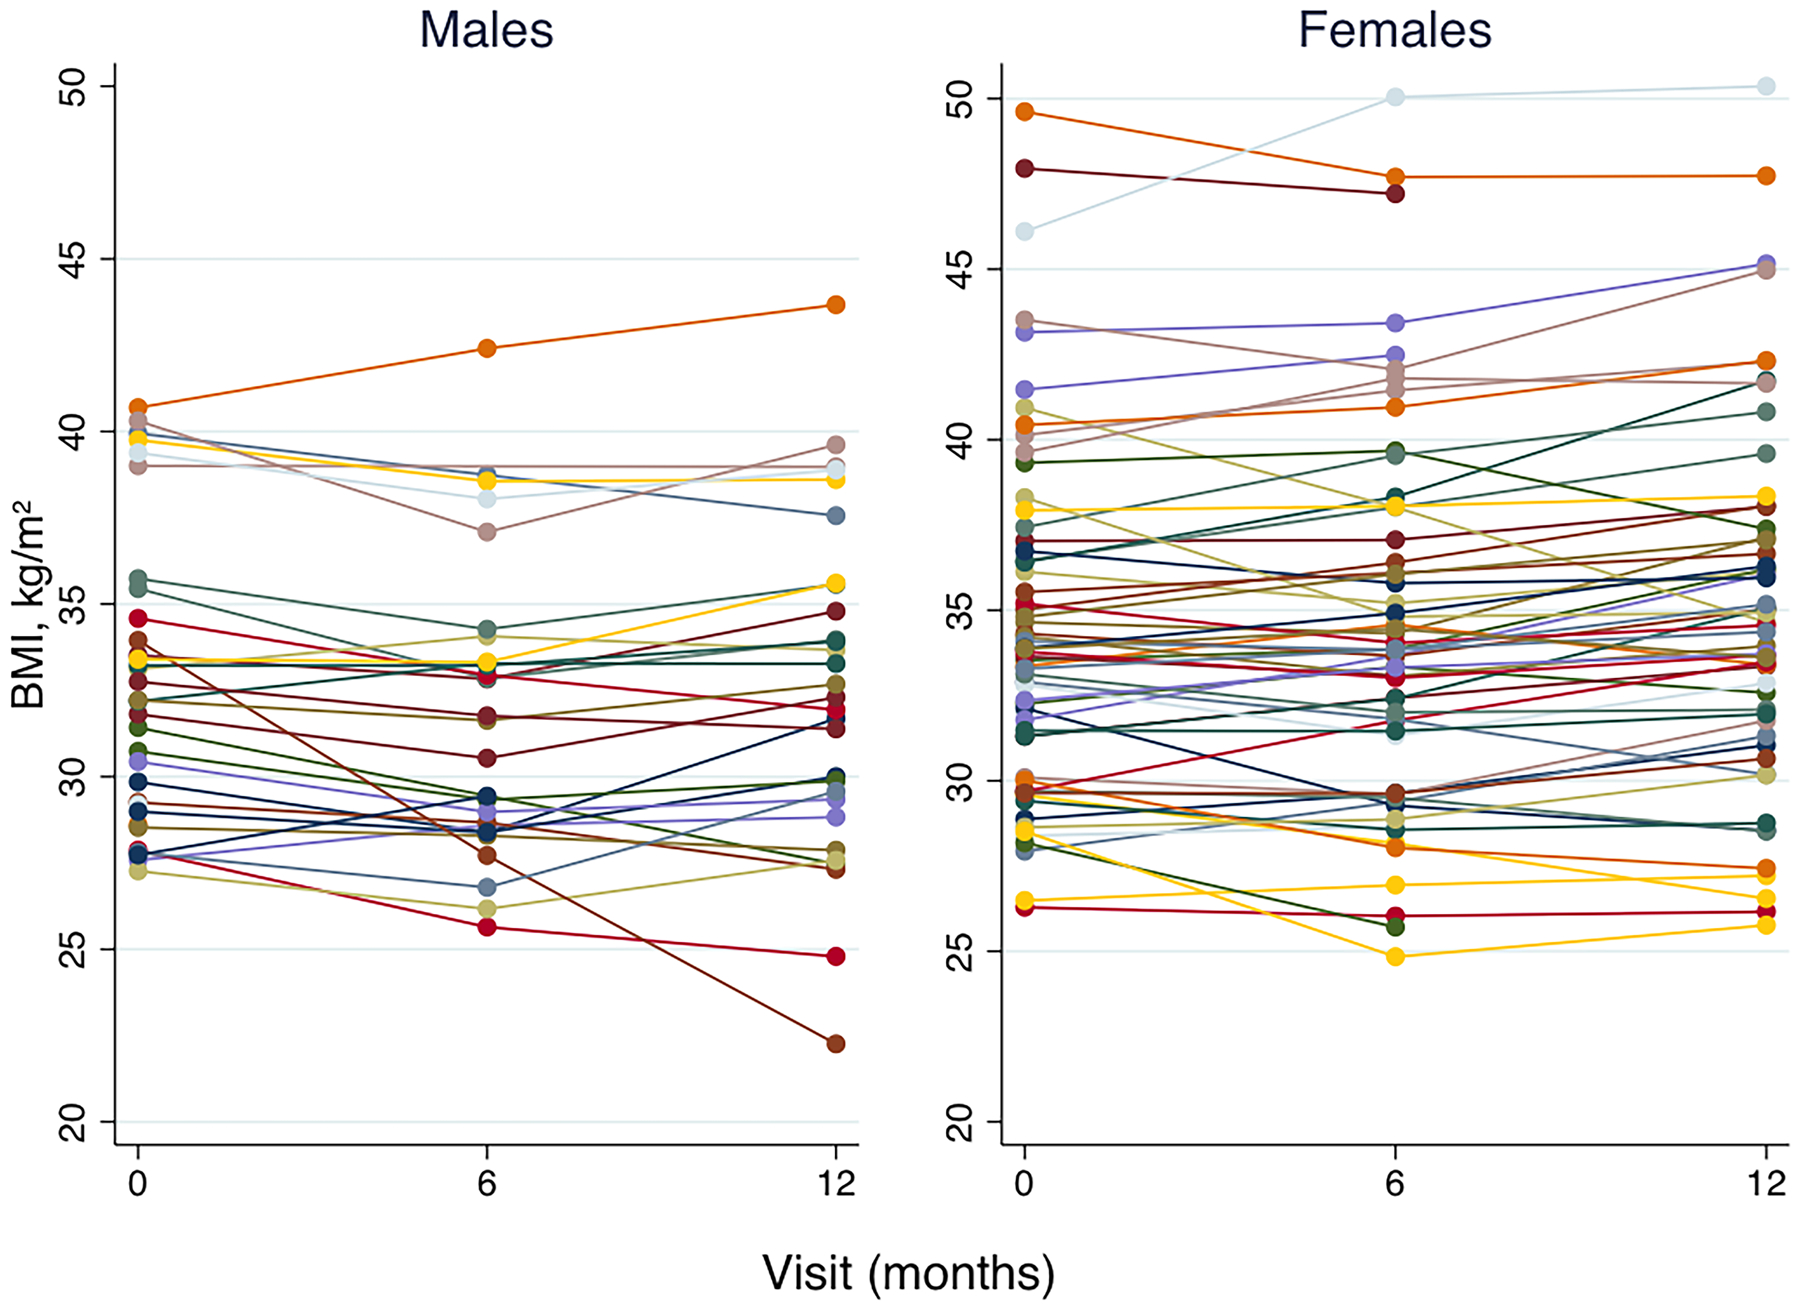
Change in BMI over the 12 month study in obese male and female adolescents. Overall, BMI decreased in the first six months in both males and females. These decreases were not sustained; from six to 12 months there was either a plateau or increase of BMI to baseline values or greater.
Table 1 summarizes characteristics of the male and female participants at baseline and longitudinal change over 12 months. In males, significant change from baseline to follow-up was present in all measures except for BMI, skeletal maturity, and subcutaneous fat. In females, significant change from baseline to follow-up was present in all measures except for fat mass index and visceral fat. Males had a significantly greater increase over 12 months in height and muscle area and a significantly greater decrease in BMI and fat mass index compared to females.
Table 1.
Characteristics of male and female participants at baseline and change over 12 months
| Male | Female | |||||
|---|---|---|---|---|---|---|
| Baseline (n=32) | Change, 0 to 12 months (n=29) | Baseline (n=59) | Change, 0 to 12 months (n=54) | |||
| Median [IQR] | Mean [95% CI] | p-value* | Median [IQR] | Mean [95% CI] | p-value* | |
| Age, yr | 12.2 [11.1–12.9] | 1.0 [1.0–1.0] | <0.001 | 12.2 [11.2–13.4] | 1.0 [1.0–1.0] | <0.001 |
| Weight, kg | 80.3 [66.1–92.1] | 4.9 [2.4–7.5] | <0.001 | 89.9 [72.8–99.4] | 4.5 [3.3–5.8] | <0.001 |
| Height, cm | 155.2 [151.4–160.9] | 6.2 [5.6–6.8] | <0.001 | 157.7 [154.2–165.0] | 2.7 [2.2–3.2] | <0.001 |
| BMI, kg/m 2 | 32.2 [29.1–35.0] | −0.5 [−1.3–0.2] | 0.17 | 33.8 [30.1–37.0] | 0.7 [0.2–1.1] | <0.05 |
| Puberty, Tanner | 3.0 [2.0–4.0] | 1.5 [0.5–2.5] | <0.005 | 4.0 [3.0–5.0] | 1.0 [0.3–1.8] | <0.005 |
| Bone age, yr | 13.5 [13.0–13.5] | 1.0 [0.7–1.3] | <0.001 | 14.0 [12.0–15.0] | 0.7 [0.5–0.9] | <0.001 |
| Advanced skeletal maturity, yr | 1.1 [0.5–2.1] | 0.0 [−0.4–0.3] | 0.72 | 1.7 [1.2–2.2] | −0.3 (−0.5–−0.2] | <0.001 |
| Muscle Area, cm 2 | 6421 [5492–7400] | 455 [315–596] | <0.001 | 6585 [5955–7156] | 147 [33–261] | <0.05 |
| Subtotal_LBMI, kg/m 2 | 16.8 [16.1–18.3] | 0.4 [0.0–0.7] | <0.05 | 17.0 [16.0–18.2] | 0.3 [0.1–0.5] | <0.005 |
| Subtotal_FMI, kg/m 2 | 12.5 [10.7–15.3] | −0.9 [−1.4–0.4] | <0.005 | 14.3 [12.6–16.9] | 0.2 [−0.2–0.5] | 0.30 |
| VAT, cm 2 | 98.0 [78.8–109.5] | −8.8[−12.8– −4.9] | <0.001 | 95.4 [83.6–107.8] | −3.6 [−7.9–0.7] | 0.10 |
| SAT, cm 2 | 421.0 [346.3–511.8] | −8.0 [−33.4–17.3] | 0.53 | 540.6 [458.8–625.1] | 12.1 [0.38–23.9] | <0.05 |
P-value represents significance of magnitude of change from baseline to 12 months obtained using a random effects model with an indicator variable for 12 months (versus baseline) and a random intercept for each subject. Categorical characteristics were assessed by logistic regression using an ordinal logistic model.
Note: LBMI = lean body mass index, FMI = fat mass index, VAT = Visceral adipose tissue, SAT = subcutaneous adipose tissue
Laboratory results
Serum hsCRP and 25(OH)D concentrations were not significantly different between intervention groups or sexes at baseline (males, median hsCRP 0.2 mg/dL (IQR 0.0–2.7) and median 25(OH)D 7.8 ng/mL (IQR 0.0–20.5); females, median hsCRP 0.3 mg/dL (IQR 0.0–1.7) and median 25(OH)D 8.0 ng/mL (IQR 0.0–19.4). Change in these concentrations was not significant over 12 months. Magnitude of change in serum hsCRP and 25(OH)D did not differ significantly between intervention groups or sexes.
Bone density and structure
Table 2 summarizes baseline and longitudinal changes in tibia and radius cortical bone measures. Both males and females had significant change over 12 months for all tibia outcomes. Males had significantly greater gains in tibia length, cortical density, section modulus, cortical area, periosteal circumference and endosteal circumference of the radius and tibia compared to females. Males had significant change over 12 months in all radius measures except trabecular vBMD, while females had significant changes for all radius measures except endosteal circumference. Intervention group, maturity stage, hsCRP and vitamin D concentrations, and muscle density were not associated with significant change in any bone outcomes in tibia or radius at baseline or longitudinally.
Table 2.
Tibia and radius measurements of male and female participants at baseline and change over 12 months
| Male | Female | |||||
|---|---|---|---|---|---|---|
| Baseline | Change, 0 to 12 months | Baseline (n=59) | Change, 0 to 12 months (n=54) | |||
| Median [IQR] | Mean [95% CI] | p-value* | Median [IQR] | Mean [95% CI] | p-value* | |
| TIBIA | (n=32) | (n=29) | (n=59) | (n=54) | ||
| Tibia Length, cm | 378.5 [364.5– 401.5] | 17.2 [13.7–20.6] | <0.001 | 386.0 [372.0–405.0] | 6.8 [4.7–9.0] | <0.001 |
| Trab vBMD, mg/cm3 | 256.2 [235.9–276.2] | 3.7 [0.6–6.8] | <0.05 | 267.0 [244.0–289.4] | 3.6 [0.7–6.4] | <0.05 |
| Cort vBMD, mg/cm3 | 1095.0 [1066.2–1115.2] | 6.9 [3.0–10.7] | <0.001 | 1122.9 [1090.6–1147.8] | 13.5 [11.1–15.8] | <0.001 |
| Cort Area, mm2 | 296.8 [278.4–329.7] | 28.3 [24.6–32.0] | <0.001 | 286.7 [264.8–318.1] | 14.7 [12.1–17.2] | <0.001 |
| Section Mod, mm3 | 18512 [1547–2176] | 235 [206–264] | <0.001 | 1785 [1525–1967] | 109 [86–132] | <0.001 |
| Periosteal Circ, mm | 72.7 [67.1–76.1] | 2.8 [2.5–3.2] | <0.001 | 72.3 [67.5–74.3] | 1.4 [1.2–1.7] | <0.001 |
| Endosteal Circ, mm | 36.5 [30.6– 40.5] | 0.8 [0.6–1.1] | <0.001 | 37.9 [33.4–42.0] | 0.3 [0.1–0.5] | <0.05 |
| RADIUS | (n=29) | (n=28) | (n=56) | (n=51) | ||
| Radius Length, cm | 240.0 [230.0– 251.0] | 12.3 [9.7–14.9] | <0.001 | 244.5 [231.5–259.5] | 4.7 (2.7–6.8) | <0.001 |
| Trab vBMD, mg/cm3 | 255.2 [226.6–289.1] | −5.7 [−14.1–2.6] | 0.18 | 251.4 [224.5–272.0]] | −5.2 [−8.7– −1.6] | <0.05 |
| Cort vBMD, mg/cm3 | 1120.1 [1107.4– 1134.0] | 8.3 [2.0–14.7] | <0.05 | 1137.4 [1099.6–1155.8] | 17.7 [13.7–21.7] | <0.005 |
| Cort Area, mm2 | 68.4 [65.6–72.0] | 7.5 [6.5–8.5] | <0.001 | 69.0 [63.5–77.0] | 4.4 [3.6–5.1] | <0.001 |
| Section Mod, mm3 | 1230 [1064–1521] | 29 [24–33] | <0.001 | 1253 [1067–1668] | 16 [13–20] | <0.001 |
| Periosteal Circ, mm | 33.3 [32.0–35.4] | 1.6 [1.4–1.8] | <0.001 | 33.6 [32.5–36.0]] | 0.9 [0.7–1.0] | <0.001 |
| Endosteal Circ, mm | 15.8 [14.1–19.0] | 0.5 [0.3–0.8] | <0.001 | 16.0 [13.7–18.7]] | 0.1 [0.0–0.2] | 0.20 |
P-value represents significance of magnitude of change from baseline to 12 months and were obtained using a random effects model as for Table 1. Number of observations differ for radius and tibia due to differences in number of usable pQCT scans from motion artifact.
Tibia
Table 3 summarizes the effect of baseline body composition measures and a one-unit change (delta) in body composition measures on longitudinal tibia outcomes. In males, baseline BMI was not associated with change in cortical or trabecular vBMD or cortical structure. In females, a greater BMI at the start of the study was associated with greater trabecular vBMD, section modulus and periosteal circumference. Change in BMI was not associated with significant gains in any measure of density or structure in males or females. When adjusted for muscle area, the associations between baseline and change in BMI with bone outcomes remained unchanged and nonsignificant. When adjusted for MVPA, change in BMI was associated with positive and significant gains in trabecular vBMD in males. All other associations between BMI and bone outcome remained unchanged in males and females. Throughout the duration of the study, reporting of physical activity declined and only 12 participants had measurable MVPA at the 12 month visit.
Table 3.
Effect of body composition at baseline and one-unit change over 12 months on tibia outcomes in obese adolescents
| Trabecular vBMD, mg/cm3 | Cortical vBMD, mg/cm3 | Section Modulus, mm3 | Periosteal Circumference, mm | |
|---|---|---|---|---|
| β (95% CI) | β (95% CI) | β (95% CI) | β (95% CI) | |
| Males (n=32 subjects, 89 observations) | ||||
| Baseline BMI | 0.1 (−2.7, 2.9) | 1.7 (−0.7, 4.2) | −8.7 (−28.1, 10.6) | −0.1 (−0.3, 0.2) |
| Delta BMI | −0.2 (−1.3, 0.9) | −0.1 (−1.4, 1.2) | 6.9 (−2.2, 16.0) | 0.1 (−0.0, 0.1) |
| Baseline BMI Adjusted for MVPA | 1.4 (−1.0, 3.7) | 2.3 (−0.4, 4.9) | −9.5 (−29.5, 10.5) | −0.1 (−0.4, 0.2) |
| Delta BMI Adjusted for MVPA | 4.5 (0.5, 8.4) * | 1.8 (−2.6, 6.2) | −6.6 (−21.4, 8.2) | −0.1 (−0.3, 0.0) |
| Baseline Subtotal LBMI | 1.3 (−5.3, 7.9) | 9.3 (2.9, 15.7) ** | 93.2 (5.2, 181.1) * | 1.3 (0.1, 2.4) * |
| Delta Subtotal LBMI | 1.0 (−1.5, 3.5) | 0.9 (−2.2, 4.0) | 8.7 (−11.6, 28.9) | 0.1 (−0.1, 0.3) |
| Base Subtotal FMI | −0.2 (−3.8, 3.4) | 1.0 (−2.4, 4.3) | −28.7 (−54.5, −2.9) * | −0.3 (−0.7, 0.0) |
| Delta Subtotal FMI | −0.8 (−2.6, 0.9) | −0.7 (−2.2, 0.8) | 8.7 (−5.7, 23.1) | 0.1 (−0.1, 0.2) |
| Base Subtotal LBMI Adjusted for Subtotal FMI | 1.7 (−1.1, 4.4) | 9.8 (2.7, 16.9) ** | 95.4 (9.2, 181.6) * | 1.3 (0.1, 2.4) * |
| Delta Subtotal LBMI Adjusted for Subtotal FMI | −0.1 (−0.3, 0.1) | 1.4 (−1.6, 4.4) | 11.4 (−7.9, 30.6) | 0.1 (−0.1, 0.3) |
| Baseline VFAT | 0.0 (−0.4, 0.5) | −0.3 (−0.7, 0.2) | −0.6 (−1.2, −0.0) * | −0.1 (−0.1, 0.0) |
| Delta VFAT | 0.0 (−0.2, 0.2) | 0.2 (−0.1, 0.4) | −0.0 (−0.2, 0.2) | −0.0 (−0.0, 0.0) |
| Baseline SAT | 0.0 (−0.1, 0.1) | 0.1 (−0.0, 0.2) | −0.6 (−1.4, 0.2) | −0.0 (−0.0, 0.0) |
| Delta SAT | −0.0 (−0.1, 0.0) | −0.0 (−0.0, 0.0) | 0.2 (−0.0, 0.4) | 0.0 (−0.0, 0.0) |
| Baseline VFAT Adjusted for SAT | 0.1 (−0.3, 0.6) | −0.2 (−0.6, 0.2) | −5.6 (−10.2, −1.0) * | −0.1 (−0.1, −0.0) * |
| Delta VFAT Adjusted for SAT | 0.1 (−0.2, 0.3) | 0.2 (−0.1, 0.5) | −0.5 (−2.3, 1.2) | 0.0 (−0.0, −0.0) * |
| Females (n=59 subjects, 167 observations) ✚ | ||||
| Baseline BMI | 2.6 (0.9, 4.4) ** | 1.3 (−0.3, 2.9) | 18.0 (17.4, 28.6) *** | 0.2 (0.1, 0.4) ** |
| Delta BMI | 0.7 (−0.6, 1.9) | −0.3 (−1.2, 0.6) | 1.2 (−6.7, 9.1) | −0.0 (−0.1, 0.1) |
| Baseline BMI Adjusted for MVPA | 2.5 (0.8, 4.3) ** | 1.0 (−0.6, 2.6) | 15.7 (5.8, 25.6) ** | 0.2 (0.0, 0.4) * |
| Delta BMI Adjusted for MVPA | 1,3 (−1.7, 4.3) | 0.5 (−1.6, 2.6) | 1.9 (−9.5, 13.3) | 0.0 (−0.1, 0.1) |
| Baseline Subtotal LBMI | 4.7(0.4, 9.1) * | 2.1 (−1.7, 5.0) | 61.8 (33.2, 90.3) *** | 0.8 (0.4, 1.2) *** |
| Delta Subtotal LBMI | 2.4 (−0.0, 4.9) | 0.1 (−1.7, 1.9) | 20.0 (3.9, 36.0) * | 0.2 (0.0, 0.3) * |
| Base Subtotal FMI | 3.7 (1.5, 6.0) ** | 1.9 (−0.4, 4.1) | 19.2 (2.9, 35.5) * | 0.2 (−0.0, 0.5) |
| Delta Subtotal FMI | −0.1 (−1.4, 1.2) | −0.3 (−1.6, 0.9) | −2.9 (−11.9, 6.1) | −0.0 (−0.1, 0.1) |
| Base Subtotal LBMI Adjusted for Subtotal FMI | 4.0 (−0.6, 8.5) | 2.1 (−2.0, 6.2) | 67.2 (36.6, 97.9) *** | 0.9 (0.4, 1.3) *** |
| Delta Subtotal LBMI Adjusted for Subtotal FMI | 2.3 (−0.2, 4.8) | 0.1 (−1.7, 2.0) | 20.9 (5.2, 36.6) ** | 0.2 (0.0, 0.3) * |
| Baseline VFAT | 0.1 (−0.3 0.4) | −0.3 (−0.6, −0.1) * | 1.2 (−0.5, 2.9) | 0.0 (−0.0, 0.0) |
| Delta VFAT | −0.0 (−0.1, 0.1) | −0.1 (−0.2, 0.0) | 0.3 (−0.4, 1.1) | 0.0 (−0.0, 0.0) |
| Baseline SAT | 0.1 (−0.0, 0.1) | 0.0 (−0.0, 0.1) | 0.6 (0.2, 1.0) ** | 0.0 (−0.0, 0.0) * |
| Delta SAT | 0.0 (−0.0, 0.1) | −0.0 (−0.1, 0.0) | −0.1 (−0.4, 0.2) | 0.0 (−0.0, 0.0) |
| Baseline VFAT Adjusted for SAT | −0.0 (−0.4, 0.3) | −0.4 (−0.6, −0.1) * | 1.1 (−0.1, 3.0) | 0.0 (−0.0, 0.0) |
| Delta VFAT Adjusted for SAT | −0.0 (−0.1, 0.1) | −0.1 (−0.2, 0.0) | 0.3 (−0.6, 1.1) | 0.0 (−0.0, 0.0) |
p<0.05,
p<0.01,
p<0.001. Analyses used quasi-least squares regression and included all available observations.
n=160 observations for VFAT and SAT, females
Note: MVPA = moderate-to-vigorous physical activity, LBMI = lean body mass index, FMI = fat mass index, SAT = subcutaneous adipose tissue
Greater lean body mass index at baseline was associated with higher cortical vBMD in males and trabecular vBMD in females, and section modulus and periosteal circumference in both sexes. When adjusted for fat mass index, the effect of baseline lean body mass index on vBMD was attenuated in both males and females and remained significant in males only. Change in lean body mass index, before and after adjustment for fat mass index, was not significantly associated with bone outcomes in males. In females, change in lean body mass index was positively associated with gains in section modulus and periosteal circumference. These effects remained when adjusted for fat mass index. When adjusted for vigorous physical activity status, the associations between change in lean body mass index and section modulus and periosteal circumference were attenuated and became nonsignificant.
In males, greater fat mass index and visceral fat at baseline and change in visceral fat adjusted for subcutaneous fat were associated with lower section modulus. Conversely, in females, greater fat mass index at baseline was associated with greater trabecular vBMD and section modulus. Change in fat mass index was not significantly associated with 12 month changes in density or structure for either sex. visceral fat at baseline was negatively associated with cortical vBMD in females; however, changes in visceral fat did not significantly affect change in bone density or structure. When adjusted for muscle area or MVPA, the associations between baseline and change in visceral fat for bone outcomes remained unchanged.
Findings for cortical area were similar to those of section modulus. In males, cortical area was negatively associated with baseline fat mass index (β −3.7, p<0.05) and baseline visceral fat (β −0.7, p <0.05). In females, greater BMI at baseline was positively associated with cortical area (β 2.7, p<0.001), as were baseline lean body mass index (β 7.4, p<0.001) and fat mass index (β 3.3, p<0.01); and, only change in lean body mass index was significantly associated with change in cortical area (β 1.8, p<0.05). Endosteal circumference was also assessed in both males and females and was not significantly associated with any measures of body composition at baseline or change over 12 months.
Radius
Table 4 summarizes the effect of baseline body composition measures and a one-unit change (delta) in body composition measures on longitudinal outcomes in the radius. In males, change in BMI, baseline lean body mass index and change in lean body mass index were positively associated with gains in section modulus. Baseline and change in lean body mass index were also positively associated with periosteal circumference. In females, baseline BMI and lean body mass index were positively associated with gains in trabecular vBMD, section modulus, and periosteal circumference; however, change in BMI and lean body mass index did not have a significant effect.
Table 4.
Effect of body composition at baseline and one-unit change over 12 months on radius outcomes in obese adolescents
| Trabecular vBMD, mg/cm3 | Cortical vBMD, mg/cm3 | Section Modulus, mm3 | Periosteal Circumference, mm | |
|---|---|---|---|---|
| β (95% CI) | β (95% CI) | β (95% CI) | β (95% CI) | |
| Males (n=32 subjects, 89 observations) ✚ | ||||
| Baseline BMI | 0.66 (−2.3,3.6) | −0.6 (−2.0,0.8) | 0.8 (−2.8, 4.4) | 0.0 (−0.2, 0.3) |
| Delta BMI | −0.2 (−3.6,3.3) | −2.0 (−4.6,0.7) | 1.7 (0.5, 3.0) ** | 0.1 (−0.0, 0.1) |
| Baseline Subtotal LBMI | −5.7 (−16.9, 5.4) | −0.7 (−6.9, 5.5) | 16.7 (8.2, 25.3) *** | 1.1 (0.6, 1.6) *** |
| Delta Subtotal LBMI | 3.4 (−5.7, 12.6) | −3.9 (−11.6, 3,.8) | 4.5 (2.0, 7.1) *** | 0.2 (0.1, 0.4) ** |
| Base Subtotal FMI | 1.7 (−2.0,5.4) | −0.8 (−2.9, 1.2) | −1.6 (−6.3, 3.1) | −0.1 (−0.4, 0.2) |
| Delta Subtotal FMI | −1.6 (−5.5, 2.2) | −2.1 (−5.6, 1.3) | 1.3 (−0.8, 3.4) | 0.0 (−0.1, 0.1) |
| Base Subtotal LBMI Adjusted for Subtotal FMI | −5.8 (−17.1, 5.5) | −0.2 (−7.1, 6.6) | 17.2 (8.9, 25.6) *** | 1.1 (0.6, 1.6) *** |
| Delta Subtotal LBMI Adjusted for Subtotal FMI | 3.0 (−5.7, 11.6) | −3.3 (−11.2, 4.7) | 5.0 (2.1, 7.9) *** | 0.3 (0.1, 0.4) ** |
| Baseline VFAT | 0.4 (−0.2, 1.0) | −0.2 (−0.5, 0.1) | −0.6 (−1.2, 0.1) | −0.0 (−0.1, 0.0) |
| Delta VFAT | −0.2 (−1.2, 0.7) | −0.3 (−0.7, 0.1) | 0.1(−0.3, 0.5) | 0.0 (−0.0, 0.0) |
| Baseline SAT | 0.1 (−0.0, 0.2) | 0.0 (−0.0, 0.1) | −0.0(−0.1, 0.1) | 0.0 (−0.0, 0.0) |
| Delta SAT | −0.0 (−0.1, 0.0) | 0.1(−0.1, 0.0) *** | −0.0 (−0.1, 0.0) | 0.0 (−0.0, 0.0) |
| Baseline VFAT Adjusted for SAT | 0.3 (−0.5, 1.1) | −0.2(−0.6, 0.3) | −0.5 (−1.2, 0.1) | −0.0 (−0.1, 0.0) |
| Delta VFAT Adjusted for SAT | −0.3(−1.5, 0.8) | −0.3 (−0.6, 0.1) | 0.1(−0.3, 0.5) | 0.0 (−0.0, 0.0) |
| Females (n=59 subjects, 168 observations) ✚ | ||||
| Baseline BMI | 2.5 (0.8,4.3) ** | 0.5 (−0.7,1.8) | 3.1 (0.5, 5.7) * | 0.2 (0.0, 0.4) * |
| Delta BMI | 0.1 (−1.0,1.3) | −0.8 (−2.1,0.5) | −0.2 (−1.5, 1.2) | −0.0 (−0.1, 0.1) |
| Baseline Subtotal LBMI | 5.1 (0.0, 10.1) * | −0.3 (−3.0, 2.4) | 10.6 (3.7, 17.4) ** | 0.8 (0.3, 1.1) *** |
| Delta Subtotal LBMI | −1.1 (−3.6, 1.4) | −2.6 (−5.5, 0.4) | 1.4 (−1.9, 4.8) | 0.1 (−0.0,0.0) |
| Base Subtotal FMI | 3.5 (1.1, 6.0) ** | 0.9 (−1.0, 2.9) | 3.2 (−0.9, 7.3) | 0.2 (−0.0, 0.4) |
| Delta Subtotal FMI | −0.1 (−1.4, 1.2) | −0.8 (−2.8, 1.2) | −0.5 (−2.1, 1.1) | 0.0 (−0.1, 0.0) |
| Base Subtotal LBMI Adjusted for Subtotal FMI | 3.9 (−1.5, 9.2) | −1.1 (−4.5, 2.2) | 11.4 (4.1, 18.6) *** | 0.8 (0.3, 1.2) *** |
| Delta Subtotal LBMI Adjusted for Subtotal FMI | −1.3 (−3.8, 1.3) | −2.8 (−6.0, 0.4) | 1.6 (−1.8, 5.0) | 0.1 (−0.0, 0.2) |
| Baseline VFAT | 0.1 (−0.3, 0.5) | −0.3 (−0.4, −0.1) ** | 0.3 (−0.0, 0.6) | 0.0 (−0.0, −0.0) |
| Delta VFAT | −0.1 (−0.1, 0.3) | 0.0 (−0.2, 0.1) | −0.1 (−0.3, 0.2) | 0.0 (−0.0, −0.0) |
| Baseline SAT | 0.0 (−0.1, 0.1) | 0.0 (−0.1, 0.0) | 0.1 (−0.0, 0.2) | 0.0 (−0.0, 0.0) |
| Delta SAT | −0.1 (−0.2, 0.0) | −0.1 (−0.1, 0.0) * | 0.0 (0.1, 0.1) | 0.0 (−0.0, 0.0) |
| Baseline VFAT Adjusted for SAT | 0.2 (−0.2, 0.3) | −0.3 (−0.4, −0.1) ** | 0.2 (−0.1, 0.5) | 0.0 (−0.0, 0.0) |
| Delta VFAT Adjusted for SAT | 0.1 (−0.1, 0.3) | 0.0 (−0.2, 0.1) | −0.1 (−0.3, 0.2) | 0.0 (−0.0, 0.0) |
p<0.05,
p<0.01,
p<0.001. Analyses used quasi-least squares regression and included all available observations.
VFAT and SAT, n=56 for males and n=101 for females
Note: MVPA = moderate-to-vigorous physical activity, LBMI = lean body mass index, FMI = fat mass index, SAT = subcutaneous adipose tissue
Consistent with findings in the tibia, findings for cortical area of the radius were similar to those for section modulus in males and females. In males, cortical area was positively affected by baseline lean body mass index (β 4.5, p<0.001) though change in lean body mass index did not have a significant effect. In females, cortical area was positively associated with greater baseline BMI (β 0.8, p<0.001), lean body mass index (β 1.9, p<0.001), and fat mass index (β 0.9, p<0.005). Unlike the tibia, radial periosteal circumference was significantly associated with change in lean body mass index in both males (β 0.2, p<0.005) and females (β 0.08, p<0.005).
In males, baseline and change in visceral fat and baseline subcutaneous fat did not significantly affect bone outcomes. Change in subcutaneous fat was positively associated with gains in cortical density. In females, baseline visceral fat and an increase in subcutaneous fat were negatively associated with gains in cortical vBMD
DISCUSSION
We previously reported increased bone density and strength in this cohort of obese male and female adolescents compared to a healthy-weight reference sample at baseline and before the weight loss intervention. In this longitudinal analysis, we investigated the effect of changes in body composition on density, dimensions and structural strength of the tibia and radius. Using a weight loss intervention with behavioral modification in obese adolescents compared to standard of care counseling, our study design resulted in modest variability in BMI increase over 12 months with greater weight loss present in the first 6 months of the study. This is consistent with the design of the study, in which dietary or behavioral visits were more frequent during the first six months, declining in frequency after six months. We were unable to identify sustained intervention group differences in bone outcomes, and therefore combined groups for secondary analyses.
In this context of established obesity and fluctuations in BMI, some bone outcomes were positively associated with measures of overall body size, such as BMI and lean body mass index, but changes over time in bone outcomes in response to weight loss/weight gain were not always detectable. Section modulus of the radius and tibia was more frequently associated with body composition and its change over time, but results varied by sex and skeletal site. For example, baseline lean body mass index was positively associated with section modulus of the tibia in males and females, but change in lean body mass index was associated with section modulus of the tibia in females only. (A different sex-specific pattern was observed for the radius). Interestingly, for males, fat mass index was negatively associated, and for females, positively associated with section modulus of the tibia. In general, this pattern was similar for periosteal circumference and cortical area. This study is the first to report longitudinal effects of a randomized trial on pQCT measures of bone density and structure in obese male and female adolescents.
Numerous adult studies evaluating the effect of weight loss on bone outcomes suggested a deleterious outcome in bone structure and density following weight loss.40,41 Studies evaluating bone outcomes following gastric bypass surgery have established decreased bone mass and density.42,43 Potential mechanisms include post-surgical rapid decreases in both fat and lean mass, changes to the hormonal milieu, decreased nutritional intake, increased malabsorption and increased bone turnover. Fewer studies have been conducted in adolescents following bariatric surgery, however similar significant decreases in BMD and increased bone turnover have been shown.44,45 Few prior studies evaluating the effect of nonsurgical weight management and loss on bone outcomes in obese children exist and results are mixed.6,46 In comparison to the findings after gastric bypass, the participants in our study did not experience rapid changes in weight or severe caloric restriction. Indeed, despite an intensive behavioral management intervention which resulted in more significant weight loss in the first 6 months compared to the standard care group, we did not find group differences over 12 months in patterns of weight loss or bone outcomes. Our study suggests that modest weight loss in obese adolescents, unlike that found in participants following gastric bypass, is not associated with deficits in the radius or tibia, as indicated by our outcomes.
To our knowledge, among the prior studies that have investigated the association between body composition and QCT or pQCT measures of bone in children, adolescents and young adults,14,15,25,26,47–51 only two previous studies were in obese adolescents and were limited by their cross-sectional design.4,52 In the first, Vandewalle et al. compared 51 obese adolescent males with 51 healthy age-matched and 51 bone age-matched controls and demonstrated that obesity was associated with advanced skeletal maturity, greater muscle mass, greater tibia and radius trabecular vBMD and cortical dimensions. The differences remained when adjusted for skeletal maturity; however, adjustment for muscle area and strength was not reported.52 Therefore, it is unknown whether bone strength was appropriately adapted to muscle loads in this sample.
In the second study, reported by our group, tibia and radius pQCT scans in the 91 obese participants in the current study and 51 non-obese adolescent controls were compared.4 At baseline, obese participants had greater sexual and skeletal maturity, muscle area, and tibia cortical section modulus. Differences in section modulus in these obese adolescents were attributable to advances in skeletal maturation and greater muscle area and strength. Our current study supports the finding that greater BMI at baseline was associated with greater section modulus and trabecular vBMD, however, this was found in females only and was not attenuated by addition of muscle area or physical activity status. Changes in BMI did not significantly affect bone density or structure. Recent evidence has shown that, in adults age 50 years or greater, there is a positive relationship between increases in BMI and gains in hip areal BMD, but this relationship plateaus once BMI reaches 30 kg/m2.53 This, along with our findings, suggests that at the upper bounds of BMI ranges, the ability to increase BMD to compensate for further increase in BMI reaches a plateau and modest changes seen in BMI over time do not consistently effect bone structural parameters.
In contrast to BMI, changes in lean body mass index were associated with positive changes in bone. Lean body mass index during weight loss intervention in this study was the most common predictor of significant change in bone among all measures of body composition, and findings differed by sex. Increase in lean body mass index adjusted for fat mass index in males was a positive predictor of gains in section modulus and periosteal circumference in the radius only. Conversely, females demonstrated a positive association between increases in lean body mass index adjusted for fat mass index and gains in tibia section modulus and periosteal circumference and a negative association with trabecular vBMD. Prior studies have demonstrated that augmented aBMD and vBMD and section modulus in obese children and adolescents may be attributable to greater skeletal maturity, lean mass, muscle area and strength.4,5 Our longitudinal findings are consistent with these cross-sectional studies in that increases in lean body mass index during weight loss intervention were also associated with gains in bone and differed by sex and skeletal site.
In addition to changes in lean mass, the pattern of regional fat deposition, including visceral fat and subcutaneous fat, may have important implications for bone health. Prior studies examining the association of regional adiposity on bone mineral accrual and bone outcomes in children and adolescents have yielded conflicting results and were limited by study design, skeletal sites and statistical methods used to adjust for differences in lean body mass, maturation and stature.14,16,22–26,49 Few studies have evaluated regional adiposity on QCT outcomes in obese adolescents. Gilsanz et al. used QCT to measure abdominal visceral fat and subcutaneous fat and femoral bone outcomes in a cross-sectional study in 100 healthy females, ages 15 to 25 years; however, participants with a BMI > 97th percentile were excluded.14 The study demonstrated that visceral fat and subcutaneous fat had opposing effects on appendicular skeleton characteristics. After adjusting for leg length and thigh musculature, subcutaneous fat was positively associated with cortical area while visceral fat was negatively associated with cortical area. The authors concluded that subcutaneous fat was beneficial to bone structure while visceral fat was a pathogenic fat depot. Our findings are consistent with the observation that visceral fat may have a detrimental effect on bone. Greater baseline visceral fat before and after adjusting for subcutaneous fat had a modest but significant negative effect on section modulus in the tibia for males and for cortical vBMD in both the tibia and radius in females, though changes in visceral fat over 12 months were not associated with lesser gains in any bone measure for males or females.
This study is not without limitations. First, the study design led to initial weight loss followed by weight rebound and thus resulted in small changes in net weight over time. The observation period was limited to 12 months. These study design features may not have allowed sufficient time to capture change in bone development due to changes in body composition in growing adolescents. The effect of sustained, significant weight gain on bone development in this population remains unclear. Second, this study was not powered to evaluate sex differences, and thus the sex interactions in the longitudinal findings cannot be fully understood. Sexual and skeletal development differs significantly between males and females in this age range. Pubertal development was ascertained by a self-assessment questionnaire that was previously validated54, but not in obese children. Females in the study were likely to be in the later stages of pubertal development and passed peak growth velocity and rapid bone mineral accrual compared to males. Future studies powered to examine changes in bone during peak growth and bone mass accrual combined with weight loss in both sexes are needed. Third, it was an oversight that muscle area in the forearm was not measured. Thus, the effect of change in bone strength due to changes in biomechanical loading from muscle size and strength in the forearm could not be assessed. Fourth, other than hsCRP, this study did not include serum measurements of adipokines, inflammation, growth factors, bone turnover, androgens, or insulin metabolism. Thus, the biochemical mechanisms that may drive interactions between obesity, regional adiposity and bone outcomes were not assessed. Moreover, the exclusion criteria for this study carefully screened for health complications of obesity and those with complications, particularly diabetes or prediabetes, were excluded. There is increasing evidence that there may be subgroups in obese children and adults in which the effect of obesity on bone is altered by co-morbidities, such as insulin resistance, diabetes, and hepatosteatosis.55 Future longitudinal studies in these groups and elucidating the effects of these comorbidities will more broadly address the overall effect of obesity on bone health and future fracture risk in children with obesity.
This study has several important strengths. To our knowledge, it is the first study to investigate the longitudinal relationship between obesity and pQCT measures of bone outcomes in male and female adolescents and the first to assess the longitudinal effects of weight loss intervention on cortical strength and structure in the pediatric population. In addition, the study includes the important covariates of muscle area, physical activity, sexual maturity by Tanner stage and skeletal maturity, vitamin D status, and systemic inflammation and includes measurements at both weight bearing and non-weight bearing sites.
In conclusion, we observed that weight loss intervention that resulted in modest BMI changes in obese adolescents did not result in deficits in bone mineral accrual or structure in the forearm or lower leg. Gains in lean mass were associated with increases in section modulus and this differed by sex. This study also confirms reports that visceral fat is a potential negative predictor of bone outcomes, but this also differed by sex. Additional studies evaluating the longitudinal effect of sustained and/or greater weight loss or weight gain in obese adolescents, including those with health complications, with assessment of potential biochemical mediators of body composition on bone are needed.
Supplementary Material
ACKNOWLEDGEMENTS
The study was supported by the National Institutes of Health grants R01 HD049701, K24 DK076808, and UL1 RR 024134. The authors thank the study participants, their families, the study staff, and the staff of the Clinical and Translational Research Center at the Children Hospital of Philadelphia.
REFERENCES
- 1.Ogden CL, Carroll MD, Fryar CD, Flegal KM. Prevalence of Obesity Among Adults and Youth: United States, 2011–2014. NCHS Data Brief 2015:1–8. [PubMed] [Google Scholar]
- 2.Magge SN, Stettler N, Jawad AF, Levitt Katz LE. Increased prevalence of abnormal glucose tolerance among obese siblings of children with type 2 diabetes. The Journal of pediatrics 2009;154:562–6 e1. [DOI] [PMC free article] [PubMed] [Google Scholar]
- 3.Cali AM, Caprio S. Obesity in children and adolescents. The Journal of clinical endocrinology and metabolism 2008;93:S31–6. [DOI] [PMC free article] [PubMed] [Google Scholar]
- 4.Leonard MB, Zemel BS, Wrotniak BH, et al. Tibia and radius bone geometry and volumetric density in obese compared to non-obese adolescents. Bone 2015;73:69–76. [DOI] [PMC free article] [PubMed] [Google Scholar]
- 5.Leonard MB, Shults J, Wilson BA, Tershakovec AM, Zemel BS. Obesity during childhood and adolescence augments bone mass and bone dimensions. Am J Clin Nutr 2004;80:514–23. [DOI] [PubMed] [Google Scholar]
- 6.Stettler N, Berkowtiz RI, Cronquist JL, et al. Observational study of bone accretion during successful weight loss in obese adolescents. Obesity (Silver Spring, Md) 2008;16:96–101. [DOI] [PubMed] [Google Scholar]
- 7.Clark EM, Ness AR, Bishop NJ, Tobias JH. Association between bone mass and fractures in children: a prospective cohort study. J Bone Miner Res 2006;21:1489–95. [DOI] [PMC free article] [PubMed] [Google Scholar]
- 8.Goulding A, Jones IE, Taylor RW, Manning PJ, Williams SM. More broken bones: a 4-year double cohort study of young girls with and without distal forearm fractures. J Bone Miner Res 2000;15:2011–8. [DOI] [PubMed] [Google Scholar]
- 9.Goulding A, Jones IE, Taylor RW, Williams SM, Manning PJ. Bone mineral density and body composition in boys with distal forearm fractures: a dual-energy x-ray absorptiometry study. The Journal of pediatrics 2001;139:509–15. [DOI] [PubMed] [Google Scholar]
- 10.Paulis WD, Silva S, Koes BW, van Middelkoop M. Overweight and obesity are associated with musculoskeletal complaints as early as childhood: a systematic review. Obesity reviews : an official journal of the International Association for the Study of Obesity 2014;15:52–67. [DOI] [PubMed] [Google Scholar]
- 11.Gilbert SR, MacLennan PA, Backstrom I, Creek A, Sawyer J. Altered lower extremity fracture characteristics in obese pediatric trauma patients. Journal of orthopaedic trauma 2015;29:e12–7. [DOI] [PMC free article] [PubMed] [Google Scholar]
- 12.Kessler J, Koebnick C, Smith N, Adams A. Childhood obesity is associated with increased risk of most lower extremity fractures. Clinical orthopaedics and related research 2013;471:1199–207. [DOI] [PMC free article] [PubMed] [Google Scholar]
- 13.Goulding A, Jones IE, Taylor RW, Piggot JM, Taylor D. Dynamic and static tests of balance and postural sway in boys: effects of previous wrist bone fractures and high adiposity. Gait Posture 2003;17:136–41. [DOI] [PubMed] [Google Scholar]
- 14.Gilsanz V, Chalfant J, Mo AO, Lee DC, Dorey FJ, Mittelman SD. Reciprocal relations of subcutaneous and visceral fat to bone structure and strength. The Journal of clinical endocrinology and metabolism 2009;94:3387–93. [DOI] [PMC free article] [PubMed] [Google Scholar]
- 15.Deere K, Sayers A, Viljakainen HT, et al. Distinct relationships of intramuscular and subcutaneous fat with cortical bone: findings from a cross-sectional study of young adult males and females. The Journal of clinical endocrinology and metabolism 2013;98:E1041–9. [DOI] [PMC free article] [PubMed] [Google Scholar]
- 16.Farr JN, Funk JL, Chen Z, et al. Skeletal muscle fat content is inversely associated with bone strength in young girls. J Bone Miner Res 2011;26:2217–25. [DOI] [PMC free article] [PubMed] [Google Scholar]
- 17.Bredella MA, Torriani M, Ghomi RH, et al. Determinants of bone mineral density in obese premenopausal women. Bone 2011;48:748–54. [DOI] [PMC free article] [PubMed] [Google Scholar]
- 18.Russell M, Mendes N, Miller KK, et al. Visceral fat is a negative predictor of bone density measures in obese adolescent girls. The Journal of clinical endocrinology and metabolism 2010;95:1247–55. [DOI] [PMC free article] [PubMed] [Google Scholar]
- 19.Sam S, Haffner S, Davidson MH, et al. Relation of abdominal fat depots to systemic markers of inflammation in type 2 diabetes. Diabetes Care 2009;32:932–7. [DOI] [PMC free article] [PubMed] [Google Scholar]
- 20.Utsal L, Tillmann V, Zilmer M, et al. Elevated serum IL-6, IL-8, MCP-1, CRP, and IFN-gamma levels in 10- to 11-year-old boys with increased BMI. Hormone research in paediatrics 2012;78:31–9. [DOI] [PubMed] [Google Scholar]
- 21.Rosen CJ, Klibanski A. Bone, fat, and body composition: evolving concepts in the pathogenesis of osteoporosis. The American journal of medicine 2009;122:409–14. [DOI] [PubMed] [Google Scholar]
- 22.Clark EM, Ness AR, Tobias JH. Adipose tissue stimulates bone growth in prepubertal children. The Journal of clinical endocrinology and metabolism 2006;91:2534–41. [DOI] [PMC free article] [PubMed] [Google Scholar]
- 23.Sayers A, Tobias JH. Fat mass exerts a greater effect on cortical bone mass in girls than boys. The Journal of clinical endocrinology and metabolism 2010;95:699–706. [DOI] [PMC free article] [PubMed] [Google Scholar]
- 24.Janicka A, Wren TA, Sanchez MM, et al. Fat mass is not beneficial to bone in adolescents and young adults. The Journal of clinical endocrinology and metabolism 2007;92:143–7. [DOI] [PubMed] [Google Scholar]
- 25.Farr JN, Chen Z, Lisse JR, Lohman TG, Going SB. Relationship of total body fat mass to weight-bearing bone volumetric density, geometry, and strength in young girls. Bone 2010;46:977–84. [DOI] [PMC free article] [PubMed] [Google Scholar]
- 26.Wey HE, Binkley TL, Beare TM, Wey CL, Specker BL. Cross-sectional versus longitudinal associations of lean and fat mass with pQCT bone outcomes in children. The Journal of clinical endocrinology and metabolism 2011;96:106–14. [DOI] [PMC free article] [PubMed] [Google Scholar]
- 27.Pollock NK, Laing EM, Baile CA, Hamrick MW, Hall DB, Lewis RD. Is adiposity adventageous for bone strength? A peripheral quantitative computed tomography sudy in late adolescent females. Am J Clin Nutr 2007;86:1530–8. [DOI] [PubMed] [Google Scholar]
- 28.US Department of Health and Human Services. Healthy People 2010. Washington, DC: US Department of Health and Human Services,; 2000. [Google Scholar]
- 29.Wadden TA, Berkowitz RI. Weight Reduction and Pride (WRAP) Program: Teens’ Edition. Philadelphia: University of Pennsylvania; 2001. [Google Scholar]
- 30.Wadden TA, Berkowitz RI. Weight Reduction and Pride (WRAP) Program: Parents’ Edition. Philadelphia: University of Pennsylvania; 2001. [Google Scholar]
- 31.Morris NM, Udry JR. Validation of a Self-Administered Instrument to Assess Stage of Adolescent Development. J Youth Adolescence 1980;9:271–80. [DOI] [PubMed] [Google Scholar]
- 32.Tanner JM. Assessment of skeletal maturity and prediction of adult height (TW3 method). 3rd ed. London: W.B. Saunders; 2001. [Google Scholar]
- 33.Micklesfield LK, Goedecke JH, Punyanitya M, Wilson KE, Kelly TL. Dual-energy X-ray performs as well as clinical computed tomography for the measurement of visceral fat. Obesity (Silver Spring, Md) 2012;20:1109–14. [DOI] [PMC free article] [PubMed] [Google Scholar]
- 34.Puyau MR, Adolph AL, Vohra FA, Butte NF. Validation and calibration of physical activity monitors in children. Obesity research 2002;10:150–7. [DOI] [PubMed] [Google Scholar]
- 35.Berkey CS, Colditz GA. Adiposity in adolescents: change in actual BMI works better than change in BMI z score for longitudinal studies. Ann Epidemiol 2007;17:44–50. [DOI] [PubMed] [Google Scholar]
- 36.Cole TJ, Faith MS, Pietrobelli A, Heo M. What is the best measure of adiposity change in growing children: BMI, BMI %, BMI z-score or BMI centile? Eur J Clin Nutr 2005;59:419–25. [DOI] [PubMed] [Google Scholar]
- 37.Shults J, Ratcliffe SJ, Leonard M. Improved generalized estimating equation analysis via xtqls for quasi-least squares in Stata. Stata J 2007;7:147–66. [Google Scholar]
- 38.Begg MD, Parides MK. Separation of individual-level and cluster-level covariate effects in regression analysis of correlated data. Stat Med 2003;22:2591–602. [DOI] [PubMed] [Google Scholar]
- 39.Wetzsteon RJ, Zemel BS, Shults J, Howard KM, Kibe LW, Leonard MB. Mechanical loads and cortical bone geometry in healthy children and young adults. Bone 2011;48:1103–8. [DOI] [PMC free article] [PubMed] [Google Scholar]
- 40.Soltani S, Hunter GR, Kazemi A, Shab-Bidar S. The effects of weight loss approaches on bone mineral density in adults: a systematic review and meta-analysis of randomized controlled trials. Osteoporos Int 2016. [DOI] [PubMed] [Google Scholar]
- 41.Van Loan MD, Johnson HL, Barbieri TF. Effect of weight loss on bone mineral content and bone mineral density in obese women. Am J Clin Nutr 1998;67:734–8. [DOI] [PubMed] [Google Scholar]
- 42.Yu EW. Bone Metabolism After Bariatric Surgery. Journal of Bone and Mineral Research 2014;29:1507–18. [DOI] [PMC free article] [PubMed] [Google Scholar]
- 43.Coates PS, Fernstrom JD, Fernstrom MH, Schauer PR, Greenspan SL. Gastric Bypass Surgery for Morbid Obesity Leads to an Increase in Bone Turnover and a Decrease in Bone Mass. The Journal of Clinical Endocrinology & Metabolism 2004;89:1061–5. [DOI] [PubMed] [Google Scholar]
- 44.Kaulfers AMD, Bean JA, Inge TH, Dolan LM, Kalkwarf HJ. Bone Loss in Adolescents After Bariatric Surgery. Pediatrics 2011;127:e956–e61. [DOI] [PMC free article] [PubMed] [Google Scholar]
- 45.Beamish AJ, Gronowitz E, Olbers T, Flodmark CE, Marcus C, Dahlgren J. Body composition and bone health in adolescents after Roux-en-Y gastric bypass for severe obesity. Pediatric Obesity 2016. [DOI] [PubMed] [Google Scholar]
- 46.Rourke KM, Brehm BJ, Cassell C, Sethuraman G. Effect of weight change on bone mass in female adolescents. J Am Diet Assoc 2003;103:369–72. [DOI] [PubMed] [Google Scholar]
- 47.Liu D, Manske SL, Kontulainen SA, et al. Tibial geometry is associated with failure load ex vivo: a MRI, pQCT and DXA study. Osteoporos Int 2007;18:991–7. [DOI] [PubMed] [Google Scholar]
- 48.Nagasaki K, Kikuchi T, Hiura M, Uchiyama M. Obese Japanese children have low bone mineral density after puberty. J Bone Miner Metab 2004;22:376–81. [DOI] [PubMed] [Google Scholar]
- 49.Pollock NK, Laing EM, Baile CA, Hamrick MW, Hall DB, Lewis RD. Is adiposity advantageous for bone strength? A peripheral quantitative computed tomography study in late adolescent females. Am J Clin Nutr 2007;86:1530–8. [DOI] [PubMed] [Google Scholar]
- 50.Pollock NK, Laing EM, Hamrick MW, Baile CA, Hall DB, Lewis RD. Bone and fat relationships in postadolescent black females: a pQCT study. Osteoporos Int 2011;22:655–65. [DOI] [PubMed] [Google Scholar]
- 51.Rocher E, Chappard C, Jaffre C, Benhamou CL, Courteix D. Bone mineral density in prepubertal obese and control children: relation to body weight, lean mass, and fat mass. J Bone Miner Metab 2008;26:73–8. [DOI] [PubMed] [Google Scholar]
- 52.Vandewalle S, Taes Y, Van Helvoirt M, et al. Bone size and bone strength are increased in obese male adolescents. The Journal of clinical endocrinology and metabolism 2013;98:3019–28. [DOI] [PubMed] [Google Scholar]
- 53.Shen J, Leslie WD, Nielson CM, Majumdar SR, Morin SN, Orwoll ES. Associations of Body Mass Index With Incident Fractures and Hip Structural Parameters in a Large Canadian Cohort. The Journal of Clinical Endocrinology & Metabolism 2016;101:476–84. [DOI] [PMC free article] [PubMed] [Google Scholar]
- 54.Schall JI, Semeao EJ, Stallings VA, Zemel BS. Self-assessment of sexual maturity status in children with Crohn’s disease. The Journal of pediatrics 2002;141:223–9. [DOI] [PubMed] [Google Scholar]
- 55.Dimitri P, Bishop N, Walsh JS, Eastell R. Obesity is a risk factor for fracture in children but is protective against fracture in adults: a paradox. Bone 2012;50:457–66. [DOI] [PubMed] [Google Scholar]
Associated Data
This section collects any data citations, data availability statements, or supplementary materials included in this article.