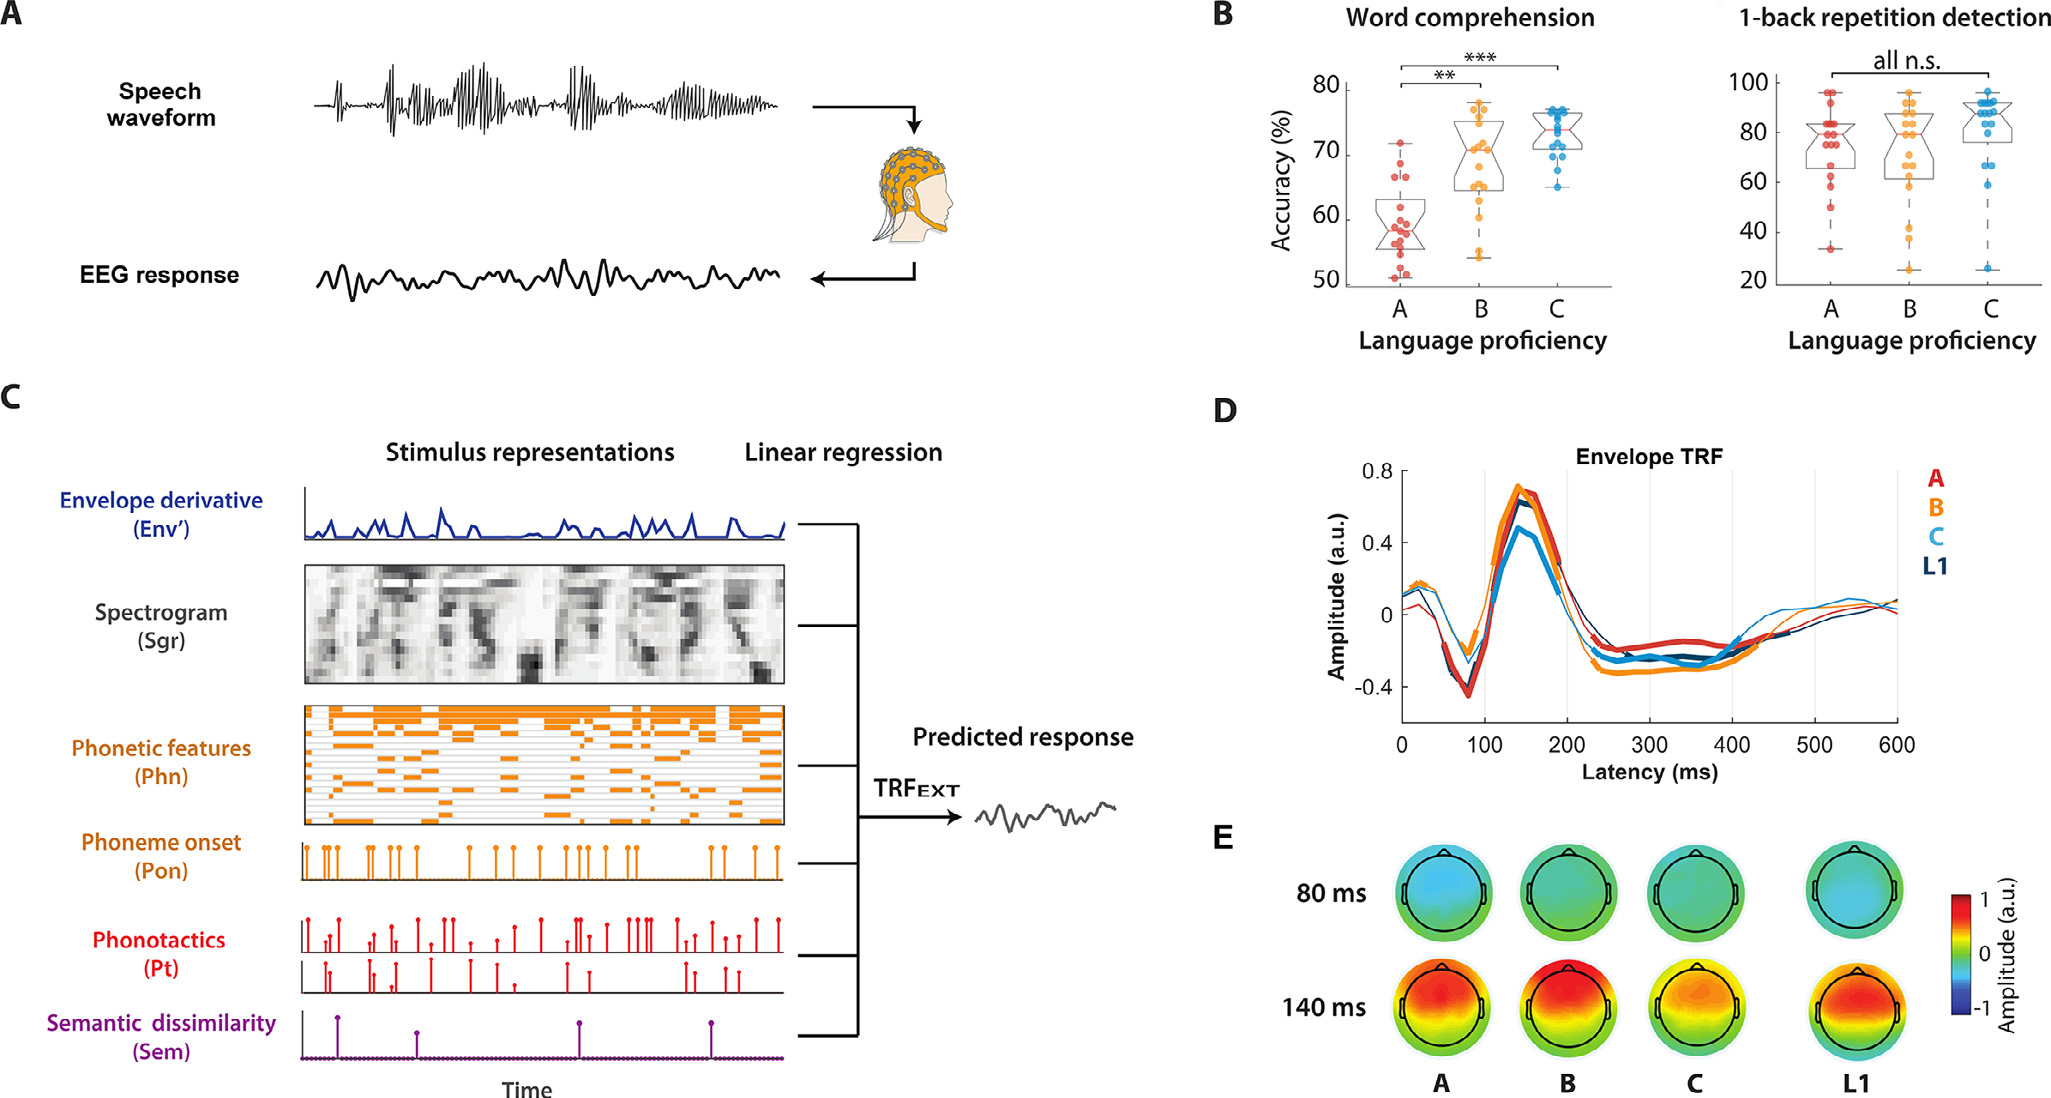
Fig. 1.

Investigating the hierarchical cortical encoding of language with the temporal response function (TRF) analysis framework. (A) Multichannel EEG signals were recorded as participants listened to audio stories. Participants were asked to press a clicker counter when they detected a one-back phrase repetition (2–4 words), which occurred 1–5 times per experimental block. At the end of each block, participants were asked to report the number of repetitions, to identify words that were spoken during the block from a list of eight and to indicate the gender of the speaker. (B) Results for the word comprehension and the 1-back detection task. Significant group differences (ANOVA, ** p<0.01, *** p<0.001) were measured for the ‘word comprehension’ score that positively correlated with proficiency. No significant effects emerged for ‘one-back tasks’ and ‘gender identification’ as they were independent from the proficiency levels. The gender identification result was not reported, as accuracy was larger than 95% for all participants. (C) Acoustic and linguistic information were extracted from the stimulus and encapsulated into data vectors and matrices. Multivariate linear regression was used to identify a linear fit that optimally predicted the EEG signal from features at multiple linguistic levels (EXT). The same procedure was also run on a more compact set of descriptors (ALL), which differed in that Sgr and Phn were replaced by Env (broadband envelope instead of a 16-band spectrogram) and Pvc (indicator variables for only vowels and consonants rather than for a 19-dimensional set of phonetic features), respectively. (D) Envelope TRF weights (TRF Env) averaged across all EEG channels at peristimulus time latencies from 0 to 600 ms. TRF Env was part of a model that was fit by including features at all other levels of interest (ALL). Thick lines indicate weights that were significantly different from zero across all subjects of a group (p < 0.05, Wilcoxon signed rank test, FDR corrected). Significant effects of group emerged on the peak-to-peak amplitude of the N1-P2 TRF complex (one-way ANOVA, p = 0.03). No significant effect of group emerged at any individual time latency (point-by-point one-way ANOVA, p > 0.05). (E) Topographies of the TRF weights across channels for two selected time latencies.
