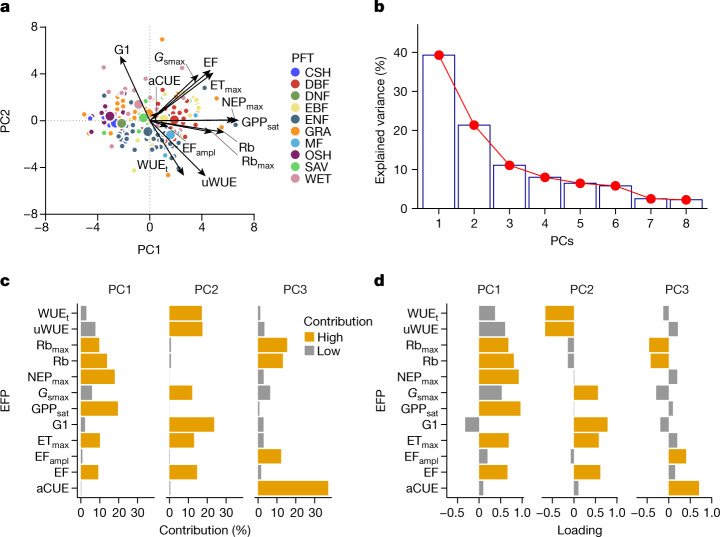
Fig. 1. Key dimensions of multivariate space of terrestrial ecosystem functions.
a, Biplot resulting from the PCA. Different colours of the points represent different plant functional types (PFTs): CSH (closed shrublands); DBF (deciduous broadleaved forest); DNF (deciduous needleleaf forests); EBF (evergreen broadleaved forest); ENF (evergreen needleleaf forest); GRA (grasslands); MF (mixed forest); OSH (open shrublands); SAV (savannah); and WET (wetlands). Bigger points represent the centroid of the distribution for each PFT. b, Explained variance for each principal component. c, d, Bar plots of the contribution (c) and loading (d) of each ecosystem functional property (EFP) to each principal component. Orange bars represent the loadings and the contributions that are considered significant (Supplementary Information 2).

