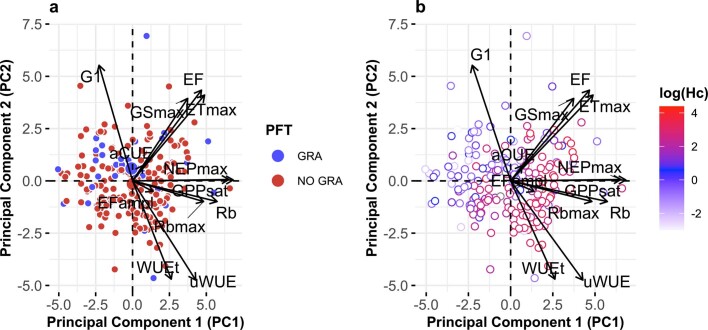
Extended Data Fig. 6. Biplot resulting from the principal component analysis.
Plot as in Fig. 1. In panel a, points are colour-coded by grass vs. non-grass classes. In panel b, the points are colour-coded according to the logarithm of vegetation height. From these results we conclude that there is not a clear cluster in the biplot for grass and non-grass vegetation. In fact, in Extended Data Fig. 6a, the sites do not cluster according to the designation to grasslands or not, but there is a clear gradient as a function of the vegetation height (Extended Data Fig. 6b).

