

Abstract
Deficiencies of the micronutrients iodine and selenium are particularly prevalent where populations consume local agricultural produce grown on soils with low iodine and selenium availability. This study focussed on such an area, Gilgit-Baltistan in Pakistan, through a geochemical survey of iodine and selenium fractionation and speciation in irrigation water and arable soil. Iodine and selenium concentrations in water ranged from 0.01–1.79 µg L−1 to 0.016–2.09 µg L−1, respectively, which are smaller than levels reported in similar mountainous areas in other parts of the world. Iodate and selenate were the dominant inorganic species in all water samples. Average concentrations of iodine and selenium in soil were 685 µg kg−1 and 209 µg kg−1, respectively, much lower than global averages of 2600 and 400 µg kg−1, respectively. The ‘reactive’ fractions (‘soluble’ and ‘adsorbed’) of iodine and selenium accounted for < 7% and < 5% of their total concentrations in soil. More than 90% of reactive iodine was organic; iodide was the main inorganic species. By contrast, 66.9 and 39.7% of ‘soluble’ and ‘adsorbed’ selenium, respectively, were present as organic species; inorganic selenium was mainly selenite. Very low distribution coefficients (kd = adsorbed/soluble; L kg−1) for iodine (1.07) and selenium (1.27) suggested minimal buffering of available iodine and selenium against leaching losses and plant uptake. These geochemical characteristics suggest low availability of iodine and selenium in Gilgit-Baltistan, which may be reflected in locally grown crops. However, further investigation is required to ascertain the status of iodine and selenium in the Gilgit-Baltistan food supply and population.
Supplementary Information
The online version contains supplementary material available at 10.1007/s10653-021-00936-9.
Keywords: Iodine, Selenium, Soil, Water, ICP-MS
Background
Iodine (I) concentration in the environment is highly variable (Wu et al., 2013). Unlike most other elements, weathering of rocks and sediments is not a major source of I for the soil–plant system (Johnson, 2003). Only a small proportion of the soil I available to plants is derived directly from rock weathering (Fuge & Johnson, 2015; Jensen et al., 2019). In contrast, oceans are major reservoirs of I (Fuge & Johnson, 2015; Manousou et al., 2019; Medrano-Macías et al., 2016) and volatilisation from ocean water and movement through the atmosphere plays an essential role in I cycling through the environment and the biosphere (Johnson, 2003; Medrano-Macías et al., 2016). Thus, I input from the atmosphere, as dry or wet precipitation, often contributes greatly to soil and plant I (Bowley et al., 2019; Fuge & Johnson, 1986; Jensen et al., 2019; Johnson, 2003). It is recognised that I concentrations are greater in coastal areas compared to inland and mountainous regions located away from coasts (Bowley et al., 2016; Fuge & Johnson, 2015; Humphrey et al., 2018). Apart from inputs, the concentration of I in soil is also affected by several factors affecting the retention capacity of the soil; these include climate, topography and soil characteristics such as organic matter concentration and pH (Bowley et al., 2019; Fuge & Johnson, 2015; Humphrey et al., 2018, 2020; Mohiuddin et al., 2019). Therefore, a soil with a large I concentration does not necessarily produce I-rich plants because of factors affecting the availability of soil I (Bowley et al., 2019; Fuge & Johnson, 1986; Mohiuddin et al., 2019). Fresh waters generally have low I concentrations (Fuge & Johnson, 2015; Johnson, 2003) unless rivers run through I-rich sedimentary rocks (Fuge, 1989; Moran et al., 2002), whereas groundwaters typically have higher I concentrations; values of up to 1890 µg L−1 have been reported in some areas (Li et al., 2013; Qian et al., 2017). Iodine is not considered essential for terrestrial plants; however, plants absorb I through their roots and leaves (Bowley et al., 2019; Medrano-Macías et al., 2016). The rate of I accumulation differs between plants (Hong et al., 2007; Whitehead, 1984). For example, Hong et al., (2007) in their study on I accumulation in various vegetables reported that I accumulation rate varied in vegetables in the order: pakchoi > celery > radish > capsicum.
Selenium (Se) is among the most widely distributed elements in the Earth’s crust and is mainly associated with sulphide minerals (Dhillon et al., 2019; Johnson et al., 2010; Wang et al., 2016). Weathering of rocks is one of the primary sources of Se in soil (Fordyce, 2013; Saha et al., 2017; Shamberger, 1981). The majority of rocks contain low concentrations of Se; therefore, Se-deficient soils are more common than ‘seleniferous’ soils (Fordyce, 2013). Selenium concentration in most soils ranges from 0.01 to 2.0 mg kg−1 although some seleniferous soils have Se concentration up to 1250 mg kg−1 (Dhillon et al., 2019; Fordyce, 2013; Fordyce et al., 2010; Winkel et al., 2012). Most surface waters have small concentrations of Se (0.06–0.12 µg L−1), whereas groundwater Se can reach up to 6000 µg L−1 in some areas (Alexander, 2015; Fordyce, 2013), presumably because of Se-rich parent material. Selenium is not considered essential for higher plants, but it is taken up by plants via sulphate (selenate) and phosphate (selenite) transporters (Alexander, 2015; Gupta & Gupta, 2017; Malagoli et al., 2015; Riaz et al., 2018; White, 2016). Plants differ in their ability to accumulate Se (Alexander, 2015; Broadley et al., 2006; Barillas et al., 2011; Ebrahimi et al. 2019; Woch & Hawrylak-Nowak, 2019; Yang et al. 2017). For example, Brassica species (rapeseed, broccoli, cabbage), allium spices (onion and garlic) and Brazil nuts accumulate higher concentration of Se compared to grasses and grains (wheat, oats, rye and barley) (Alexander, 2015; Yang et al., 2017).
Both I and Se are important micronutrients for human and animal health, and their deficiency or toxicity can result in serious health complications. Deficiencies can be resolved by supplying sufficient I and Se in the diets of affected populations via food fortification with I and Se or use of iodised salt (Hetzel, 1983; Lyons, 2018; Malagoli et al., 2015; Rayman, 2000; Sun et al., 2017;). Iodine deficiency is generally widespread in remote mountainous areas (Faridullah, 2017; Kelly & Snedden, 1958). Thus, Gilgit-Baltistan, located in the Himalayan region, has a history of I deficiency disorders (IDD) (Stewart, 1990; Shah et al., 2014; Faridullah et al., 2017; Khattak et al., 2017). Furthermore, co-existing deficiency of I and Se can result in some extreme forms of IDD (e.g. cretinism) (Eastman & Zimmermann, 2018; Lyons, 2018; Vanderpas et al., 1990); incidence of cretinism has been historically reported in Gilgit-Baltistan (Stewart, 1990). The population of Gilgit-Baltistan largely consume locally grown agricultural produce (Mountain Agriculture Research Centre, personal communication, December 2019), and there is limited data available on the status of environmental I and Se in Gilgit-Baltistan.
This study aimed to assess the status of I and Se in Gilgit-Baltistan, focussing on factors controlling I and Se concentration and speciation in soils and water and their potential availability to plants.
Methods
Study sites
Study sites were selected in five districts of Gilgit-Baltistan, which were chosen based on their accessibility and the availability of fertile agriculture land; the sites were identified with the help of colleagues from the Mountain Agriculture Research Centre (MARC). The sampling districts included Gilgit, Diamer, Hunza-Nagar (Hunza-N), Astor and Skardu (Fig. 1). Overall, twenty-six villages were surveyed with five villages from each district apart from Hunza-N where six villages were sampled. At the time of planning this project, Hunza-N was one district, but it was later divided into district Hunza and district Nagar; in this study, we have referred to Hunza-N as one district. All the sampling sites were located within the altitude range 1000 to 2700 m above sea level and approximately 1400 km from the nearest coast.
Fig. 1.

Sampling locations in Gilgit-Baltistan
Sample collection and processing
Samples were collected in July and August of 2016. Water was sampled in the villages identified for soil sampling and also between sample villages. A total of 66 irrigation water samples were collected from surface water sources including rivers, streams and lakes. Water samples were filtered at the point of sampling, using syringe filters (< 0.22 µm) and kept in the dark during transportation to the MARC laboratory in Gilgit where they were stored at 4ºC pending shipping to the University of Nottingham for elemental analysis by ICP-MS.
A composite topsoil (0–20 cm) sample was collected with a stainless-steel auger from arable land in each village. The soil was air-dried and sieved (< 2 mm) at the MARC laboratory and then shipped to the University of Nottingham where a sub-sample of 10 g was finely ground in an agate ball mill (Retsch PM400, Haan, Germany) for elemental analysis.
Sample characterisation and chemical analysis
Water
Water pH and electric conductivity (EC) were measured with a portable pH and EC meter (HANNA HI-98129) at the source. Dissolved inorganic carbon (DIC) and total carbon (TC) in water samples were measured on a Shimadzu TOC-VCPH coupled with an ASI-V unit (Shimadzu UK Ltd) after diluting the water sample (10 mL sample + 10 mL Milli-Q water (18.2 MΩ cm)) following Karim (2018). A range of concentrations (10 to 50 mg L−1) of potassium hydrogen phthalate (C8H5KO4) were used to calibrate the instrument for TC analysis, while Na2CO3 (10–50 mg L−1) was used for DIC calibration. Dissolved organic carbon (DOC) was determined by difference (TC – DIC). Selenium and I analysis were undertaken using a single quadrupole ICP-MS (model iCAP-Q, Thermo Scientific, Bremen, Germany) on samples preserved in 2% HNO3 and 1% tetra methyl ammonium hydroxide (TMAH), respectively.
Soil
Soil pH was measured using a pH meter (HANNA, model pH 209) with combined glass electrode on a soil–water suspension of 5 g soil (< 2 mm sieved) and 12.5 mL Milli-Q water after shaking on an end-over-end shaker for 30 min (Rowell, 1994). Mechanical analysis (soil texture) was undertaken by laser granulometry to determine clay (< 4 µm), silt (≥ 4 µm and ≤ 63 µm) and sand (> 63 µm) particles; the grain size < 4 µm was used to define clay particles following Kerry et al., (2009). The finely ground soil was used for measuring concentrations of total carbon and inorganic carbon in an Elemental Analyser (Model Flash EA1112, CE Instruments) and Shimadzu TOC-VCPH coupled with an SSM-5000A solids module (Shimadzu UK Ltd), respectively, following Mathers (2015) and Ligowe et al., (2019).
Oxides of Fe, Mn and Al in soil samples were determined in citrate-bicarbonate-dithionate (CBD) extracts of finely ground soil by ICP-MS following Mathers (2015) and Ligowe et al., (2019). Soil total I (IT) was extracted with 10% TMAH which was diluted to 1%, after centrifugation (2500 g), for analysis by ICP-MS as described in Watts and Mitchell (2009). Acid digestion (HNO3-HClO4-HF) of finely ground soil was undertaken in PFA vessels using a teflon-coated graphite block digester (Model A3, Analysco Ltd) controlled by a Eurotherm temperature control unit following Mathers (2015), Karim (2018) and Sanders (2018). Soil digests were diluted in Milli-Q water prior to analysis of total selenium (SeT) concentration by ICP-MS.
A three-stage sequential extraction of < 2 mm sieved soil was undertaken with potassium nitrate (0.01 M KNO3) followed by potassium dihydrogen phosphate (0.016 M KH2PO4) to determine ‘soluble’ and ‘adsorbed’ fractions of I and Se following Karim (2018) and Ligowe et al., (2020). This was followed by extraction with 10% TMAH to determine ‘Organic’ fractions of Se and I. Speciation analysis of I and Se were undertaken on the KNO3 and KH2PO4 extracts of soil samples using an HPLC unit (Dionex ISC-5000) coupled to the ICP-MS as mentioned in Bowley et al., (2016), Karim (2018) and Sanders (2018). The chromatography eluent consisted of 4.00 g L−1 NH4NO3, 20 mLl L−1 methanol, 0.00325 g L−1 NH4-EDTA and 12.1 g L−1 Tris buffer. The stationary phase used was a Hamilton PRP X-100 anion exchange column (100 × 4.1 mm; 5 µm particle size); the eluent flow rate was 1.4 mL min−1. Working standards of 5 µg L−1 I and Se reduced species (I− and SeIV) and oxidised species (IO3− and SeVI) were run between the samples at regular intervals to enable correction for instrumental drift. The peaks obtained for each sample were manually integrated using ChromeleonTM software, and then, peak areas were converted to concentration in Microsoft Excel 2016 by considering the peak area of standards (supplementary information Figs A1 and A2) as reference. Species determined included iodide, iodate, selenite and selenate; organic I and Se species were calculated by difference from the total I and Se concentrations in the ‘soluble’ and ‘adsorbed’ fractions.
Fig. 2.

Principal component analysis results of iodine and selenium in soil a location of soil samples, b parameters affecting iodine and selenium concentration in soil
Distribution coefficient of iodine and selenium in soil
The distribution coefficient (kd) is the ratio of adsorbed fraction to soluble fraction and was calculated both for I and Se, respectively, from Eq. 1.
| 1 |
where Cads and Csol are the concentrations of soil I or Se (µg kg−1) in the adsorbed and soluble fractions.
Quality control and quality assurance
All sample preparation and analysis procedures were undertaken with replication; generally, replicates were within ± 1% for individual samples. Operational blanks (OBs) were run within each batch of analysis to correct for contamination associated with the sample preparation and analytical procedures. The OBs were also used to estimate limits of detection (3 × standard deviation of 10 × OBs). A soil certified reference material (CRM) (Montana soil – NIST 2711a) was used for quality assurance of the elemental analysis. The average recovery of Se in the CRM was within ± 10% of the reported values. Calibration solutions of I and Se were always run prior to and during sample analysis by ICP-MS; internal standards were used to correct for drift (Rh in acidic matrices, Re in TMAH).
Statistical analysis
Basic statistical calculations including mean, median, standard error and standard deviation were performed in Microsoft Excel 2016. Pearson’s correlation analysis, analysis of variance (ANOVA) and principal component analysis (PCA) were performed in Minitab (version 18.1). Pearson’s correlation was used to describe association between analytes and various characteristics of water and soil samples, while ANOVA was applied to determine whether there was any significant difference between data from different locations. A p value of < 0.05 was considered significant.
Results and discussion
Water characteristics
The basic characteristics of all water samples are provided in supplementary information (Table B1). The majority of water characteristics, with the exception of pH, did not show significant variation among districts (p > 0.05). The median pH of samples was 7.9 and ranged from 7.0 to 9.2. Water EC was less than 1.0 dS m−1 in all samples with mean and median values of 0.210 and 0.173 dS m−1, respectively. Water with EC < 0.75 dS m−1 is suitable for irrigation and does not have any detrimental effect on plant growth (Bortolini et al., 2018; Zaman et al., 2018). Dissolved inorganic carbon (DIC) accounted for a large proportion (> 85%) of total carbon compared to dissolved organic carbon (DOC). Median DIC and DOC concentrations were 10.5 and 1.38 mg L−1, respectively, in all samples. The hardness of water, calculated as the apparent concentration of CaCO3, ranged from 21.1 mg L−1 to 328 mg L−1 in all water samples; concentrations of CaCO3 ≤ 60 mg L−1, 61–120 mg L−1, 121–180 mg L−1 and more than 180 mg L−1 are categorised as soft, moderately hard, hard and very hard, respectively (McGowan, 2000; USGS 2021). The sodium adsorption ratio (SAR) in all water samples was < 1 which means there is unlikely to be a problem with soil sodicity; values of SAR < 3 are suitable for a wide range of crops and unlikely to cause any soil health problems (Bortolini et al., 2018).
Iodine in water
Total iodine
Iodine concentration in all water samples (n = 66) ranged from 0.01 to 1.79 µg L−1 with a median of 0.20 µg L−1 (supplementary information Table B1). There was no significant difference in I concentration between districts (p > 0.05). The I concentrations observed in the current study are at the lower end of the global surface water concentration range (0.01–212 µg L−1) reported by Fuge and Johnson (2015). Values of I were also less than I concentration in water from other regions with similar mountainous topography, such as Kabul and Nangarhar Afghanistan with average values of 15.4 and 7.6 µg L−1, respectively (Watts & Mitchell, 2009); San Juan province in Argentina at an average 40.2 µg L−1 (Watts, 2010); Kilimajaro district in Tanzania with an average I concentration of 22.4 µg L−1 (Watts et al., 2019). However, the results for Gilgit-Baltistan are comparable with I concentrations (< 0.1 µg L−1) reported by Day and Powell-Jackson (1972) in the Himalayan region of Nepal. Multiple factors, such as distance from the sea, rainfall and underlying geology, affect I concentration in fresh water (Fuge & Johnson, 2015). The nearest coast to the study area is at a distance of about 1400 km which reduces the chances of any marine influence in water I recharge. Furthermore, the area is located within a rain shadow and hence receives rainfall of only 254 mm per year. The geology is igneous or metamorphic in nature and highly variable (Malik & Azam, 2009). The low precipitation rates and the presence of igneous/metamorphic rocks are contributing factors to the low I concentrations in waters of the study area.
Speciation of iodine in water
Iodine was present both in inorganic and organic forms in all samples, but the species composition did not follow any obvious trend with location. However, inorganic species typically accounted for a larger percentage (mean = 69%) of total I in the majority of samples. This is comparable with data reported by Karim (2018) who measured I speciation in irrigation waters from Sulaimani province of Iraqi Kurdistan and found a higher proportion of inorganic species. A correlation (Pearson r = 0.490, p < 0.001) between DIC and inorganic I was observed which may reflect local geology. The smaller proportion of organic I (mean = 31%) may reflect the low concentration of DOC in water samples. The ratio of DOC (mg L−1) to organic I (µg L−1) (DOC/Iorg) was variable (range: 0.00–23,200, median: 21.4) across samples and did not show any significant trend with location.
Inorganic I in water samples was predominantly present as iodate (IO3−), possibly reflecting the alkaline conditions as nearly all samples had pH values above 7. Moran et al., (2002) reported that IO3− is typically the predominant inorganic I species under alkaline conditions in water and soil. Our data are comparable with the findings reported by Gilfedder et al., (2009), Hansen (2011) and Karim (2018) that inorganic I is largely present as IO3− in natural water. However, iodide (I−) dominated in a subset of samples potentially a consequence of its presence in this form in rocks and soil of the watershed. Smith and Butler (1979) reported that high concentrations of I− in the Yarra river in Autralia were probably because of the dominant presence of I− in soils and rocks in the river Yarra drainage basin, assuming no conversion of inorganic I species occurred in transit. An alternative reason for I− enrichment in water may be the reduction in IO3− to I− due to microbial activity under reducing conditions (Li, Qian, et al., 2017).
Selenium in water
Total selenium
Selenium in water samples ranged from 0.016 to 2.09 µg L−1 with a median concentration of 0.161 µg L−1 (supplementary information Table B1). A significant difference was observed in Se concentration between districts (p < 0.05). The results of this study are in agreement with other investigations. Wang et al., (1994) reported that the Se concentrations in river waters of several European countries, Japan and USA are largely < 1 µg L−1. Selenium concentrations in fresh water generally fall within the range 0.1–100 µg L−1 with most of the values below 3 µg L−1 (Fordyce, 2007, 2013). Watts and Mitchell (2009) reported an average concentration of 1.84 µg L−1 Se in surface water from a similar hilly area in Argentina. The low concentration of Se in the current study probably reflects the igneous and metamorphic geology of the area which is very low in Se. There was no correlation between concentration of Se, or individual Se species, and most water characteristics, such as pH and DOC (p > 0.05). However, Se concentration had a significant correlation (r = 0.549, p < 0.01) with DIC in water samples which may either reflect a calcareous origin for the Se or its pH-dependent solubility.
Table 1.
Basic characteristics of soil samples from all sampling districts (BDL: below detection limit)
| District | Sample code | pH | SIC | SOC | Sand | Silt | Clay | 1Fe-ox | 2Mn-ox | 3Al-ox | 4Comb-ox |
|---|---|---|---|---|---|---|---|---|---|---|---|
| % | (g kg−1) | ||||||||||
| Gilgit | G01 | 7.19 | BDL | 0.983 | 79.1 | 18.7 | 2.25 | 3.33 | 0.119 | 0.322 | 3.77 |
| G02 | 7.77 | 0.008 | 1.52 | 74.2 | 22.7 | 3.12 | 3.29 | 0.097 | 0.349 | 3.73 | |
| G03 | 8.06 | 0.525 | 1.48 | 55.4 | 39.8 | 4.87 | 2.94 | 0.162 | 0.250 | 3.35 | |
| G04 | 7.22 | 0.006 | 0.661 | 54.3 | 42.8 | 2.89 | 1.92 | 0.055 | 0.250 | 2.23 | |
| G05 | 7.43 | 0.001 | 1.37 | 67.5 | 29.8 | 2.68 | 4.08 | 0.078 | 0.268 | 4.42 | |
| Diamer | D06 | 7.90 | 0.040 | 0.976 | 81.0 | 16.4 | 2.62 | 2.04 | 0.073 | 0.197 | 2.31 |
| D07 | 7.70 | BDL | 0.841 | 74.4 | 23.3 | 2.31 | 2.38 | 0.055 | 0.247 | 2.68 | |
| D08 | 7.93 | 0.024 | 0.989 | 72.5 | 23.8 | 3.71 | 3.91 | 0.137 | 0.302 | 4.35 | |
| D09 | 7.21 | 0.007 | 1.90 | 74.4 | 21.3 | 4.26 | 3.59 | 0.130 | 0.266 | 3.99 | |
| D10 | 7.89 | 0.002 | 1.04 | 70.9 | 25.6 | 3.55 | 2.38 | 0.071 | 0.223 | 2.67 | |
| Hunza-N | N11 | 8.26 | 1.41 | 1.45 | 59.4 | 34.9 | 5.68 | 6.68 | 0.160 | 0.276 | 7.11 |
| H12 | 7.87 | 0.686 | 2.75 | 61.7 | 33.8 | 4.54 | 7.27 | 0.184 | 0.294 | 7.75 | |
| N13 | 8.19 | 0.691 | 2.65 | 36.7 | 51.3 | 11.9 | 3.89 | 0.192 | 0.261 | 4.35 | |
| H14 | 8.28 | 0.469 | 1.94 | 63.9 | 33.0 | 3.06 | 4.82 | 0.084 | 0.232 | 5.14 | |
| H15 | 7.87 | 0.137 | 2.46 | 76.6 | 21.8 | 1.59 | 4.20 | 0.077 | 0.257 | 4.54 | |
| N16 | 7.92 | 0.963 | 2.77 | 60.5 | 35.9 | 3.51 | 3.24 | 0.090 | 0.186 | 3.52 | |
| Astor | A17 | 7.34 | 0.005 | 2.03 | 72.2 | 25.2 | 2.56 | 2.04 | 0.053 | 0.167 | 2.26 |
| A18 | 6.83 | BDL | 1.57 | 74.1 | 23.0 | 2.91 | 1.92 | 0.060 | 0.242 | 2.22 | |
| A19 | 6.90 | BDL | 0.410 | 82.2 | 16.3 | 1.48 | 3.23 | 0.054 | 0.220 | 3.50 | |
| A20 | 7.16 | BDL | 2.21 | 74.2 | 22.2 | 3.67 | 4.48 | 0.179 | 0.453 | 5.12 | |
| A21 | 6.70 | BDL | 1.62 | 74.8 | 21.9 | 3.35 | 2.79 | 0.096 | 0.370 | 3.26 | |
| Skardu | S22 | 8.18 | 0.038 | 1.11 | 58.6 | 38.1 | 3.33 | 1.97 | 0.081 | 0.192 | 2.24 |
| S23 | 7.51 | 0.004 | 1.99 | 69.2 | 27.8 | 2.98 | 2.51 | 0.116 | 0.307 | 2.93 | |
| S24 | 8.04 | 1.30 | 1.42 | 39.6 | 51.3 | 9.10 | 4.42 | 0.146 | 0.258 | 4.83 | |
| S25 | 8.33 | 1.54 | 1.06 | 57.2 | 36.7 | 6.11 | 4.12 | 0.110 | 0.216 | 4.45 | |
| S26 | 8.23 | 0.448 | 0.984 | 64.5 | 31.0 | 4.53 | 2.97 | 0.137 | 0.240 | 3.34 | |
1Iron oxide, 2Manganese oxide, 3Aluminium oxide, 4Combined metal oxides of Fe, Mn and Al
Speciation of selenium in water
Typically, Se was present both in inorganic and organic forms in water samples. On average, inorganic species accounted for the larger proportion (63%) of Se, while the remaining 37% was present in organic form. In all cases, the inorganic Se was present as selenate (SeVI); no selenite (SeIV) was detected in any of the water samples (supplementary information Table B1). The dominant presence of inorganic SeVI is comparable with other studies. Wang et al., (1994) reported higher concentrations of inorganic Se, with SeVI as the principal species, in river waters from Finland, Japan and USA. Other workers such as Conde and Alaejos (1997) and Cutter (1985) have also reported that SeVI was the major inorganic species in river waters from various countries. Bujdoš et al., (2005) studied Se speciation in water from Slovakia which indicated SeVI as the major species in water with pH > 7. The greater concentration of SeVI may be explained by its greater solubility, and weaker adsorption on sediments, compared to SeIV (Cary & Gissel-Nielsen, 1973; Fishbein, 1983; Wang et al., 1994; Wuilloud & Berton, 2014) or because Se is naturally present in this form in soils and rocks of the area.
Soil characteristics
Details of basic soil characteristics including soil pH, texture, concentrations of inorganic and organic carbon and metal oxides are given in Table 1. Soils fell in the pH range of 6.70 to 8.33 (neutral to moderately alkaline). There was significant variation in pH across sampling districts (p < 0.05): the district Hunza-N had the highest pH value (8.07), while Astor had the lowest pH at 6.99. Particle size analysis demonstrated that soils in all districts were largely sandy loams apart from one site each in Hunza-N (N13) and Skardu (S24) where the soils were silty loams and medium loams, respectively (Table 1).
All the sampling districts had average soil inorganic carbon (SIC) contents of < 1%, but it varied significantly between sampling districts (p < 0.05). Districts Astor and Hunza-N accounted for the lowest and highest mean SIC contents of 0.001% and 0.726%, respectively. Some individual sites in Gilgit, Diamer and Astor did not have measurable SIC (Table 1) reflecting the highly diverse geology of the parent material. Soil organic carbon (SOC) across all sites was relatively low and ranged from 0.410 to 2.77% with a significant difference observed among districts (p < 0.05); Hunza-N had the highest SOC content of 2.34%. The other four districts, i.e. Gilgit, Diamer, Astor and Skardu, had mean values of 1.20%, 1.14%, 1.57% and 1.31% SOC, respectively. The sampling sites with relatively higher SOC had more numerous perennial fruit orchards, possibly reflecting inputs of plant residues and lack of ploughing which would tend to produce greater concentrations of soil humus. Combined metal oxides of Fe, Mn and Al showed a significant variation among districts (p < 0.05) and fell in the range of 2.22 to 7.75 g kg−1. Oxides of Mn and Al were less than 1.0 g kg−1 in all samples, and concentration of Fe oxides was 5.02 g kg−1 in Hunza-N samples; the remaining four districts, i.e. Gilgit, Diamer, Astor and Skardu, had average Fe oxide concentrations of 3.11, 2.86, 2.89 and 3.20 g kg−1, respectively.
Iodine in soil
Total soil iodine
Concentrations of total soil iodine (IT) fell in the range of 273–1180 µg kg−1 with an average value of 685 µg kg−1 across all sites (Table 2). Average IT concentrations in each district, i.e. Gilgit, Diamer, Hunza-N, Astor and Skardu were 674, 895, 650, 489 and 725 µg kg−1, respectively, and showed no significant regional differences (p> 0.05). Values of IT were low compared to (i) the reported global mean value of 2600 µg kg−1 (ii) the average value (920 µg kg−1) reported for soils from other parts of Pakistan (Zia et al., 2014) (iii) values reported by Karim (2018) for the Kurdistan region of Iraq (4140 µg kg−1) and (iv) alluvium-derived soils worldwide (3560 µg kg−1) (Johnson, 2003); soils in Gilgit-Baltistan are largely alluvial in nature (Malik & Azam, 2009).
Table 2.
Concentration of iodine in soil fractions and its extractability as a proportion of total soil iodine (IT)
| District | Sample code | IT | Isol | Iads | Isol extractability | Iads extractability |
|---|---|---|---|---|---|---|
| (µg kg−1) | (%) | |||||
| Gilgit | G01 | 796 | 17.5 | 20.3 | 2.20 | 2.54 |
| G02 | 784 | 14.3 | 19.5 | 1.83 | 2.48 | |
| G03 | 391 | 9.93 | 8.87 | 2.54 | 2.27 | |
| G04 | 454 | 9.44 | 12.6 | 2.08 | 2.78 | |
| G05 | 944 | 14.3 | 18.8 | 1.52 | 2.00 | |
| Diamer | D06 | 813 | 21.9 | 19.5 | 2.70 | 2.40 |
| D07 | 1080 | 23.1 | 28.6 | 2.13 | 2.65 | |
| D08 | 1027 | 24.7 | 29.0 | 2.40 | 2.83 | |
| D09 | 1072 | 15.4 | 18.8 | 1.44 | 1.75 | |
| D10 | 482 | 11.3 | 10.2 | 2.33 | 2.11 | |
| Hunza-N | N11 | 611 | 13.9 | 17.8 | 2.28 | 2.92 |
| H12 | 877 | 15.1 | 15.4 | 1.73 | 1.76 | |
| N13 | 871 | 12.3 | 16.9 | 1.42 | 1.94 | |
| H14 | 393 | 8.63 | 9.62 | 2.20 | 2.45 | |
| H15 | 596 | 8.15 | 10.2 | 1.37 | 1.70 | |
| N16 | 555 | 8.89 | 10.6 | 1.60 | 1.91 | |
| Astor | A17 | 445 | 7.32 | 10.3 | 1.64 | 2.32 |
| A18 | 492 | 8.38 | 12.2 | 1.70 | 2.48 | |
| A19 | 273 | 7.39 | 10.5 | 2.71 | 3.83 | |
| A20 | 679 | 10.1 | 14.6 | 1.49 | 2.15 | |
| A21 | 558 | 6.66 | 11.8 | 1.19 | 2.11 | |
| Skardu | S22 | 742 | 15.9 | 17.9 | 2.14 | 2.42 |
| S23 | 1177 | 9.48 | 15.9 | 0.81 | 1.35 | |
| S24 | 728 | 14.6 | 20.0 | 2.00 | 2.74 | |
| S25 | 387 | 8.30 | 10.5 | 2.14 | 2.71 | |
| S26 | 590 | 8.38 | 11.9 | 1.42 | 2.01 | |
The majority of I in soils is generally derived from oceanic sources through atmospheric dry deposition and rainfall (Fuge & Johnson, 2015). Soil characteristics such as pH, texture and organic matter control retention and, over time, the concentration of total soil I (Bowley et al., 2019; Fuge & Johnson, 2015; Humphrey et al., 2020; Maity et al., 2017; Watts et al., 2019). Gilgit-Baltistan is far from the coast and located in the rain shadow area of the Himalayan mountains. Thus, the majority of soil I is believed to be geogenic, derived from the soil parent material. The igneous and metamorphic geology of the region (Malik & Azam, 2009) has less I than sedimentary rocks (Cox & Arai, 2014; Fuge & Johnson, 2015; Hou et al., 2009; Johnson, 2003). The input to soil IT from irrigation water is likely to be minimal because of the low concentration of I in water sources. Furthermore, the soils are predominantly sandy with low organic carbon concentrations, which limits the ability of the soils to retain I (Johnson, 2003; Johnson et al., 2003; Köhler et al., 2019; Mohiuddin et al., 2019; Watts & Mitchell, 2009; Watts et al., 2019). The alkaline nature of the soils would also limit I retention; adsorption of I onto Fe and Al oxyhydroxides and rates of conversion to humus-bound I, are both lower under alkaline conditions (Johnson et al., 2003; Shetaya et al., 2012; Söderlund et al., 2017; Wang et al., 2019; Watts & Mitchell, 2009).
Principal component analysis (PC1 and PC2) revealed that various soil characteristics, especially those related to soil texture, accounted for 60% variation in soil I concentration (Fig. 2). No relationship was observed between the concentrations of metal oxides and I in all samples (p > 0.05); metal oxides are considered to be an important adsorption site for I in soil, but adsorption is most effective at low pH values (< 5) (Bowley et al., 2019; Humphrey et al., 2020; Schmitz & Aumann, 1994; Shetaya et al., 2012; Whitehead, 1973). Soil pH did not show a correlation with IT in the majority of sampling districts except Skardu which showed a negative correlation (Pearson r = − 0.961, p = 0.009, n = 5) between soil pH and IT. The absence of correlation between soil pH and IT may simply be due to the narrow range of pH of the soils, as suggested by Karim (2018) for soils in the Iraqi region of Kurdistan with a pH range similar to that of this study. However, it is contrary to the findings of Zia et al., (2014), Watts et al., (2015) and Bowley et al., (2019) who reported a negative correlation in soils of Pakistan, Malawi and Northern Ireland, respectively. A positive correlation (r = 0.900, p = 0.037) between SOC and IT was only observed in Skardu. Soil humus is important for retaining soil I; however, the narrow range of SOC (< 3%) in all samples may have masked any underlying causal relationship. Fuge and Johnson (1986), Johnson et al., (2002), Zia et al., (2014), Watts et al., (2015) and Bowley et al., (2019) all reported a positive correlation between the concentrations of soil organic matter and I in samples from the UK, Morocco, Pakistan, Malawi and Northern Ireland, respectively. However, Karim (2018) reported no correlation with SOC in soils from Iraqi Kurdistan.
Fractionation of soil iodine
Soluble iodine
The soluble fraction of I (Isol, extracted with 0.01 M KNO3) accounted for ≤ 3% of IT in all samples (Table 2). It ranged from 6.66 to 24.7 µg kg−1 with an overall median of 10.7 µg kg−1. While the concentration of Isol varied between samples, the proportion of IT that was extractable in 0.01 M KNO3 was almost the same in each district and did not reveal significant differences between districts (p > 0.05). The small percentage of IT available as Isol (Table 2) is comparable with other studies. It was reported that that only 1–12% of I was water-soluble in soil samples from Dagestan, USSR (Johnson, 2003). Fuge and Johnson (1986) reported that less than 10% of IT was extractable with water in approximately 80% of soils mainly from Wales (n = 183). Soils from other parts of Pakistan (Zia et al., 2014) and other countries such as Ukraine (Duborska et al., 2020; Hou et al., 2009), Sweden (Hou et al., 2009), Denmark (Hansen et al., 2011), Malawi (Watts et al., 2015), Kurdistan (Karim, 2018) and Slovakia (Duborska et al., 2020) have revealed similar average proportions of water-soluble I concentrations: 2.36%, 12.7%, 3%, 4.8%, 1.38%, 1.59% and 4.4% of total soil I, respectively. Small proportions of water soluble I have also been measured for German soils (< 4% of IT) (Hou et al., 2009; Humphrey et al., 2018; Schmitz & Aumann, 1994).
Soil characteristics including pH and SOC did not show a relationship with Isol. It is possible that variation in Isol concentration across different districts may be due to the variation in I concentration in irrigation water. The concentration of I in irrigation water showed a positive correlation with Isol (r = 0.599, p = 0.001) when samples of all districts were considered as one data set (Fig. 3).
Fig. 3.
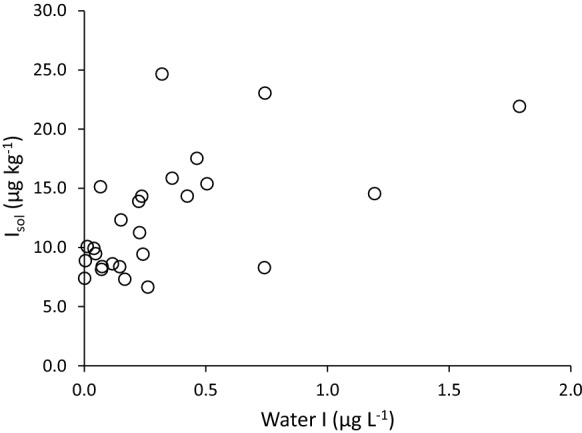
Relationship between iodine in irrigation water and soluble soil iodine (Isol) in all samples as one dataset
Adsorbed iodine
The adsorbed fraction of soil iodine (Iads, extracted with 0.016 M KH2PO4) ranged from 8.87 to 29.0 µg kg−1 and had a median concentration of 15.0 µg kg−1. It comprised < 4.0% of IT on average for all samples. Shetaya et al., (2012) and Karim (2018) reported a slightly higher ratio of 1–9% and 10.7% present as Iads in their fractionation experiments on soils from the UK and Kurdistan region of Iraq, respectively. As a percentage of IT, Iads varied across the sampling districts but showed no significant correlation with soil properties (p > 0.05), probably because of similar soil properties that might affect I adsorption (SOC, oxide content, clay content and pH) (Bowley et al., 2019; Duborska et al., 2020; Humphrey et al., 2018, 2020; Medrano-Macías et al., 2016).
The kd value for I (Eq. 1) was very low (1.07 ± 0.274), probably due to coarse texture and low organic carbon contents, suggesting very limited buffering of available soil I against leaching losses and plant uptake.
Speciation of soil iodine
Iodine speciation was carried out on the soluble and adsorbed fractions. In all of the districts most of the I in both Isol and Iads fractions was present as organic I (Tables 3 and 4). The median concentrations of organic I in the soluble and adsorbed fractions were 10.4 and 13.8 µg kg−1 which accounted for 98% and 90% of the Isol and Iads, respectively, across all samples. The large proportion of organic I is comparable with findings from other studies. Hu et al., (2007) reported that a large proportion of I (> 90%) in soils is present bound to humic and fulvic acids in samples from USA. Bowley et al., (2016, 2019) and Humphrey et al., (2020) also reported higher concentration of organic I compared to inorganic I in soils from the UK. The ratio of inorganic species, iodide (I−) and iodate (IO3−), was variable across the samples and inconsistent within different districts (supplementary information Table B2 and B3). However, on average, I− generally accounted for a larger proportion of inorganic I in both Isol (63%) and Iads (84%) fractions across all districts; this is comparable to other studies such as Yamada et al., (1999), Hu et al., (2005) and Hu etal., (2007). Iodate is sorbed more strongly in most soils than I− and is therefore less easily extracted (Fuge & Johnson, 2015; Hu et al., 2005, 2007; Humphrey et al., 2020). The other reason for a larger I− presence is probably its stability in the soil solution. Iodide is the dominant inorganic species in most soil solutions because of its stability over a wide range of Eh and pH values (Söderlund et al., 2011; Cox & Arai, 2014).
Table 3.
Concentration of selenium in soil fractions and its extractability as a proportion of total soil selenium (SeT)
| District | Sample code | SeT | Sesol | Seads | SeTMAH | Sesol | Seads | SeTMAH |
|---|---|---|---|---|---|---|---|---|
| (µg kg−1) | (% SeT) | |||||||
| Gilgit | G01 | 168 | 2.12 | 3.09 | 83.6 | 1.26 | 1.83 | 49.6 |
| G02 | 165 | 2.00 | 3.28 | 92.0 | 1.21 | 1.99 | 55.7 | |
| G03 | 289 | 4.45 | 4.26 | 139 | 1.54 | 1.47 | 48.0 | |
| G04 | 123 | 1.65 | 2.25 | 51.4 | 1.34 | 1.83 | 41.8 | |
| G05 | 202 | 2.78 | 4.09 | 149 | 1.38 | 2.03 | 73.9 | |
| Diamer | D06 | 109 | 2.11 | 2.25 | 54.3 | 1.93 | 2.06 | 49.7 |
| D07 | 199 | 3.41 | 4.61 | 106 | 1.72 | 2.32 | 53.1 | |
| D08 | 143 | 1.79 | 1.91 | 59.7 | 1.25 | 1.34 | 41.9 | |
| D09 | 120 | 1.33 | 1.26 | 70.7 | 1.12 | 1.05 | 59.2 | |
| D10 | 92.7 | 1.07 | 1.00 | 32.4 | 1.15 | 1.08 | 34.9 | |
| Hunza-N | N11 | 430 | 5.11 | 7.41 | 177 | 1.19 | 1.72 | 41.1 |
| H12 | 329 | 2.08 | 1.99 | 106 | 0.631 | 0.604 | 32.2 | |
| N13 | 453 | 6.52 | 7.82 | 293 | 1.44 | 1.73 | 64.6 | |
| H14 | 333 | 4.65 | 4.77 | 165 | 1.40 | 1.44 | 49.5 | |
| H15 | 265 | 2.20 | 1.62 | 108 | 0.830 | 0.613 | 40.6 | |
| N16 | 265 | 2.52 | 1.98 | 126 | 0.951 | 0.748 | 47.5 | |
| Astor | A17 | 151 | 1.57 | 1.13 | 66.8 | 1.04 | 0.749 | 44.2 |
| A18 | 135 | 1.64 | 1.47 | 65.2 | 1.22 | 1.09 | 48.4 | |
| A19 | 150 | 1.42 | 1.70 | 57.0 | 0.948 | 1.14 | 38.1 | |
| A20 | 172 | 1.22 | 1.26 | 61.7 | 0.708 | 0.729 | 35.8 | |
| A21 | 109 | 0.951 | 0.987 | 47.8 | 0.87 | 0.907 | 43.9 | |
| Skardu | S22 | 178 | 3.67 | 2.21 | 91.3 | 2.06 | 1.24 | 51.3 |
| S23 | 219 | 1.87 | 2.01 | 146 | 0.852 | 0.919 | 66.7 | |
| S24 | 279 | 3.82 | 5.21 | 128 | 1.37 | 1.87 | 46.1 | |
| S25 | 216 | 2.82 | 2.51 | 82.6 | 1.31 | 1.17 | 38.3 | |
| S26 | 151 | 1.40 | 0.944 | 45.5 | 0.927 | 0.626 | 30.2 | |
Selenium in soil
Total soil selenium
The average total soil Se concentration (SeT) across all districts was 209 µg kg−1 and ranged from 92.7 to 453 µg kg−1 (Table 3). Hunza-N district had the highest mean SeT of 346 µg kg−1 and was significantly different from the other four districts (p < 0.05). The districts of Gilgit, Diamer, Astor and Skardu had mean SeT concentrations of 190, 132, 143 and 208 µg kg−1, respectively, which were not significantly different from each other (p > 0.05). All sites had SeT concentrations less than the global mean of 400 µg kg−1 (Fordyce et al., 2000; Xing et al., 2015) except two locations in Hunza-N (N11 and N13) (Table 3). The generally low SeT concentrations in the area probably reflect the geology of the area, the sandy soil texture and low organic carbon concentrations. The geology of the study area is dominated by metamorphic and igneous rocks, which usually contain less Se compared to sedimentary rocks (Alexander, 2015; Fordyce et al., 2010, 2013; Koljonen, 1973). Underlying rock type has a major role in Se concentration in most soils (Fordyce, 2007, 2013; Fordyce et al., 2009). Principal components analysis revealed that a sandy soil texture was found to be negatively correlated with SeT concentration (Fig. 2). Sandy soils generally retain less Se compared to clayey soils (Antanaitis et al., 2008; Lopes et al., 2017), and organic carbon plays an important role in retaining soil Se (Gustafsson et al., 1993; Jones et al., 2017; Li, Liang, et al., 2017; Lopes et al., 2017; Supriatin et al., 2016; Xing et al., 2015). The slightly greater SeT in two sites (N11 and N13) may be a localised effect possibly reflecting long-term use of irrigation water; the corresponding irrigation waters of N11 and N13 had relatively high Se concentrations.
Moreover, soils from these sites had relatively high organic carbon contents compared to other sites. In most cases, the contribution to SeT in soils from seasonal irrigation is likely to be low because of the generally low Sew concentrations in irrigation water and the predominance of soluble SeVI in water. Soil organic carbon had a positive correlation (r = 0.509, p < 0.005) with SeT for all data considered together, but there was no correlation for intra-district data (Fig. 4). This could be the result of small sample sizes and a narrow range of %SOC in each district. The SIC also showed a positive correlation (r = 0.668, p < 0.001) with SeT and with the soil Se fractions (soluble, adsorbed and humus-bound) for the whole set of data but again there were no significant correlations for the intra-district data.
Fig. 4.
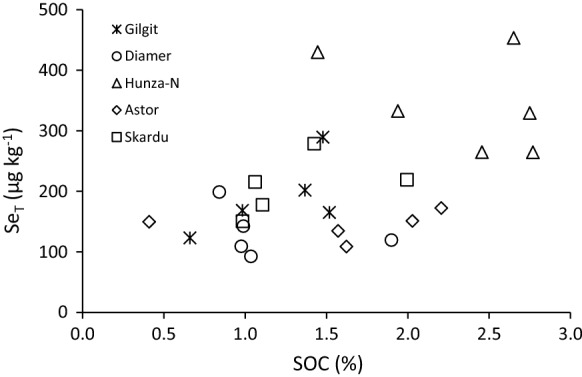
Correlation between concentrations of soil organic carbon (SOC) and total soil selenium (SeT)
The majority of the soils in this study were marginally deficient in Se based on the threshold values for Se deficiency (< 125 µg kg−1) and marginal deficiency (> 125—175 µg kg−1) in soils reported by Fordyce et al., (2009). The typically low SeT concentrations in the area are in the range for sandy soils reported in other parts of the world. For example, sandy soils in Poland, Lithuania, Russia, Finland and Canada had 140, 140, 180, 210 and 270 µg kg−1 of SeT, respectively (Kabata-Pendias & Mukherjee, 2007). Watts et al., (2010) reported 300 µg kg−1 Se in a mountainous area of San Juan in Argentina which is in a similar range to this study. Similarly, Chilimba et al., (2011) reported an average Se concentration of 194 µg kg−1 in Malawian soils which is typical of the region due to its geology and advanced weathering of many landscapes.
Fractionation of soil selenium
Soluble selenium
The soluble Se fraction (Sesol, extracted with 0.01 M KNO3) ranged from 0.95 to 6.52 µg kg−1 with mean and median values of 2.54 and 2.09 µg kg−1. A significant variation in Sesol was seen between districts (p < 0.05). The districts of Hunza-N and Astor had the highest (3.84 µg kg−1) and lowest (1.36 µg kg−1) values of Sesol, respectively. Districts Skardu, Gilgit and Diamer had mean Sesol values of 2.71, 2.60 and 1.94 µg kg−1, respectively. The concentration of Sesol as a percentage of soil SeT (%Sesol) was very low and typically accounted for < 2% of SeT across all sites (Table 3). There was no significant variation between districts (p > 0.05) which also suggests %Sesol was independent of soil SeT. The low extractability of Sesol in soils is comparable with other studies. Karim (2018) used the same sequential extraction procedure and found that %Sesol ranged from 0.096 to 2.18% in Kurdistan soils. Wang et al., (2012) reported < 1% of soluble Se in agriculture soils of Shaanxi province in China. Tan etal., (2002) and Xing et al., (2015) studied the concentration of water soluble Se in different soil types in China and found it varied from 1.07–6.69% and 0.28–1.45%, respectively. The use of a parallel single extraction method on soils from the UK showed that water-soluble Se accounted for 1.4—14% of the total soil Se (Tolu et al., 2011). Keskinen et al., (2009) studied the fate of residual Se in Finland soils, amended with Se fertilizers and observed that soluble Se account for approximately 1% of SeT. Similarly, Ligowe et al., (2020) investigated the fate of residual isotopically labelled 77Se fertilizer in Malawian soils, using the same sequential extraction procedure as used in the current study and found that the soluble fraction of Se accounted for ~ 3% of total 77Se applied in the preceding year.
Adsorbed selenium
Adsorbed Se (Seads) may represent the Se fraction associated with metal oxides. The range of Seads concentrations (0.944–7.82 µg kg−1) was similar to that of Sesol (Table 3); the average Seads in all samples was 2.81 µg kg−1. A significant variation in Seads concentration among districts was observed with Hunza-N exhibiting the highest mean value of 4.27 µg kg−1. The average concentrations in other districts (Gilgit, Skardu, Diamer and Astor) were 3.39, 2.58, 2.20 and 1.31 µg kg−1, respectively. Adsorbed Se as a percentage of soil SeT (%Seads) was not significantly different from that of Sesol (p> 0.05). For all samples, Seads recovery ranged from 0.604 to 2.32% and had a mean value of 1.31%. The average values of %Seads for Gilgit, Diamer, Skardu, Hunza-N and Astor were 1.83, 1.57, 1.17, 1.14 and 0.923%, respectively. The low recovery of Seads is comparable with other investigations. Ligowe et al., (2020) reported an average Seads recovery of < 3% in Malawian soils. Karim (2018) reported a comparable range of %Seads with a mean value of 1.88% in 97 soil samples from Kurdistan. Mathers (2015) determined %Seads for 78 Malawi and 236 UK soils and reported values of 3.12% and 2.62%, respectively. The results of a Malawi national survey, including 87 soil samples, reported %Seads values of < 1—8% (Chilimba et al., 2011); Stroud et al., (2012) reported %Seads values of 1.1–3.4% for UK soils. Some studies have also reported higher levels of %Seads: Tolu et al., (2011) measured 20% in a clay loam soil from the UK; Schilling et al., (2011) and Schilling etal., (2014) reported 12—35% and 12—27% in German and Indian soils, respectively; Keskinen et al., (2009) found 15—20% in Finnish soils.
Humus-bound selenium
Concentrations of humus-bound Se (SeTMAH) ranged from 32.4 to 293 µg kg−1 with an average value of 100 µg kg−1 considering all samples together (Table 3). There was a significant variation between districts; concentrations in Hunza-N, Gilgit, Skardu, Diamer and Astor were 162, 103, 98.9, 59.7 and 64.5 µg kg−1, respectively. The extractability of SeTMAH, as a percentage of SeT, ranged from 30 to 74% with an overall average of 47%; there was no significant variation between districts (p > 0.05). For the majority of samples (65%), SeTMAH was less than 50% of SeT. This suggests that a substantial amount of Se is present in a refractory pool, resistant to dissolution in TMAH and extractable only with the HF-HClO4-HNO3 digestion procedure. This form of Se is likely to be present within mineral structures (Mathers, 2015). Comparable (average) recovery of SeT (41%) with TMAH was observed in 97 soil samples from Kurdistan (Karim, 2018). A wide range of Se recoveries in soils and sediments using alkaline extractions has been reported, including 50% (Séby et al., 1997), 29–37% (Ponce de León et al., 2003), 35–50% (Keskinen et al., 2009), 31.8–52% (Qin et al., 2012), 31.9–70.1% (Schilling et al., 2014), in soils and sediments from Ireland, Canada, Finland, China and India, respectively.
Speciation of soil selenium
Speciation analysis was performed on both components of ‘available Se’: Sesol and Seads extracts (supplementary information Table B4 and B5). A large proportion of Sesol was present as organic-Se with an average value of 66.9% and a range from 43.5% to 89.9% considering all samples together. The average proportion of organic Sesol did not show significant variation between districts (p > 0.05) and consisted of 60.1, 65.8, 69, 75.5 and 64% of total Sesol in Gilgit, Diamer, Hunza-N, Astor and Skardu, respectively. The soluble organic Se is probably linked to soil humus acids, but soluble organic Se may also be present in parent materials. Kulp and Pratt (2004) reported that a large proportion of soluble Se was present as organic Se in different rocks from the USA. Similarly, Zhang and Moore (1996) reported a large proportion of the soluble Se fraction in wetland sediments from Montana was organically bound.
In the adsorbed fraction (Seads), there was a wide variation in speciation with the % organic Se ranging from 0 to 87% with a mean value of 39.7% for the whole data set. There was a significant difference between districts (p < 0.05) with Astor and Skardu accounting for the highest (68.4%) and lowest (19.2%), respectively. The proportions of organic Seads in other districts were: 30.6% (Hunza-N), 32.7% (Gilgit) and 49.5% (Diamer). The variation observed in adsorbed organic species is comparable with the results described in Stroud et al., (2010) who reported a range of 30 – 87% organic Se in phosphate extracts of soils from different parts of the UK. Similarly, Kulp and Pratt (2004) reported a range of 13.6–85% organic-Se in phosphate extractions of parent rocks.
The inorganic Se in Sesol and Seads was present as both SeIV and SeVI, but the proportion of inorganic Se present as SeIV in the soluble and adsorbed fractions ranged from 83.7–100% to 94.1–99.9%, respectively (supplementary information Table B4 and B5); there was no difference between districts (p > 0.05). The large proportion of SeIV in the soluble inorganic fraction contradicts other investigations in the literature, but for the adsorbed fraction the values were comparable to other studies. Karim (2018) and Wang et al., (2012) reported that inorganic Sesol was largely present as SeVI in Sesol fraction in soils from Kurdistan and China; similarly, Kulp and Pratt (2004) also reported a large proportion of SeVI in inorganic Sesol. The large proportion of SeIV in inorganic Sesol in the current study could be due to its presence in the geology of the area. By contrast, the large proportion of SeIV in inorganic Seads was consistent with other investigations. Karim (2018) found that 96% of inorganic Seads was present as SeIV. Similarly, a study of Se speciation and extractability in Dutch agricultural soils found that Se was largely present as SeIV in the adsorbed fraction extracted with ammonium oxalate (Supriatin et al., 2016). Wang et al., (2012) and Stroud et al., (2010) observed that SeIV was the only inorganic species detected in an adsorbed fraction of soil samples from Shaanxi province in China and different parts of the UK, respectively; Kulp and Pratt (2004) reported the presence of only SeIV in their adsorbed fraction.
Selenite is strongly adsorbed on soil surfaces compared to SeVI, but the average kd value for SeIV (Eq. 1) was very low (1.27 ± 0.214). As suggested for I, this was probably due to the coarse texture and low humus content of the soil.
The low kd value reflects the lack of a substantial buffer mechanism for available Se. Not only is the soluble Sesol very low, and mainly organic, but the ability of the soil to replenish Se in solution from Seads following depletion by leaching or plant uptake is also very poor. Taking all the factors above into account, it is clear that the Se status of Gilgit-Baltistan region is exceptionally low.
Conclusions
The average concentrations of IT and SeT in Gilgit-Baltistan soils were 685 and 209 µg kg−1, respectively, which are lower than the global average of soil IT (2600 µg kg−1) and SeT (400 µg kg−1), and most of the reported values for IT and SeT in other parts of the world (Figs. 5 and 6). The concentration of I and Se in soil parent materials (igneous and metamorphic rocks) is low, and the contribution from other sources (marine and rainfall) is likely to be negligible because Gilgit-Baltistan is about 1400 km away from the nearest sea and is located in a rain shadow region with minimum rainfall. Soils in the area have a coarse texture, low organic carbon and high pH which restricts their ability to retain I and Se. The input to soil IT and SeT from irrigation water is likely to be minimal because of the low concentrations of I (0.01–1.79 µg L−1) and Se (0.016–2.09 µg L−1) in irrigation water. The soluble and adsorbed fractions of soil I and Se, which are considered to be available for plant uptake, accounted for < 7% and < 3% of total soil I and Se content, respectively. The distribution coefficient (kd) for I (1.07 ± 0.274) and Se (1.27 ± 0.214) was very low suggesting very limited buffering of available I against leaching losses and plant uptake. Thus, not only are the Isol and SeSol concentrations very low but the ability of the soil to replenish I and Se in solution from Iads and Seads following depletion by leaching or plant uptake is also very poor. Furthermore, I and Se in the soluble and adsorbed fractions was predominantly present as organic species which may not be available to plants. All these factors demonstrate that the low status of I and Se in the Gilgit-Baltistan environment is the product of several co-existing factors.
Fig. 5.

Comparison of mean Gilgit-Baltistan soil IT with average soil I concentration from other studies worldwide as well as in Pakistan. The dark colour bar represents I concentration in Gilgit-Baltistan soil.
Sources aZia et al., 2017; bWatts & Mitchell, 2009; cZia et al., 2014; dFordyce et al., 2003; eWatts et al., 2010; fDissanayake & Chandrajith, 1996; gWatts et al., 2015; hJohnson et al., 2002; iAshworth, 2009; jJohnson, 2003; kFordyce et al., 2000; lGerzabek et al., 1999; mKarim, 2018; nAli, 2020; oFuge & Long, 1989; pLåg & Steinnes, 1976; qYamasaki et al., 2015; rBowley, 2013; tWatts et al., 2019
Fig. 6.

Comparison of mean Gilgit-Baltistan soil SeT concentration with average soil Se concentration from other studies worldwide. The dark colour bar represents Se concentration in Gilgit-Baltistan soil.
Sources aLopes et al., 2017; bRamkissoon 2020; cFordyce et al., 2003; dKabata-Pendias & Mukherjee, 2007; eRahman et al., 2013; fMathers, 2015; gMaksimovic et al., 1992; hTan et al., 2002; iWatts et al., 2010; jKarim, 2018; kDe Temmerman et al., 2014; lGirling, 1984; mYadav et al., 2005; nSupriatin et al., 2016; oAli, 2020; pXing et al., 2015
The low concentration of I and Se in Gilgit-Baltistan soil and water may be reflected in locally grown crops and ultimately in the local population because the population in the area largely consumes locally grown agricultural produce which restricts their access to dietary I and Se form other sources.
Supplementary Information
Below is the link to the electronic supplementary material.
Acknowledgement
We thank the University of Nottingham for providing financial support for this study.
Funding
Financial support for this study was provided by the University of Nottingham.
Data availability
The authors confirm that the summary of data supporting the findings of this study is available within the article. Detailed data are available from the corresponding author upon request.
Declarations
Conflict of interest
The authors declare that they have no conflict of interest.
Footnotes
Publisher's Note
Springer Nature remains neutral with regard to jurisdictional claims in published maps and institutional affiliations.
References
- Alexander, J. (2015). Selenium. In: Nordberg, G.F., Fowler, B.A. & Nordberg, M. (Ed.), Handbook on the Toxicology of Metals (Fourth Edition). San Diego: Academic Press.
- Ali, I.R. (2020). Selenium and iodine sorption and fixation on calcareous soils from Somalia. PhD Thesis. University of Nottingham.
- Antanaitis A, Lubyte J, Antanaitis S, Staugaitis G, Viskelis P. Selenium concentration dependence on soil properties. Journal of Food, Agriculture & Environment. 2008;6:163–167. [Google Scholar]
- Ashworth DJ. Transfers of iodine in the soil–plant–air system: solid–liquid partitioning, migration, plant uptake and volatilization. In: Preedy VR, Burrow GN, Watson R, editors. Comprehensive handbook of iodine. London: Academic Press Elsevier, London; 2009. [Google Scholar]
- Ayers, R.S. & Westcot, D.W. (1986). Water quality for agriculture. Foood and agriculture organisation of the United Nations.
- Barillas JRV, Quinn CF, Pilon-Smits EAH. Selenium accumulation in plants—phytotechnological applications and ecological implications. International Journal of Phytoremediation. 2011;13:166–178. doi: 10.1080/15226514.2011.568542. [DOI] [PubMed] [Google Scholar]
- Bortolini L, Maucieri C, Borin M. A tool for the evaluation of irrigation water quality in the arid and semi-arid regions. Agronomy. 2018;8:23. doi: 10.3390/agronomy8020023. [DOI] [Google Scholar]
- Bowley, H.E. (2013). Iodine dynamics in the terrestrial environment. PhD Thesis. University of Nottingham.
- Bowley HE, Young SD, Ander EL, Crout NMJ, Watts MJ, Bailey EH. Iodine binding to humic acid. Chemosphere. 2016;157:208–214. doi: 10.1016/j.chemosphere.2016.05.028. [DOI] [PubMed] [Google Scholar]
- Bowley HE, Young SD, Ander EL, Crout NMJ, Watts MJ, Bailey EH. Iodine bioavailability in acidic soils of Northern Ireland. Geoderma. 2019;348:97–106. doi: 10.1016/j.geoderma.2019.04.020. [DOI] [Google Scholar]
- Broadley MR, White PJ, Bryson RJ, Meacham MC, Bowen HC, Johnson SE, Hawkesford MJ, McGrath SP, Zhao F-J, Breward N, Harriman M, Tucker M. Biofortification of UK food crops with selenium. Proceedings of the Nutrition Society. 2006;65(2):169–181. doi: 10.1079/PNS2006490. [DOI] [PubMed] [Google Scholar]
- Bujdoš M, Muľová A, Kubová J, Medveď J. Selenium fractionation and speciation in rocks, soils, waters and plants in polluted surface mine environment. Environmental Geology. 2005;47:353–360. doi: 10.1007/s00254-004-1157-2. [DOI] [Google Scholar]
- Cary EE, Gissel-Nielsen G. Effect of fertilizer anions on the solubility of native and applied selenium in soil. Soil Science Society of America Journal. 1973;37:590–593. doi: 10.2136/sssaj1973.03615995003700040034x. [DOI] [Google Scholar]
- Chilimba ADC, Young SD, Black CR, Rogerson KB, Ander EL, Watts MJ, Lammel J, Broadley MR. Maize grain and soil surveys reveal suboptimal dietary selenium intake is widespread in Malawi. Scientific Reports. 2011;1:72. doi: 10.1038/srep00072. [DOI] [PMC free article] [PubMed] [Google Scholar]
- Conde J, Alaejos MS. Selenium concentrations in natural and environmental waters. Chemical Reviews. 1997;97:1979–2004. doi: 10.1021/cr960100g. [DOI] [PubMed] [Google Scholar]
- Cox EM, Arai Y. Environmental chemistry and toxicology of iodine. Advances in Agronomy. 2014;128:47–96. doi: 10.1016/B978-0-12-802139-2.00002-0. [DOI] [Google Scholar]
- Cutter GA. Determination of selenium speciation in biogenic particles and sediments. Analytical Chemistry. 1985;57:2951–2955. doi: 10.1021/ac00291a045. [DOI] [Google Scholar]
- Day TK, Powell-Jackson PR. Flouride, water hardness and endemic goitre. The Lancet. 1972;299:1135–1138. doi: 10.1016/S0140-6736(72)91370-0. [DOI] [PubMed] [Google Scholar]
- De Temmerman L, Waegeneers N, Thiry C, Du Laing G, Tack F, Ruttens A. Selenium content of Belgian cultivated soils and its uptake by field crops and vegetables. Science of The Total Environment. 2014;468–469:77–82. doi: 10.1016/j.scitotenv.2013.08.016. [DOI] [PubMed] [Google Scholar]
- Dhillon, K.S., Dhillon, S.K. & Singh, B. (2019). Genesis of seleniferous soils and associated animal and human health problems. In: Sparks, D.L. (Ed.), Advances in agronomy. Burlington: Academic Press Elsevier.
- Dissanayake CB, Chandrajith RLR. Iodine in the environment and endemic goitre in Sri Lanka. Geological Society, London, Special Publications. 1996;113:213–221. doi: 10.1144/GSL.SP.1996.113.01.17. [DOI] [Google Scholar]
- Duborska E, Bujdoš M, Urik M, Matuš P. Iodine fractionation in agricultural and forest soils using extraction methods. CATENA. 2020;195:104749. doi: 10.1016/j.catena.2020.104749. [DOI] [Google Scholar]
- Eastman, C.J. & Zimmermann, M.B. (2018). The iodine deficiency disorders. https://www.ncbi.nlm.nih.gov/books/NBK285556/ (Accessed 15 january 2021).
- Ebrahimi N, Stoddard FL, Hartikainen H, Seppänen MM. Plant species and growing season weather influence the efficiency of selenium biofortification. Nutrient Cycling in Agroecosystems. 2019;114:111–124. doi: 10.1007/s10705-019-09994-z. [DOI] [Google Scholar]
- Faridullah, Ahmad, D., Shabbir, H., Ahmed, T., Irshad, M., Alam, A. & Sardar, A. (2017). Socio-demographic characters, distribution and transformation of iodine in soil, plant and wheat grains at District Diamer, Gilgit-Baltistan, Pakistan. Environmental Geochemistry and Health, 40, 777-790 [DOI] [PubMed]
- Fishbein L. Environmental selenium and its significance. Fundamental and Applied Toxicology. 1983;3:411–419. doi: 10.1016/S0272-0590(83)80014-1. [DOI] [PubMed] [Google Scholar]
- Fordyce, F. (2007). Selenium geochemistry and health. AMBIO: A Journal of the Human Environment, 36, 94–97. [DOI] [PubMed]
- Fordyce, F.M. (2013). Selenium deficiency and toxicity in the environment. In: Selinus, O., Alloway, B. J., Centeno, J. A., Finkelman, R. B., Fuge, R., Lindh, U. & Smedley, P. (Ed.), Essentails of medical geology. USA: Springer.
- Fordyce FM, Brereton N, Hughes J, Luo W, Lewis J. An initial study to assess the use of geological parent materials to predict the Se concentration in overlying soils and in five staple foodstuffs produced on them in Scotland. Science of The Total Environment. 2010;408:5295–5305. doi: 10.1016/j.scitotenv.2010.08.007. [DOI] [PubMed] [Google Scholar]
- Fordyce, F.M., Brereton, N., Hughes, J., Reay, G., Thomas, L., Walker, A., Luo, W. & Lewis, J. (2009). The selenium content of scottish soil and food products. Food Standards Agency Scotland Project S14042.
- Fordyce FM, Johnson CC, Navaratna URB, Appleton JD, Dissanayake CB. Selenium and iodine in soil, rice and drinking water in relation to endemic goitre in Sri Lanka. Science of The Total Environment. 2000;263:127–141. doi: 10.1016/S0048-9697(00)00684-7. [DOI] [PubMed] [Google Scholar]
- Fordyce, F.M., Stewart, A.G., Ge, X., J-Y, J. & Cave, M. (2003). Environmental controls in IDD: A case ctudy in the Xinjiang province of China. British Geological Survey Technical Report, CR/01/045N.
- Fuge R, Johnson CC. The geochemistry of iodine — a review. Environmental Geochemistry and Health. 1986;8:31–54. doi: 10.1007/BF02311063. [DOI] [PubMed] [Google Scholar]
- Fuge R, Johnson CC. Iodine and human health, the role of environmental geochemistry and diet, a review. Applied Geochemistry. 2015;63:282–302. doi: 10.1016/j.apgeochem.2015.09.013. [DOI] [Google Scholar]
- Fuge R, Long A. Iodine in the soils of North Derbyshire. Environmental Geochemistry and Health. 1989;11:25–29. doi: 10.1007/BF01772069. [DOI] [PubMed] [Google Scholar]
- Fuge R. Iodine in waters: possible links with endemic goitre. Applied Geochemistry. 1989;4:203–208. doi: 10.1016/0883-2927(89)90051-6. [DOI] [Google Scholar]
- Fuge, R. (2013). Soils and iodine deficiency. In: Selinus, O., Alloway, B., Centeno, J., Finkelman, R., Fuge, R., Lindh, U. & Smedley, P. L. (Ed.), Essentials of medical geology: Revised edition. London: Springer.
- Gerzabek MH, Muramatsu Y, Strebl F, Yoshida S. Iodine and bromine contents of some Austrian soils and relations to soil characteristics. Journal of Plant Nutrition and Soil Science. 1999;162:415–419. doi: 10.1002/(SICI)1522-2624(199908)162:4<415::AID-JPLN415>3.0.CO;2-B. [DOI] [Google Scholar]
- Gilfedder BS, Petri M, Biester H. Iodine speciation and cycling in fresh waters: a case study from a humic rich headwater lake (Mummelsee) Journal of Limnology. 2009;68:396–408. doi: 10.4081/jlimnol.2009.396. [DOI] [Google Scholar]
- Girling CA. Selenium in agriculture and the environment. Agriculture, Ecosystems & Environment. 1984;11:37–65. doi: 10.1016/0167-8809(84)90047-1. [DOI] [Google Scholar]
- Gupta M, Gupta S. An overview of selenium uptake, metabolism, and toxicity in plants. Frontiers in Plant Science. 2017;7:2074. doi: 10.3389/fpls.2016.02074. [DOI] [PMC free article] [PubMed] [Google Scholar]
- Gustafsson JP, Jacks G, Stegmann B, Ross HB. Soil acidity and adsorbed anions in Swedish forest soils—long-term changes. Agriculture, Ecosystems & Environment. 1993;47:103–115. doi: 10.1016/0167-8809(93)90105-X. [DOI] [Google Scholar]
- Hansen, V. (2011). Chemical speciation analysis and environmental behaviour of 127I and 129I. PhD Thesis. Technical University of Denmark.
- Hansen V, Roos P, Aldahan A, Hou X, Possnert G. Partition of iodine (129I and 127I) isotopes in soils and marine sediments. Journal of Environmental Radioactivity. 2011;102:1096–1104. doi: 10.1016/j.jenvrad.2011.07.005. [DOI] [PubMed] [Google Scholar]
- Hetzel B. Iodine deficiency disorders (IDD) and their eradication. The Lancet. 1983;322:1126–1129. doi: 10.1016/S0140-6736(83)90636-0. [DOI] [PubMed] [Google Scholar]
- Hong, C-L., Weng, H-X., Yan, A-L. & Xie, L-L. (2007). Characteristics of iodine uptake and accumulation by vegetables. Ying yong sheng tai xue bao = The Journal of Applied Ecology, 18, 2313–2318. [PubMed]
- Hou X, Hansen V, Aldahan A, Possnert G, Lind OC, Lujaniene G. A review on speciation of iodine-129 in the environmental and biological samples. Analytica Chemica. 2009;632:181–196. doi: 10.1016/j.aca.2008.11.013. [DOI] [PubMed] [Google Scholar]
- Hu, Q., Moran, J.E. & Blackwood, V. (2007). Geochemical cycling of iodine species in soils. https://inis.iaea.org/search/search.aspx?orig_q=RN:40026411. Accessed 15 December 2019.
- Hu Q, Zhao P, Moran JE, Seaman JC. Sorption and transport of iodine species in sediments from the Savannah river and hanford sites. Journal of Contaminant Hydrology. 2005;78:185–205. doi: 10.1016/j.jconhyd.2005.05.007. [DOI] [PubMed] [Google Scholar]
- Humphrey OS, Young SD, Bailey EH, Crout NMJ, Ander EL, Watts MJ. Iodine soil dynamics and methods of measurement: a review. Environmental Science Processes & Impacts. 2018;20:288–310. doi: 10.1039/C7EM00491E. [DOI] [PubMed] [Google Scholar]
- Humphrey OS, Young SD, Crout NMJ, Bailey EH, Ander EL, Watts MJ. Short-term iodine dynamics in soil solution. Environmental Science & Technology. 2020;54:1443–14450. doi: 10.1021/acs.est.9b02296. [DOI] [PubMed] [Google Scholar]
- Jensen H, Orth B, Reiser R, Bürge D, Lehto NJ, Almond P, Gaw S, Thomson B, Lilburne L, Robinson B. Environmental parameters affecting the concentration of iodine in New Zealand pasture. Journal of Environmental Quality. 2019;48:1517–1523. doi: 10.2134/jeq2019.03.0128. [DOI] [PubMed] [Google Scholar]
- Jeong H, Kim H, Jang T. Irrigation water quality standards for indirect wastewater reuse in agriculture: a contribution toward sustainable wastewater reuse in South Korea. Water. 2016;8:169. doi: 10.3390/w8040169. [DOI] [Google Scholar]
- Johnson, C.C. (2003). The geochemistry of iodine and its application to environmental strategies for reducing the risks from iodine deficiency disorders (IDD). British Geological Survey Commissioned Report, CR/03/057N.
- Johnson CC, Fordyce FM, Rayman MP. Symposium on ‘Geographical and geological influences on nutrition’Factors controlling the distribution of selenium in the environment and their impact on health and nutrition. Proceedings of the Nutrition Society. 2010;69:119–132. doi: 10.1017/S0029665109991807. [DOI] [PubMed] [Google Scholar]
- Johnson, C.C., Fordyce, F.M. & Stewart, A.G. (2003). Environmental controls in Iodine Deficiency Disorders Project Summary Report. British Geological Survey Commissioned Report, CR/03/058N.
- Johnson, C.C., Strutt, M.H., Hmeurras, M. & Mounir, M. (2002). Iodine in the environment of the high Atlas Mountain, Morocco. British Geological Survey Comissioned Report, CR/02/196N.
- Jones GD, Droz B, Greve P, Gottschalk P, Poffet D, McGrath SP, Seneviratne SI, Smith P, Winkel LHE. Selenium deficiency risk predicted to increase under future climate change. Proceeings of the National Academy of Sciences of the United Satates of Amrica. 2017;114:2848–2853. doi: 10.1073/pnas.1611576114. [DOI] [PMC free article] [PubMed] [Google Scholar]
- Kabata-Pendias A, Mukherjee AB. Trace elements from soil to human. Springer; 2007. [Google Scholar]
- Karim, A.B. (2018). Selenium and iodine status in the Kurdistan region of Iraq. PhD Thesis. University of Nottingham.
- Kelly F, Snedden W. Prevalence and geographical distribution of endemic goitre. Bulletin of the World Health Organization. 1958;18:5. [PMC free article] [PubMed] [Google Scholar]
- Kerry R, Rawlins BG, Oliver MA, Lacinska AM. Problems with determining the particle size distribution of chalk soil and some of their implications. Geoderma. 2009;152:324–337. doi: 10.1016/j.geoderma.2009.06.018. [DOI] [Google Scholar]
- Keskinen R, Ekholm P, Yli-Halla M, Hartikainen H. Efficiency of different methods in extracting selenium from agricultural soils of Finland. Geoderma. 2009;153:87–93. doi: 10.1016/j.geoderma.2009.07.014. [DOI] [Google Scholar]
- Khattak RM, Khattak MNK, Ittermann T, Völzke H. Factors affecting sustainable iodine deficiency elimination in Pakistan: A global perspective. Journal of Epidemiology. 2017;27:249–257. doi: 10.1016/j.je.2016.04.003. [DOI] [PMC free article] [PubMed] [Google Scholar]
- Köhler F, Riebe B, Scheinost AC, König C, Hölzer A, Walther C. Sorption of iodine in soils: insight from selective sequential extractions and X-ray absorption spectroscopy. Environmental Science and Pollution Research. 2019;26:23850–23860. doi: 10.1007/s11356-019-05623-y. [DOI] [PubMed] [Google Scholar]
- Koljonen T. Selenium in certain metamorphic rocks. Bulletin of the geological society of Finland. 1973;45:107–117. doi: 10.17741/bgsf/45.2.002. [DOI] [Google Scholar]
- Kulp TR, Pratt LM. Speciation and weathering of selenium in upper cretaceous chalk and shale from South Dakota and Wyoming, USA. Geochimica et Cosmochimica Acta. 2004;68:3687–3701. doi: 10.1016/j.gca.2004.03.008. [DOI] [Google Scholar]
- Låg J, Steinnes E. Regional distribution of halogens in Norwegian forest soils. Geoderma. 1976;16:317–325. doi: 10.1016/0016-7061(76)90015-X. [DOI] [Google Scholar]
- Li J, Qian K, Yang Y, Xie X. Iodine speciation and its potential influence on iodine enrichment in groundwater from north China plain. Procedia Earth and Planetary Science. 2017;17:312–315. doi: 10.1016/j.proeps.2016.12.069. [DOI] [Google Scholar]
- Li J, Wang Y, Xie X, Zhang L, Guo W. Hydrogeochemistry of high iodine groundwater: a case study at the Datong Basin, northern China. Environmental Science: Processes & Impacts. 2013;15:848–859. doi: 10.1039/c3em30841c. [DOI] [PubMed] [Google Scholar]
- Li Z, Liang D, Peng Q, Cui Z, Huang J, Lin Z. Interaction between selenium and soil organic matter and its impact on soil selenium bioavailability: A review. Geoderma. 2017;295:69–79. doi: 10.1016/j.geoderma.2017.02.019. [DOI] [Google Scholar]
- Ligowe IS, Young SD, Ander EL, Kabambe V, Chilimba ADC, Bailey EH, Lark RM, Nalivata PC. Agronomic biofortification of leafy vegetables grown in an oxisol, alfisol and vertisol with isotopically labelled selenium (77Se) Geoderma. 2019;361:114106. doi: 10.1016/j.geoderma.2019.114106. [DOI] [Google Scholar]
- Ligowe IS, Young SD, Ander EL, Kabambe V, Chilimba ADC, Bailey EH, Lark RM, Nalivata PC. Selenium biofortification of crops on a Malawi alfisol under conservation agriculture. Geoderma. 2020;369:114115. doi: 10.1016/j.geoderma.2020.114315. [DOI] [Google Scholar]
- Lopes G, Ávila FW, Guilherme LRG. Selenium behavior in the soil environment and its implication for human health. Ciência e Agrotecnologia. 2017;41:605–615. doi: 10.1590/1413-70542017416000517. [DOI] [Google Scholar]
- Lyons G. Biofortification of cereals with foliar selenium and iodine could reduce hypothyroidism. Frontiers in Plant Science. 2018;9:730. doi: 10.3389/fpls.2018.00730. [DOI] [PMC free article] [PubMed] [Google Scholar]
- Magomedova LA, Zyrin NG, Salmanov AB. Iodine in soils and rocks of the mountains of Dagestan. Agrokhimiya. 1970;1:117–125. [Google Scholar]
- Maity S, Sandeep P, Dusane CB, Chaudhary DK, Sahu SK, Pandit GG. Studies on distribution coefficient of iodine in soil samples across industrial area. Research Journal of Chemical and Environmental Sciences. 2017;5:73–78. [Google Scholar]
- Maksimovic Z, Jovic V, Djujic I, Rsumovic M. Selenium deficiency in Yugoslavia and possible effects on health. Environmental Geochemistry and Health. 1992;14:107–111. doi: 10.1007/BF01783485. [DOI] [PubMed] [Google Scholar]
- Malagoli, M., Schiavon, M., dall’Acqua, S. & Pilon-Smits, E.A.H. (2015). Effects of selenium biofortification on crop nutritional quality. Frontiers in Plant Science, 6, 280. [DOI] [PMC free article] [PubMed]
- Malik, M.A. & Azam, M. (2009). Impact evaluation of existing irrigation and agronomic practices on irrigation efficiency and crop yields in northern areas of Pakistan. Pakistan Council of Research in Water Resources Publication No.139–2009.
- Manousou S, Stål M, Eggertsen R, Hoppe M, Hulthén L, Nyström HF. Correlations of water iodine concentration to earlier goitre frequency in Sweden—an iodine sufficient country with long-term iodination of table salt. Environmental Health and Preventive Medicine. 2019;24:73. doi: 10.1186/s12199-019-0821-9. [DOI] [PMC free article] [PubMed] [Google Scholar]
- Mathers, A. (2015). Modelling the fate of selenium added to soil to improve biofortification efficiency. PhD Thesis. University of Nottingham.
- Matos RP, Lima VMP, Windmöller CC, Nascentes CC. Correlation between the natural levels of selenium and soil physicochemical characteristics from the Jequitinhonha Valley (MG), Brazil. Journal of Geochemical Exploration. 2017;172:195–202. doi: 10.1016/j.gexplo.2016.11.001. [DOI] [Google Scholar]
- McGowan W. Water processing: residential, commercial, light-industrial. 3. Water Quality Association; 2000. [Google Scholar]
- Medrano-Macías J, Leija-Martínez P, González-Morales S, Juárez-Maldonado A, Benavides-Mendoza A. Use of iodine to biofortify and promote growth and stress tolerance in crops. Frontiers in Plant Science. 2016;7:1146–1146. doi: 10.3389/fpls.2016.01146. [DOI] [PMC free article] [PubMed] [Google Scholar]
- Mohiuddin M, Irshad M, Ping A, Hussain Z, Shahzad M. Bioavailability of iodine to mint from soil applied with selected amendments. Environmental Pollutants and Bioavailability. 2019;31:138–144. doi: 10.1080/26395940.2019.1588077. [DOI] [Google Scholar]
- Moran, J.E., Oktay, S.D. & Santschi, P.H. (2002). Sources of iodine and iodine 129 in rivers. Water Resources Research, 38, 24–1–24–10.
- Ponce De León CA, Denicola K, Bayón MM, Caruso JA. Sequential extractions of selenium soils from Stewart lake: total selenium and speciation measurements with ICP-MS detection. Journal of Environmental Monitoring. 2003;5:435–440. doi: 10.1039/B301108A. [DOI] [PubMed] [Google Scholar]
- Qian K, Li J, Xie X, Wang Y. Organic and inorganic colloids impacting total iodine behavior in groundwater from the Datong Basin, China. Science of the Total Environment. 2017;601–602:380–390. doi: 10.1016/j.scitotenv.2017.05.127. [DOI] [PubMed] [Google Scholar]
- Qin H-b, Zhu J-m, Su H. Selenium fractions in organic matter from Se-rich soils and weathered stone coal in selenosis areas of China. Chemosphere. 2012;86:626–633. doi: 10.1016/j.chemosphere.2011.10.055. [DOI] [PubMed] [Google Scholar]
- Rahman MM, Erskine W, Zaman MS, Thavarajah P, Thavarajah D, Siddique KHM. Selenium biofortification in lentil (Lens culinaris Medikus subsp. culinaris): Farmers' field survey and genotype×environment effect. Food Research International. 2013;54:1596–1604. doi: 10.1016/j.foodres.2013.09.008. [DOI] [Google Scholar]
- Ramkissoon, C. (2020). Selenium dynamics in cereal biofortification: optimising fertiliser strategies and assessing residual fate. PhD thesis, University of Nottingham.
- Rayman MP. The importance of selenium to human health. The Lancet. 2000;356:233–241. doi: 10.1016/S0140-6736(00)02490-9. [DOI] [PubMed] [Google Scholar]
- Riaz, A., Abbas, A., Noor-ul-Huda., Mubeen, H., Ibrahim, N. & Raza, S. (2018). Methods to Enhance Selenium in Wheat through Biofortification: A Review. Journal of Biotechnology & Biomaterials, 8, 1000282
- Rowell DL. Soil science methods and applications. Longman Scientific and Technical; 1994. [Google Scholar]
- Rucklidge J, Kilius L, Fuge R. 129I in moss down-wind from the Sellafield nuclear fuel reprocessing plant. Nuclear Instruments and Methods in Physics Research Section B: Beam Interactions with Materials and Atoms. 1994;92:417–420. doi: 10.1016/0168-583X(94)96046-1. [DOI] [Google Scholar]
- Saha S, Fayiga A, Sonon L. Selenium in the Soil-Plant Environment: A Review. International Journal of Applied Agricultural Sciences. 2017;3:1–18. doi: 10.11648/j.ijaas.20170301.11. [DOI] [Google Scholar]
- Sanders, H. K. (2018). Interactions between anionic radionuclides (129I, 79Se and 99Tc) and soil geocolloids. PhD thesis. University of Nottingham.
- Schilling K, Johnson TM, Mason PRD. A sequential extraction technique for mass-balanced stable selenium isotope analysis of soil samples. Chemical Geology. 2014;381:125–130. doi: 10.1016/j.chemgeo.2014.04.014. [DOI] [Google Scholar]
- Schilling K, Johnson TM, Wilcke W. Selenium partitioning and stable isotope ratios in urban topsoils. Soil Science Society of America Journal. 2011;75:1354–1364. doi: 10.2136/sssaj2010.0377. [DOI] [Google Scholar]
- Schmitz K, Aumann DC. Why are the soil-to-pasture transfer factors, as determined by field measurements, for 127I lower than for 129I? Journal of Environmental Radioactivity. 1994;24:91–100. doi: 10.1016/0265-931X(94)90027-2. [DOI] [Google Scholar]
- Séby F, Gautier MP, Lespés G, Astruc M. Selenium speciation in soils after alkaline extraction. Science of The Total Environment. 1997;207:81–90. doi: 10.1016/S0048-9697(97)00269-6. [DOI] [Google Scholar]
- Shamberger RJ. Selenium in the environment. Science of the Total Environment. 1981;17:59–74. doi: 10.1016/0048-9697(81)90108-X. [DOI] [PubMed] [Google Scholar]
- Shetaya WH, Young SD, Watts MJ, Ander EL, Bailey EH. Iodine dynamics in soils. Geochimica et Cosmochimica Acta. 2012;77:457–473. doi: 10.1016/j.gca.2011.10.034. [DOI] [Google Scholar]
- Smith JD, Butler ECV. Speciation of dissolved iodine in estuarine waters. Nature. 1979;277:468. doi: 10.1038/277468a0. [DOI] [Google Scholar]
- Söderlund M, Lusa M, Lehto J, Hakanen M, Vaaramaa K, Lahdenperä A-M. Sorption of iodine, chlorine, technetium and cesium in soil. Working Report. 2011;4:130. [Google Scholar]
- Söderlund M, Virkanen J, Aromaa H, Gracheva N, Lehto J. Sorption and speciation of iodine in boreal forest soil. Journal of Radioanalytical and Nuclear Chemistry. 2017;311:549–564. doi: 10.1007/s10967-016-5022-z. [DOI] [Google Scholar]
- Stewart A. For debate: drifting continents and endemic goitre in northern Pakistan. British Medical Journal. 1990;300:1507–1512. doi: 10.1136/bmj.300.6738.1507. [DOI] [PMC free article] [PubMed] [Google Scholar]
- Stroud JL, Broadley MR, Foot I, Fairweather-Tait SJ, Hart DJ, Hurst R, Knott P, Mowat H, Norman K, Scott P, Tucker M, White PJ, McGrath SP, Zhao FJ. Soil factors affecting selenium concentration in wheat grain and the fate and speciation of Se fertilisers applied to soil. Plant Science. 2010;332:19–30. [Google Scholar]
- Stroud JL, Mcgrath SP, Zhao FJ. Selenium speciation in soil extracts using LC-ICP-MS. International Journal of Environmental Analytical Chemistry. 2012;92:222–236. doi: 10.1080/03067310903111661. [DOI] [Google Scholar]
- Sun D, Codling K, Chang S, Zhang S, Shen H, Su X, Chen Z, Scherpbier RW, Yan J. Eliminating iodine deficiency in China: achievements, challenges and global implications. Nutrients. 2017;9:361. doi: 10.3390/nu9040361. [DOI] [PMC free article] [PubMed] [Google Scholar]
- Supriatin S, Weng L, Comans RNJ. Selenium-rich dissolved organic matter determines selenium uptake in wheat grown on Low-selenium arable land soils. Plant and Soil. 2016;408:73–94. doi: 10.1007/s11104-016-2900-7. [DOI] [Google Scholar]
- Takaku Y, Shimamura T, Masuda K, Igarashi Y. Iodine Determination in natural and tap water using inductively coupled plasma mass spectrometry. Analytical Sciences. 1995;11:823–827. doi: 10.2116/analsci.11.823. [DOI] [Google Scholar]
- Tan JA, Zhu W, Wang W, Li R, Hou S, Wang D, Yang L. Selenium in soil and endemic diseases in China. Science of The Total Environment. 2002;284:227–235. doi: 10.1016/S0048-9697(01)00889-0. [DOI] [PubMed] [Google Scholar]
- Tolu J, Le Hécho I, Bueno M, Thiry Y, Potin-Gautier M. Selenium speciation analysis at trace level in soils. Analytica Chimica Acta. 2011;684:126–133. doi: 10.1016/j.aca.2010.10.044. [DOI] [PubMed] [Google Scholar]
- United States Geological Survey (USGS). (2021). Hardness of water. https://www.usgs.gov/special-topic/water-science-school/science/hardness-water?qt-science_center_objects=0#qt-science_center_objects (Accessed 25 January 2021).
- Vanderpas JB, Contempre B, Duale NL, Goossens W, Bebe N, Thorpe R, Ntambue K, Dumont J, Thilly CH, Diplock AT. Iodine and selenium deficiency associated with cretinism in northern Zaire. The American Journal of Clinical Nutrition. 1990;52:1087–1093. doi: 10.1093/ajcn/52.6.1087. [DOI] [PubMed] [Google Scholar]
- Wang C, Li S, Wang H, Fu J. Selenium minerals and the recovery of selenium from copper refinery anode slimes. The Journal of the South African Institute of Mining and Metallurgy. 2016;116:593–600. doi: 10.17159/2411-9717/2016/v116n6a16. [DOI] [Google Scholar]
- Wang D, Alfthan G, Aro A, Lahermo P, Väänänen P. The impact of selenium fertilisation on the distribution of selenium in rivers in Finland. Agriculture, Ecosystems & Environment. 1994;50:133–149. doi: 10.1016/0167-8809(94)90132-5. [DOI] [Google Scholar]
- Wang G, Qafoku NP, Szecsody JE, Strickland CE, Brown CF, Freedman VL. Time-dependent iodate and iodide adsorption to Fe oxides. ACS Earth and Space Chemistry. 2019;3:2415–2420. doi: 10.1021/acsearthspacechem.9b00145. [DOI] [Google Scholar]
- Wang S, Liang D, Wang D, Wei W, Fu D, Lin Z. Selenium fractionation and speciation in agriculture soils and accumulation in corn (zea mays L.) under field conditions in Shaanxi Province. China. Science of The Total Environment. 2012;427–428:159–164. doi: 10.1016/j.scitotenv.2012.03.091. [DOI] [PubMed] [Google Scholar]
- Watts MJ, Mitchell CJ. A pilot study on iodine in soils of Greater Kabul and Nangarhar provinces of Afghanistan. Environmental Geochemistry and Health. 2009;31:503–509. doi: 10.1007/s10653-008-9202-9. [DOI] [PubMed] [Google Scholar]
- Watts MJ, Joy EJM, Young SD, Broadley MR, Chilimba ADC, Gibson RS, Siyame EWP, Kalimbira AA, Chilima B, Ander EL. Iodine source apportionment in the Malawian diet. Scientific Reports. 2015;5:15251. doi: 10.1038/srep15251. [DOI] [PMC free article] [PubMed] [Google Scholar]
- Watts MJ, Middleton DRS, Marriott AL, Humphrey OS, Hamilton EH, Gardner A, Smith M, McCormack VA, Menya D, Munishi MO, Mmbaga BT, Osano O. Source apportionment of micronutrients in the diets of Kilimanjaro, Tanzania and Counties of Western Kenya. Scientific Reports. 2019;9:14447. doi: 10.1038/s41598-019-51075-2. [DOI] [PMC free article] [PubMed] [Google Scholar]
- Watts MJ, O'reilly, J., Maricelli, A., Coleman, A., Ander, E.L. & Ward, N.I. A snapshot of environmental iodine and selenium in La Pampa and San Juan provinces of Argentina. Journal of Geochemical Exploration. 2010;107:87–93. doi: 10.1016/j.gexplo.2009.11.002. [DOI] [Google Scholar]
- White PJ. Selenium accumulation by plants. Annals of Botany. 2016;117:217–235. doi: 10.1093/aob/mcv180. [DOI] [PMC free article] [PubMed] [Google Scholar]
- Whitehead D. Uptake and distribution of iodine in grass and clover plants grown in solution culture. Journal of the Science of Food and Agriculture. 1973;24:43–50. doi: 10.1002/jsfa.2740240108. [DOI] [PubMed] [Google Scholar]
- Whitehead DC. The distribution and transformations of iodine in the environment. Environment International. 1984;10:321–339. doi: 10.1016/0160-4120(84)90139-9. [DOI] [Google Scholar]
- WHO (World Health Organisation). (2011b). Hardness in Drinking-water; Background document for development of WHO guidelines for drinking-water, WHO/HSE/WSH/ . https://doi.org/10.01/10/Rev/1.
- Winkel LHE, Johnson CA, Lenz M, Grundl T, Leupin OX, Amini M, Charlet L. Environmental selenium research: from microscopic processes to global understanding. Environmental Science & Technology. 2012;46:571–579. doi: 10.1021/es203434d. [DOI] [PubMed] [Google Scholar]
- Woch W, Hawrylak-Nowak B. Selected antioxidant properties of alfalfa, radish, and white mustard sprouts biofortified with selenium. Acta Agrobotanica. 2019;72:1–11. doi: 10.5586/aa.1768. [DOI] [Google Scholar]
- Wu L, Yu J-C, Kang W-M, Ma Z-Q. Iodine nutrition and thyroid diseases. Zhongguo yi xue ke xue yuan xue bao. Acta Academiae Medicinae Sinicae. 2013;35:363–368. doi: 10.3881/j.issn.1000-503X.2013.04.001. [DOI] [PubMed] [Google Scholar]
- Wuilloud R, Berton P. Selenium speciation in the environment. In: Bakirdere S, editor. Speciation Studies in Soil, Sediment and Environmental Samples. CRC Press; 2014. pp. 263–305. [Google Scholar]
- Xing K, Zhou S, Wu X, Zhu Y, Kong J, Shao T, Tao X. Concentrations and characteristics of selenium in soil samples from Dashan Region, a selenium-enriched area in China AU - Xing, Kun. Soil Science and Plant Nutrition. 2015;61:889–897. doi: 10.1080/00380768.2015.1075363. [DOI] [Google Scholar]
- Yadav SK, Singh I, Singh D, Han S-D. Selenium status in soils of northern districts of India. Journal of Environmental Management. 2005;75:129–132. doi: 10.1016/j.jenvman.2004.11.013. [DOI] [PubMed] [Google Scholar]
- Yamada H, Kiriyama T, Onagawa Y, Hisamori I, Miyazaki C, Yonebayashi K. Speciation of iodine in soils. Soil Science and Plant Nutrition. 1999;45:563–568. doi: 10.1080/00380768.1999.10415819. [DOI] [Google Scholar]
- Yamasaki S-I, Takeda A, Watanabe T, Tagami K, Uchida S, Takata H, Maejima Y, Kihou N, Tsuchiya N. Bromine and iodine in Japanese soils determined with polarizing energy dispersive X-ray fluorescence spectrometry. Soil Science and Plant Nutrition. 2015;61:751–760. doi: 10.1080/00380768.2015.1054773. [DOI] [Google Scholar]
- Yang R, Liu Y, Zhou Z. Selenium and Selenoproteins, from Structure, Function to Food Resource and Nutrition. Food Science and Technology Research. 2017;23:363–373. doi: 10.3136/fstr.23.363. [DOI] [Google Scholar]
- Zaman, M., Shahid, S.A. & Heng, L. (2018). Guideline for salinity assessment, mitigation and adaptation using nuclear and related techniques. Springer Nature.
- Zhang Y, Moore JN. Selenium fractionation and speciation in a wetland system. Environmental Science & Technology. 1996;30:2613–2619. doi: 10.1021/es960046l. [DOI] [Google Scholar]
- Zia MH, Watts MJ, Gardner A, Chenery SR. Iodine status of soils, grain crops, and irrigation waters in Pakistan. Environmental Earth Sciences. 2014;73:7995–8008. doi: 10.1007/s12665-014-3952-8. [DOI] [Google Scholar]
- Zia MH, Watts MJ, Niaz A, Middleton DRS, Kim AW. Health risk assessment of potentially harmful elements and dietary minerals from vegetables irrigated with untreated wastewater, Pakistan. Environmental Geochemistry and Health. 2017;39:707–728. doi: 10.1007/s10653-016-9841-1. [DOI] [PubMed] [Google Scholar]
Associated Data
This section collects any data citations, data availability statements, or supplementary materials included in this article.
Supplementary Materials
Data Availability Statement
The authors confirm that the summary of data supporting the findings of this study is available within the article. Detailed data are available from the corresponding author upon request.