Abstract
Postpartum depression (PPD) is the most common psychological condition following childbirth, and may have a detrimental effect on the social and cognitive health of spouses, infants, and children. The aim of this study was to complete a comprehensive overview of the current literature on the global epidemiology of PPD. A total of 565 studies from 80 different countries or regions were included in the final analysis. Postpartum depression was found in 17.22% (95% CI 16.00–18.51) of the world’s population. Meta-regression analysis showed that study size, country or region development, and country or region income were the causes of heterogeneity. Multivariable meta-regression analysis found that study size and country or area development were the most important predictors. Varied prevalence rates were noted in geographic regions with the highest rate found in Southern Africa (39.96%). Of interested was a significantly lower rate of PPD in developed countries or high-income countries or areas. Furthermore, the findings showed that there was a substantial difference in rates of PPD when marital status, educational level, social support, spouse care, violence, gestational age, breast feeding, child mortality, pregnancy plan, financial difficulties, partnership, life stress, smoking, alcohol intake, and living conditions were considered in the pooled estimates. Our results indicated that one out of every five women experiences PPD which is linked to income and geographic development. It is triggered by a variety of causes that necessitate the attention and committed intervention of primary care providers, clinicians, health authorities, and the general population.
Subject terms: Depression, Human behaviour
Introduction
Postpartum depression (PPD), the onset of depressive episodes after childbirth, develops at a critical moment in a woman’s life and can continue for long periods [1, 2]. The likelihood of depressive episodes can be twice as high as during other periods of a woman’s life [3], and they often go undetected and untreated [4], wreaking havoc on partners as well as the emotional and cognitive growth of infants and adolescents [5, 6]. Desperation, sadness, nausea, changes in sleep and eating habits, decreased libido, crying spells, anxiety, irritability, feelings of isolation, mental liability, thoughts of hurting oneself and/or the infant, and even thoughts of suicide are common signs of this form of depression [7]. Postpartum depression can start at any time within the first year after delivery and continue for several years.
In Western countries, the prevalence of PPD varies from 10 to 15% during the first year after birth [8]. According to a systematic review of 47 studies from 18 low and lower-middle income countries, the prevalence is 18.6% (95% CI 18.0–19.2). Moreover, another review involving 143 studies from 40 countries found a broader variety of PPD prevalence rates, ranging from 0.5% to around 60% [9]. Cultural variations, diverse reporting practices, different viewpoints on mental health issues and stigma, socioeconomic class, poverty, poor social services, deficient nutrition, elevated stress, and biological factors can all be related to this broader continuum.
Despite the increasing number of longitudinal studies on postpartum depression around the world, there is a paucity of rigorous systemic data that explores not only the general burden of PPD, but also risk factors associated with it. The current understanding of the epidemiology of PPD is based mostly on a few geographic surveys and very little national evidence. Therefore, the present study aims to close this void by presenting an updated global estimate of postpartum depression epidemiology, synthesizing critical risk factors, and providing evidence-based data for maternal mental health treatment prioritization.
Methods
Search strategy and selection criteria
A systematic review and meta-analysis were done in accordance with PRISMA guidelines. Articles from inception to July 2021 were reviewed using the following databases: Medline, Embase, Web of Science, Cochrane, PsycInfo and Google Scholar. Searches were tailored database functionality, but generally used the following terms: “postnatal depression”, “postpartum depression”, “depression” and “depressive symptoms”. For relevant citations, reference lists of retrieved papers, as well as review articles found during the initial search, were screened. In order to uncover additional reports, forward citation checks were performed. Full details of the search strategy are provided in the Supplementary method.
Pre-defined decision rules were used to screen studies. Two reviewers independently screened titles and abstracts, with 10% of studies randomly reviewed by another investigator. Two investigators reviewed the complete texts of theoretically qualifying papers, with any inconsistencies settled through agreement or by another reviewer; consensus was found in all cases and agreement was reached.
Datasets from studies that met the following criteria were deemed eligible: (1) studies identified postpartum depressive disorder or depressive episode; (2) participants were women who completed assessments at least one week after giving birth in order to avoid baby blues being confused with PPD; (3) prevalence or incidence of depression was determined using standardized validated instruments, self-reported questionnaires, or clinically structured interviews; (4) participants were not recruited if they were receiving psychiatric assessment or care, or if they were identified as having possible depression because screening seeks to identify women with otherwise unrecognized major depression; (5) sufficient information was available for authors to calculate the aggregated prevalence of depression in the selected group of participants; and, (6) study undertaken from January, 2000 to July 2021.
Data analysis
Data extracted included the first author of the study, country or region, geographic region, time of publication, study period, income of country or region as assess by the World Bank, the level of country development, study category, study source, diagnostic technique, sample size, study quality and prevalence of disease (Supplementary Table 1). In addition, a comparison was made of the prevalence of postpartum depression stratified by marital status (married/cohabiting or single/divorced/widowed), employment (unemployed or paid employment), sex of infant (male or female), parity (primiparous or multiparous), educational level (less than 12 years or more than 12 years), social support from friends/family/parents (YES/NO), support from partner (YES/NO), violence (YES/NO), maternal age (adolescent or adult), residence (urban or rural/suburb), religion (YES/NO), mode of delivery (spontaneous or instrumental/cesarean delivery), ethnicity (indigenous or nonindigenous/immigrant), location of delivery (home or health facility), gestational age (term or pre-/post-term), breast feeding (YES/NO), infant death (YES/NO), sleep (satisfactory or unsatisfactory), pregnancy planned (YES/NO), gender preference (YES/NO), financial problems (YES/NO), partnership (intimate/satisfactory or unsatisfied), life stress (YES/NO), smoker (YES/NO), alcohol use (YES/NO), family type (nuclear or extended), living condition (satisfactory/good or unsatisfactory) and number of children (1 or less/2 or more, Supplementary Table 2).
Socio-demographic characteristics of participants were identified and compared with the prevalence of postpartum depression to determine the pool estimates of risk factors for PPD. Data were cross-checked for accuracy against the original source. Researchers reviewed and extracted data from included studies by using a data extraction form specifically designed for the current study. When duplicate data were identified, the duplicate with the smallest sample size or shortest duration of follow-up was excluded.
The Joanna Briggs Institute-Checklist for Prevalence Studies was used to assess the methodological consistency of the qualifying studies (Supplementary Table 1). Based on quality score, studies were not omitted in order to improve clarity and to ensure that available data in this field was reported. After checking for consistency, the “Meta” and “Metafor” modules in the R-4.0.0 statistical software package were used for meta-analysis. A 95% confidence interval (95% CI) was estimated using the Wilson score method, and pooled prevalence was calculated with the DerSimonian-Laird random effects model with Logit transformation. Heterogeneity across included studies was assessed using Cochran Q and I2 statistics. Estimates with a p value lower than 0.05 for the Q-statistic and I² of 50% or greater were considered to have moderate heterogeneity. A random-effects approach was used to pool the prevalence of postpartum depression as global evidence was assumed to be heterogeneous. A series of leave-one out diagnostic tests was performed by sensitivity analysis and findings were further checked using a build-in feature in Metafor. Using a Mixed-Effects Model, meta-regression was then conducted after eliminating the outliers. Covariates considered were geographic regions, development of countries or region, income of countries or regions, diagnostic techniques, publication time, study size and study quality score. Consequently, multivariable meta-regression (multi-model inference) was performed using a “dmetar” package to examine which possible predictor combinations provide the best fit, and which predictors are the most important ones overall. To assess the potential confounding effect of heterogeneity, subgroup analyses were performed. The P value was used to compare the difference between the groups. A P value <0.05 was considered as significant difference. The study protocol was registered at PROSPERO (https://www.crd.york.ac.uk/prospero) as CRD42020211478.
Results
Literature search results and study characteristics
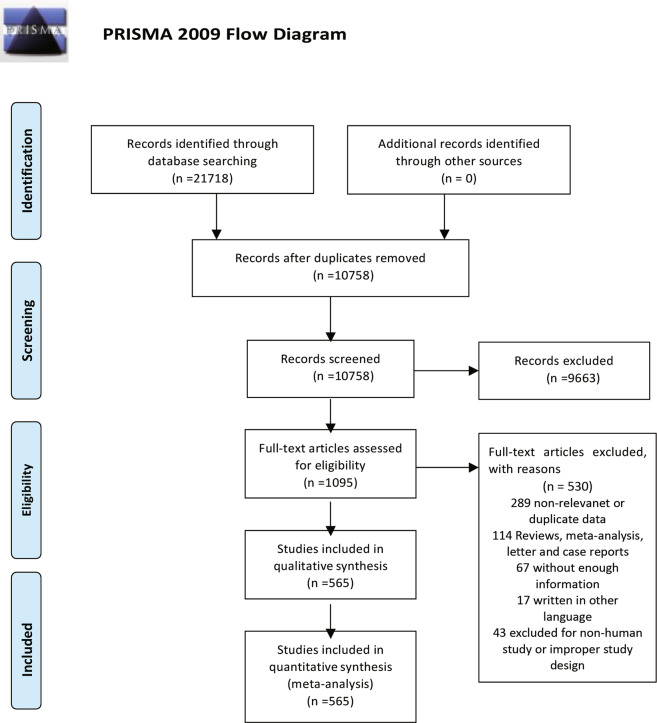
The search identified 21,718 records, of which 10,758 records were retained after removing duplicates. Titles and abstracts were screened, resulting in the exclusion of 9,663 ineligible records. Full texts of the remaining 1,095 records were assessed for eligibility, of which 530 were excluded. Overall, 565 eligible studies involving 1,236,365 women were included in the final analysis (Fig. 1, Supplementary Table 1). The quality assessment scores of included studies are displayed in Supplementary Table 1. The majority of included studies had a cross-sectional design. The mean or median age of participants ranged from 17.76 to 37.70 years.
Fig. 1. Study selection.
(Description of the searching methodology).
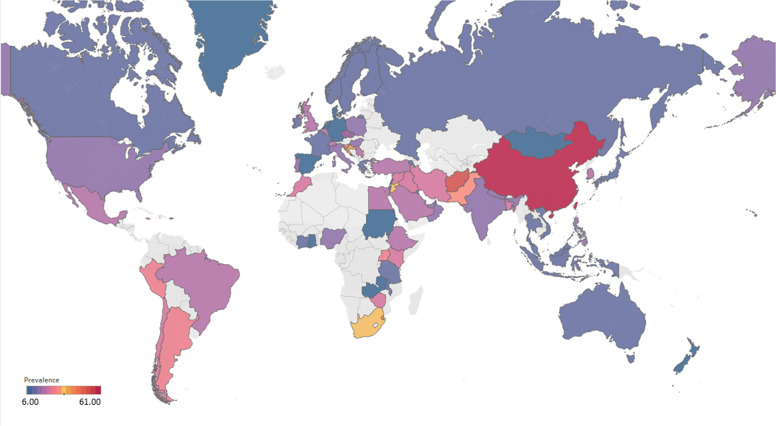
Participants included 172,342 women from 80 countries, having a diagnosis of postpartum depression. There was a high degree of heterogeneity among documented results with an overall prevalence rate of 17.22% (95% CI 16.00–18.51, I2 = 99.70%, Table 1, Fig. 2).
Table 1.
Subgroup analysis for PPD prevalence among women.
| Subgroup | Studies | Prevalence | PPD | Participants | P value | I2 |
|---|---|---|---|---|---|---|
| Country | <0.01 | |||||
| South Africa | 6 | 38.79 (25.71–53.72) | 1076 | 3144 | 98.00% | |
| Malawi | 3 | 13.57 (8.94–20.07) | 116 | 830 | 77.50% | |
| Zambia | 1 | 9.71 (6.74–13.79) | 27 | 278 | ||
| Ghana | 4 | 8.00 (1.90–28.13) | 606 | 4294 | 99.30% | |
| Cote d’Ivoire | 1 | 14.13 (10.90–18.11) | 51 | 361 | ||
| Egypt | 6 | 22.99 (12.99–37.38) | 472 | 2218 | 97.50% | |
| Sudan | 2 | 7.56 (5.47–10.34) | 35 | 467 | 0.00% | |
| Zimbabwe | 2 | 27.22 (16.52–41.41) | 281 | 1137 | 94.80% | |
| Ethiopia | 13 | 22.79 (18.07–28.33) | 2666 | 11534 | 97.50% | |
| Tanzania | 3 | 12.30 (11.22–13.49) | 407 | 3310 | 98.00% | |
| Nigeria | 7 | 17.93 (10.19–29.59) | 1008 | 10659 | 0.00% | |
| Israel | 12 | 12.90 (9.38–17.50) | 1188 | 9158 | 96.60% | |
| Japan | 27 | 13.30 (12.25–14.41) | 25035 | 199089 | 96.20% | |
| India | 14 | 18.81 (13.59–25.44) | 1817 | 10554 | 97.60% | |
| Turkey | 26 | 21.87 (18.12–26.15) | 3038 | 12370 | 96.30% | |
| Malaysia | 6 | 12.64 (6.97–21.86) | 1021 | 10402 | 98.80% | |
| China | 42 | 17.98 (15.32–20.99) | 5946 | 31517 | 97.10% | |
| Taiwan | 17 | 21.65 (17.56–26.38) | 661 | 3141 | 88.00% | |
| Vietnam | 8 | 13.77 (8.54–21.47) | 1009 | 7314 | 98.20% | |
| Pakistan | 3 | 35.45 (18.47–57.10) | 440 | 1326 | 97.60% | |
| United Arab Emirates | 1 | 18.31 (10.94–29.03) | 13 | 71 | — | |
| Nepal | 11 | 16.41 (12.07–21.91) | 538 | 2443 | 92.80% | |
| Thailand | 8 | 12.52 (8.02–19.01) | 514 | 4547 | 96.10% | |
| Singapore | 6 | 14.24 (10.10–19.71) | 402 | 2602 | 98.40% | |
| Bangladesh | 10 | 26.65 (20.00–34.56) | 1329 | 4423 | 98.80% | |
| Qatar | 3 | 18.00 (16.90–19.16) | 795 | 4417 | 91.70% | |
| USA | 66 | 18.56 (16.91–20.34) | 34380 | 242105 | 96.70% | |
| Canada | 25 | 13.89 (11.43–16.79) | 13421 | 118968 | 98.60% | |
| Australia | 23 | 11.22 (9.23–13.56) | 6928 | 82680 | 0.00% | |
| Argentina | 2 | 29.88 (19.30–43.14) | 165 | 625 | 83.00% | |
| France | 8 | 14.63 (10.01–20.89) | 493 | 3203 | 93.80% | |
| Oman | 2 | 16.38 (9.15–27.58) | 160 | 874 | 90.60% | |
| Brazil | 31 | 20.51 (18.53–22.65) | 19960 | 88955 | 98.00% | |
| Poland | 5 | 17.91 (9.19–31.97) | 365 | 2013 | 97.60% | |
| Spain | 5 | 9.09 (6.97–11.78) | 360 | 3704 | 84.10% | |
| UK | 13 | 21.50 (17.63–25.94) | 25786 | 219769 | 98.40% | |
| Sweden | 14 | 12.18 (9.41–15.63) | 2057 | 18189 | 97.20% | |
| Kuwait | 1 | 11.72 (10.11–13.55) | 158 | 1348 | — | |
| Norway | 12 | 11.24 (8.31–15.03) | 1711 | 12557 | 97.00% | |
| Iran | 18 | 24.41 (17.18–33.43) | 5834 | 15753 | 99.20% | |
| Kenya | 3 | 25.20 (11.50–46.63) | 70 | 391 | 90.50% | |
| Jordan | 4 | 39.78 (21.43–61.54) | 539 | 1333 | 98.20% | |
| Uganda | 1 | 32.67 (27.60–38.18) | 98 | 300 | — | |
| Indonesia | 2 | 11.76 (3.73–31.43) | 51 | 440 | 93.90% | |
| Eswatini | 1 | 47.37 (38.39–56.52) | 54 | 114 | — | |
| Syria | 1 | 28.24 (25.66–30.96) | 312 | 1105 | — | |
| Saudi Arabia | 7 | 20.08 (14.17–27.65) | 457 | 2305 | 93.40% | |
| New Zealand | 5 | 10.58 (5.62–19.01) | 681 | 8057 | 98.30% | |
| Multi | 3 | 20.21 (10.16–36.19) | 233 | 1474 | 96.60% | |
| Morocco | 1 | 27.00 (19.22–36.51) | 27 | 100 | — | |
| Portugal | 4 | 18.28 (12.57–25.81) | 115 | 663 | 77.90% | |
| Italy | 14 | 16.79 (11.63–23.64) | 1283 | 10800 | 97.70% | |
| Netherlands | 7 | 10.69 (5.76–18.98) | 1222 | 13069 | 99.10% | |
| Ireland | 3 | 11.14 (10.13–12.25) | 1275 | 11694 | 19.10% | |
| Iraq | 1 | 28.40 (25.69–31.28) | 284 | 1000 | — | |
| Greece | 4 | 12.26 (8.02–18.30) | 155 | 1259 | 83.40% | |
| Hungary | 1 | 16.54 (12.54–21.50) | 44 | 266 | — | |
| Lebanon | 1 | 12.75 (8.28–19.13) | 19 | 149 | — | |
| Korea | 4 | 22.50 (12.01–38.17) | 246 | 1263 | 96.10% | |
| Finland | 3 | 14.62 (9.83–21.20) | 320 | 2513 | 92.20% | |
| Denmark | 2 | 6.48 (5.70–7.36) | 219 | 3381 | 0.00% | |
| Czech Republic | 2 | 15.82 (7.08–31.66) | 59 | 408 | 90.30% | |
| Belgium | 1 | 23.94 (15.44–35.19) | 17 | 71 | — | |
| Philippines | 1 | 16.36 (11.47–22.81) | 27 | 165 | — | |
| Mexico | 1 | 20.00 (15.13–25.96) | 42 | 210 | — | |
| Hong Kong | 4 | 16.96 (13.77–20.70) | 321 | 1860 | 71.90% | |
| Greenland | 1 | 8.62 (5.26–13.81) | 15 | 174 | — | |
| Germany | 3 | 9.76 (5.26–17.40) | 161 | 1760 | 92.90% | |
| Bahrain | 1 | 37.13 (31.21–43.46) | 88 | 237 | — | |
| Serbia | 3 | 23.66 (10.41–45.27) | 134 | 573 | 95.60% | |
| Peru | 1 | 29.97 (28.00–32.02) | 597 | 1992 | — | |
| Armenia | 2 | 14.08 (11.48–17.14) | 82 | 583 | 0.00% | |
| Mongolia | 1 | 9.10 (7.50–11.00) | 95 | 1044 | — | |
| Russia | 2 | 13.54 (1.71–58.45) | 205 | 820 | 97.80% | |
| Switzerland | 1 | 21.93 (17.39–27.27) | 59 | 269 | — | |
| Croatia | 1 | 45.03 (37.74–52.54) | 77 | 171 | — | |
| Slovenia | 1 | 31.82 (19.84–46.81) | 14 | 44 | — | |
| Afghanistan | 1 | 60.93 (54.25–67.22) | 131 | 215 | — | |
| Chile | 3 | 28.27 (14.87–47.08) | 177 | 629 | 95.10% | |
| Timor-Leste | 1 | 25.29 (19.33–32.36) | 43 | 170 | — | |
| Jamaica | 1 | 34.25 (24.31–45.79) | 25 | 73 | — | |
| Continent | <0.01 | |||||
| Southern Africa | 7 | 39.96 (27.81–53.48) | 1130 | 3258 | 97.70% | |
| Eastern Africa | 26 | 20.21 (16.86–24.04) | 3665 | 17780 | 97.00% | |
| Western Africa | 12 | 13.62 (8.27–21.62) | 1665 | 25314 | 99.00% | |
| Northern Africa | 9 | 18.75 (11.40–29.26) | 534 | 2785 | 96.90% | |
| Western Asia | 62 | 19.83 (17.33–22.58) | 7133 | 34950 | 97.20% | |
| Eastern Asia | 96 | 17.39 (16.09–18.77) | 32429 | 238273 | 97.70% | |
| Southern Asia | 56 | 22.32 (18.48–26.70) | 9964 | 35227 | 98.80% | |
| South-eastern Asia | 33 | 13.53 (11.00–16.52) | 3208 | 26677 | 97.30% | |
| Northern America | 92 | 17.01 (15.68–18.44) | 47816 | 361247 | 98.70% | |
| Oceania | 28 | 11.11 (9.27–13.25) | 7609 | 90737 | 98.30% | |
| South America | 37 | 21.71 (19.78–23.76) | 20899 | 92201 | 97.80% | |
| Western Europe | 20 | 12.91 (9.44–17.40) | 1952 | 18372 | 97.90% | |
| Eastern Europe | 10 | 16.62 (10.95–24.43) | 673 | 3507 | 96.50% | |
| Northern Europe | 47 | 13.78 (12.47–15.21) | 31368 | 268103 | 97.20% | |
| Southern Europe | 31 | 16.34 (12.90–20.48) | 1997 | 16177 | 96.60% | |
| Central America | 1 | 20.00 (15.13–25.96) | 42 | 210 | 96.70% | |
| Caribbean | 1 | 34.25 (24.31–45.79) | 25 | 73 | — | |
| Multiple | 3 | 20.21 (10.16–36.19) | 233 | 1474 | — | |
| Development | <0.01 | |||||
| Developing | 295 | 19.99 (18.76–21.27) | 54145 | 266334 | 98.30% | |
| Developed | 276 | 14.85 (14.22–15.51 | 118197 | 970031 | 98.20% | |
| Country or regional income | <0.01 | |||||
| High | 314 | 15.54 (14.90–16.20) | 121333 | 985634 | 98.20% | |
| Upper-middle | 178 | 19.68 (18.26–21.19) | 41217 | 186768 | 98.40% | |
| Lower-middle | 56 | 20.14 (16.39–24.50) | 5769 | 39108 | 98.50% | |
| Low | 23 | 20.02 (15.32–25.73) | 4023 | 24855 | 98.70% | |
| Publication date | 0.58 | |||||
| Before 2010 | 145 | 17.94 (15.79–20.30) | 19417 | 120264 | 98.80% | |
| After 2010 | 426 | 17.28 (16.54-18.05) | 152925 | 1116101 | 98.80% | |
| Study size | <0.01 | |||||
| <1000 | 421 | 19.44 (18.40–20.51) | 27433 | 137934 | 95.70% | |
| >1000 | 150 | 12.97 (12.03–13.96) | 144909 | 1098431 | 99.50% | |
| Diagnostic technique | <0.01 | |||||
| DSM-IV | 7 | 12.94 (9.14–18.00) | 378 | 3086 | 91.50% | |
| SRQ | 12 | 25.90 (21.16–31.27) | 3681 | 12948 | 97.70% | |
| PHQ-9 | 19 | 18.59 (12.21–27.44) | 2475 | 23846 | 99.10% | |
| EPDS | 464 | 16.86 (16.04–17.72) | 110611 | 775287 | 98.70% | |
| CES-D | 13 | 25.06 (19.55–31.50) | 2763 | 19702 | 97.80% | |
| BDI | 10 | 29.70 (23.07–37.31) | 553 | 1767 | 89.30% | |
| DASS | 4 | 18.47 (16.43–20.70) | 1234 | 6863 | 72.40% | |
| SCID | 5 | 10.11 (3.75–24.48) | 1712 | 6360 | 98.90% | |
| PDSS | 5 | 37.23 (21.47–56.27) | 471 | 1522 | 97.50% | |
| SDS | 4 | 28.17 (21.30–36.24) | 1231 | 4248 | 95.90% | |
| PHQ-2 | 5 | 18.47 (14.42–23.34) | 14461 | 105902 | 99.30% | |
| Others | 23 | 14.94 (13.06–17.03) | 96.10% | |||
| Study quality | 0.41 | |||||
| >8 | 542 | 17.52 (16.80–18.27) | 163375 | 1184434 | 98.80% | |
| <8 | 29 | 16.03 (12.98–19.63) | 8967 | 51931 | 98.90% | |
| Study period | 0.56 | |||||
| 4 weeks–3 months | 342 | 15.35 (14.10–16.70) | 55359 | 918858 | 98.20% | |
| 3 months–6 months | 89 | 15.92 (14.03–18.02) | 26031 | 277293 | 99.10% | |
| 6 months–12 months | 67 | 17.89 (13.32–23.59) | 55092 | 1560464 | 99.90% | |
| Longer than 12 months | 15 | 17.95 (13.80–23.01) | 1781 | 11374 | 96.60% | |
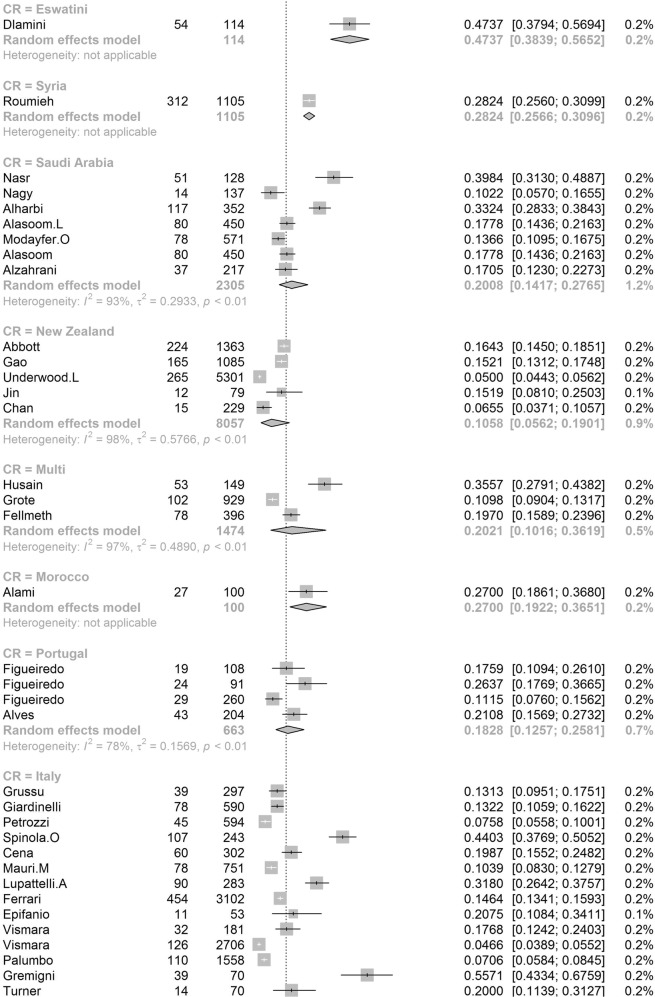
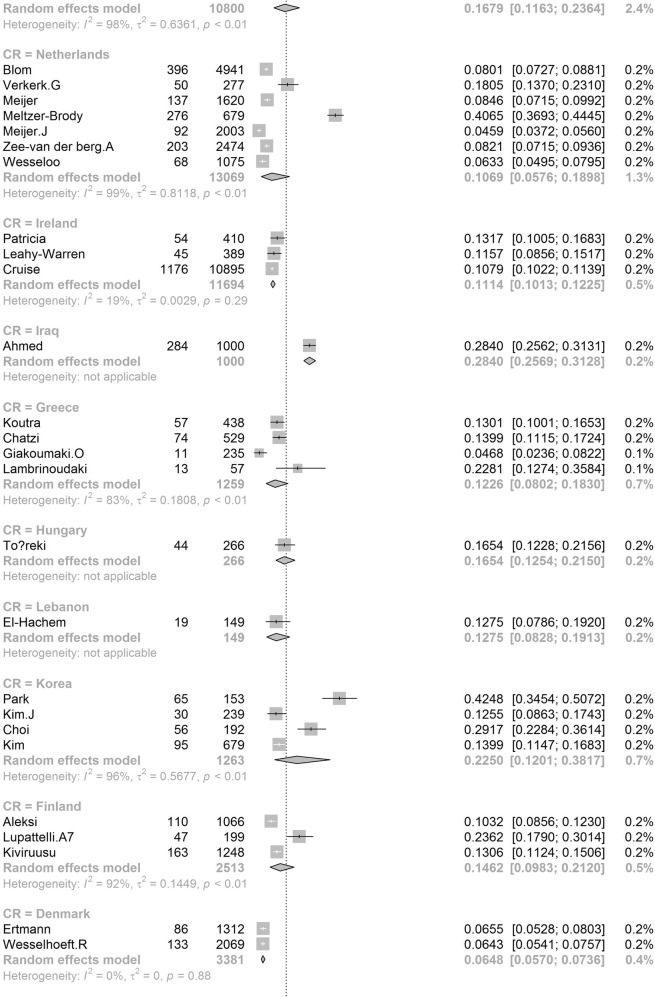
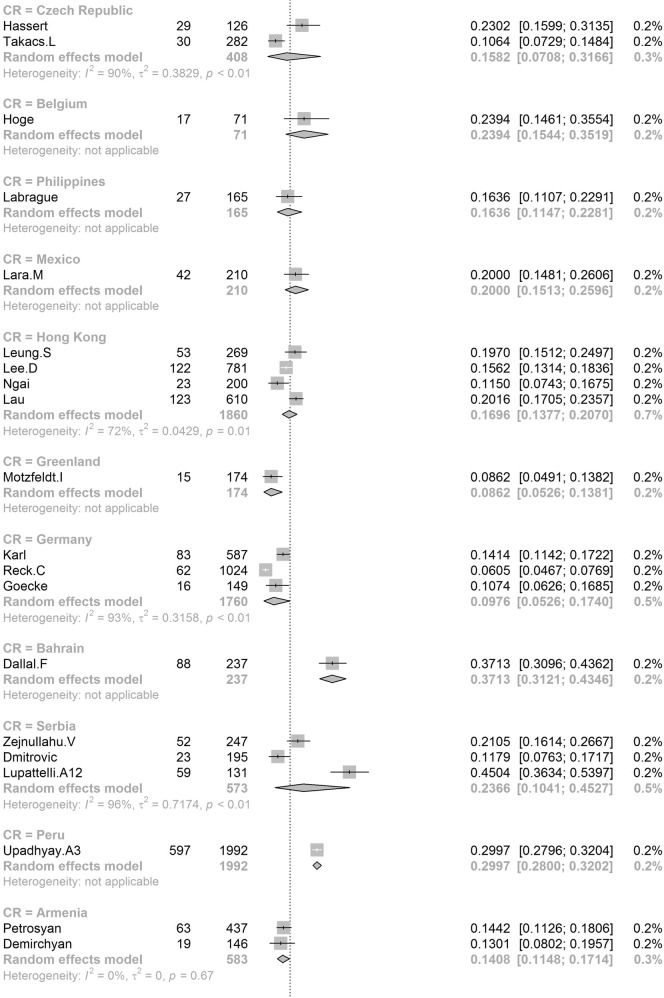
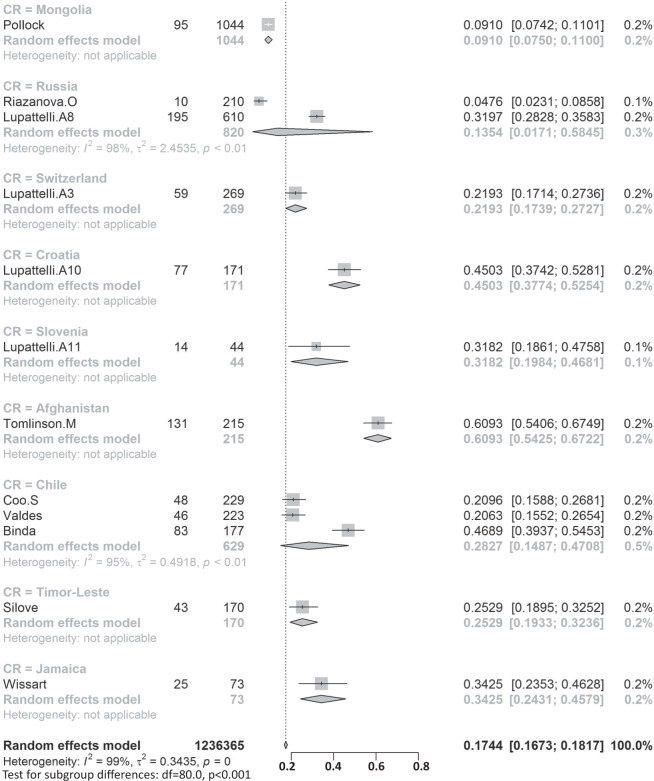
Fig. 2. Global prevalence of postpartum depression.
(Unbalanced prevalence of postpartum depression was observed between different continents, countries and regions).
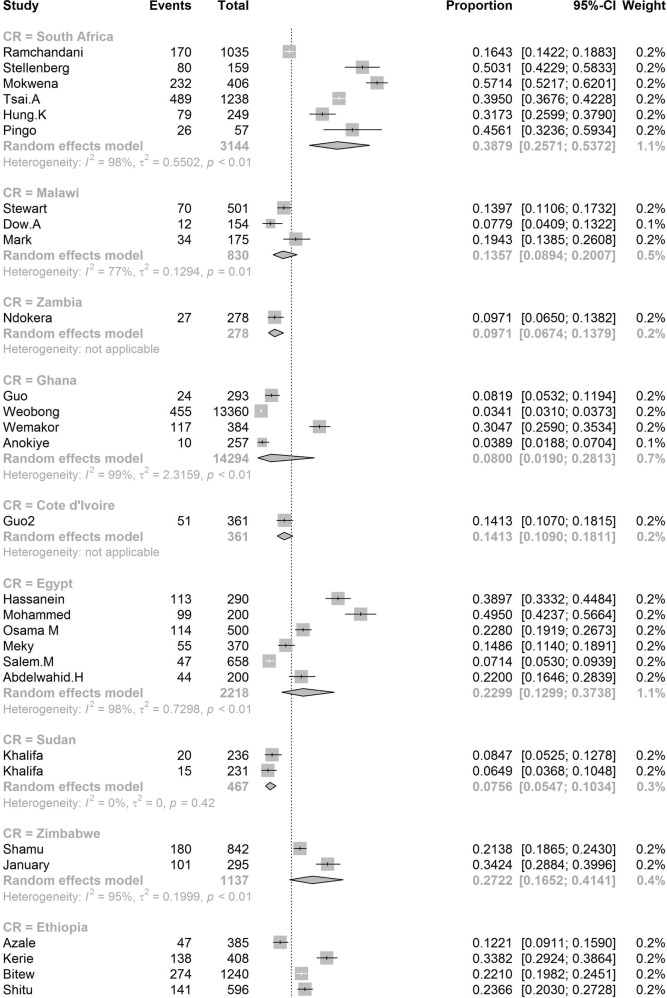
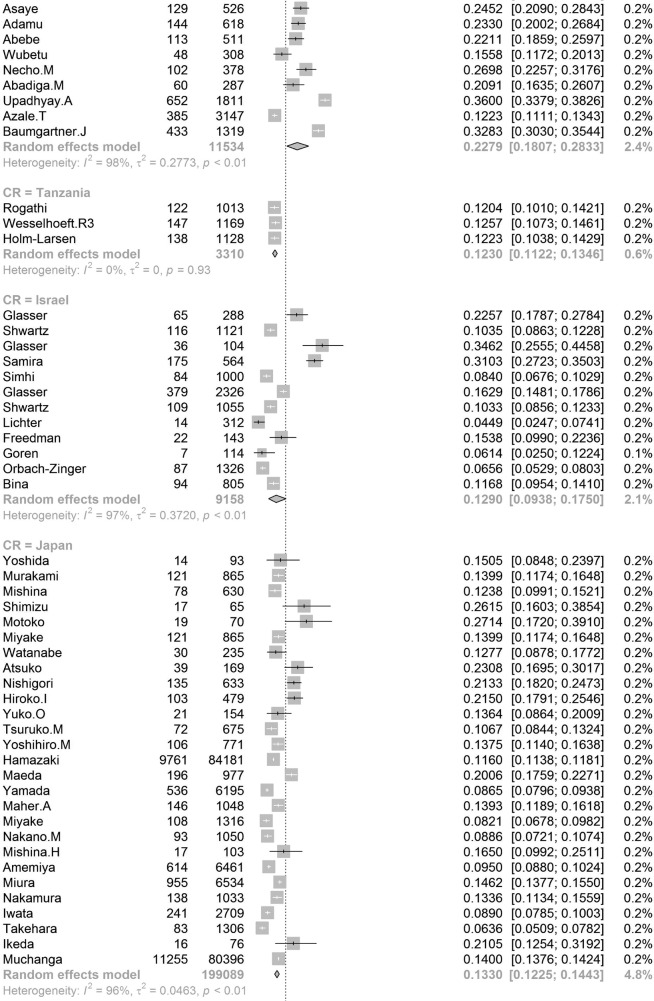
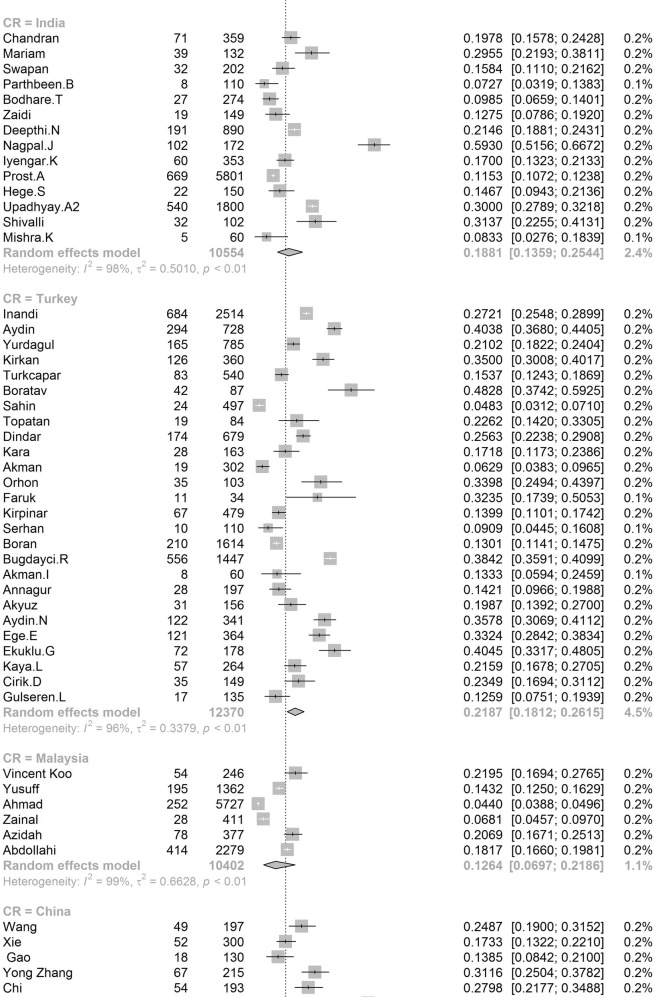
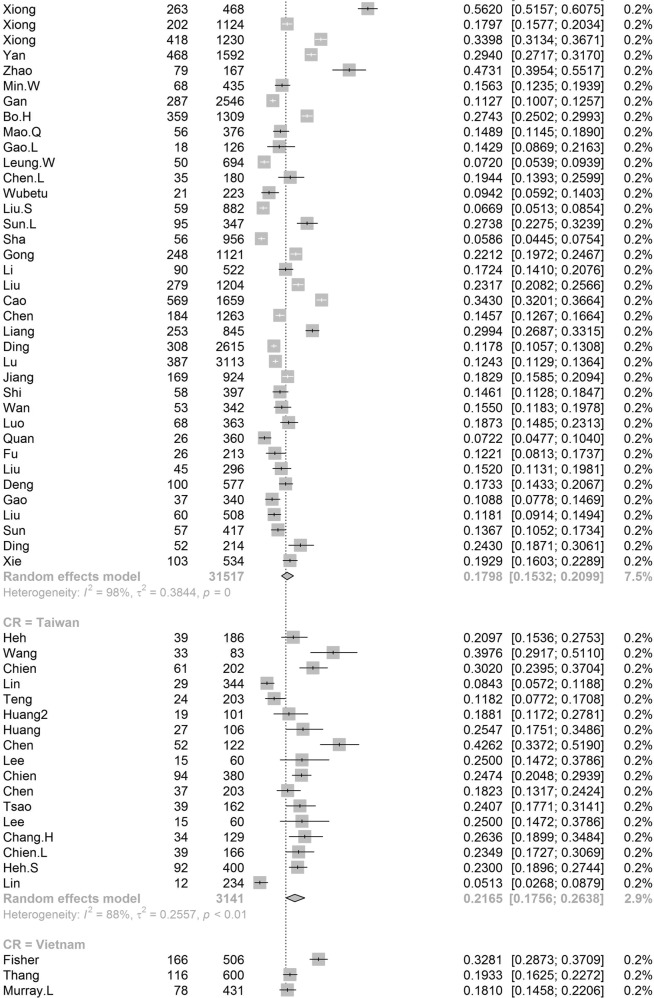
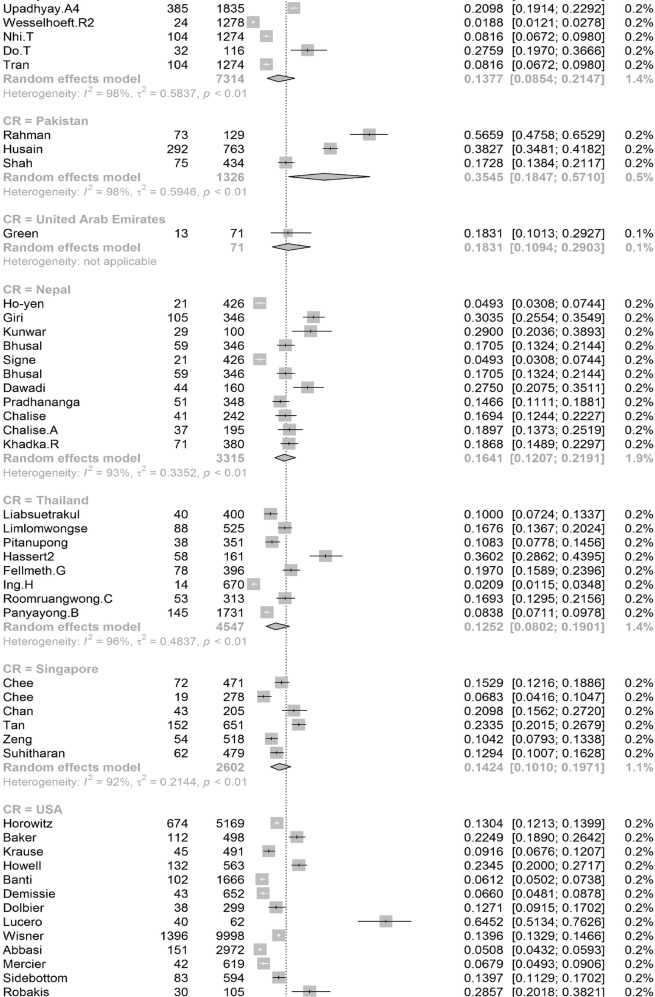
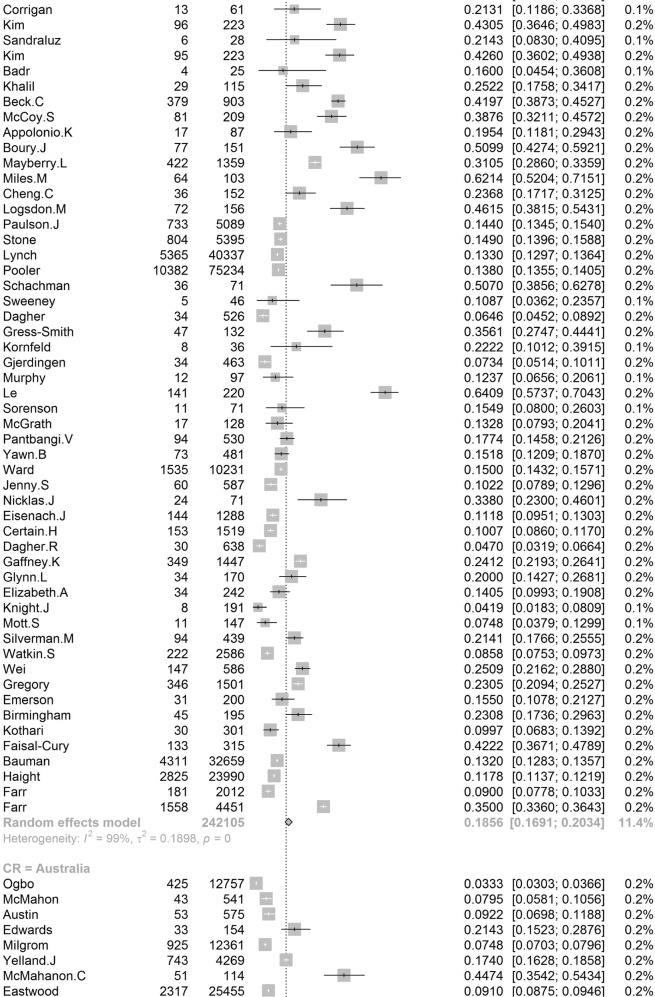
In order to further understand the heterogeneity, sensitivity analysis was conducted by performing a set of leave-one out diagnostic tests (Supplementary Table 3) and the results were further verified by using a build-in function in Metafor (Supplementary Table 4 and Supplementary Fig. 1). As a result, four studies were identified as outliers for estimating pooled prevalence. After removing the outliers, the pooled prevalence of postpartum depression increased to 17.44% (95% CI 16.73–18.17, Fig. 3) stratified by countries or regions. To further explore the source of heterogeneity, meta-regression analysis was performed. The univariate meta-regression model indicated that geographical regions (R2 = 0, p = 0.31), diagnostic scales (R2 = 0, p = 0.37), publication year (R2 = 0, p = 0.65), and quality score of the study (R2 = 0, p = 0.55) were not significantly associated with heterogeneity. The source of heterogeneity across the studies, identified by meta-regression analyses, was study size (R2 = 0.03, p < 0.01), development of countries or regions (R2 = 0.02, p < 0.01) and income of countries or regions (R2 = 0, p < 0.01, Supplementary Table 4). By performing multivariable meta-regression, it was found that the study size and country or region development with the highest predictor importance of 99.99% (Fig. 4, Supplementary Table 5).
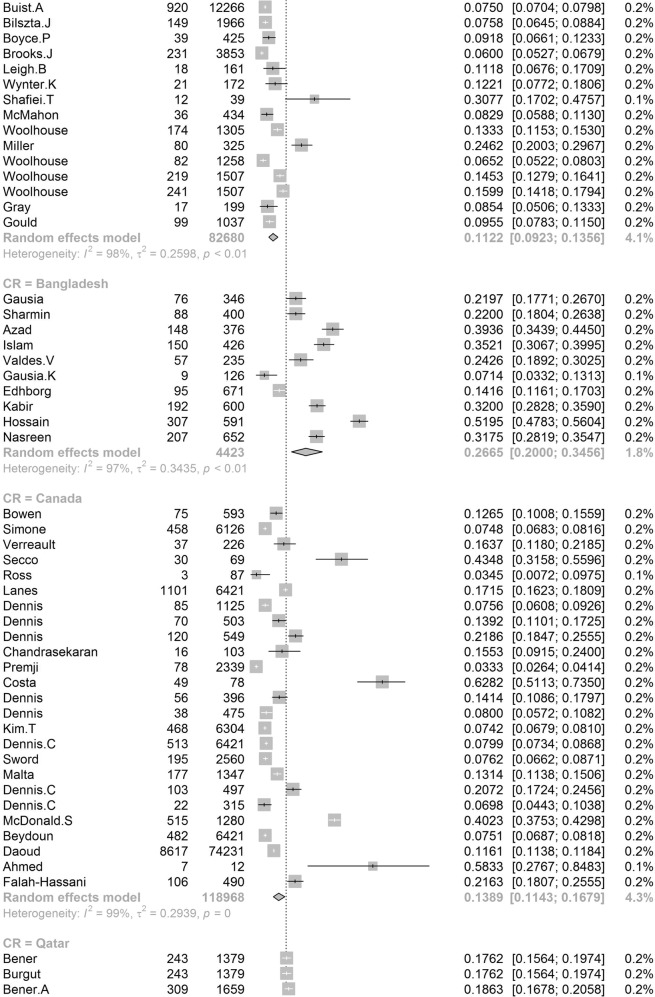
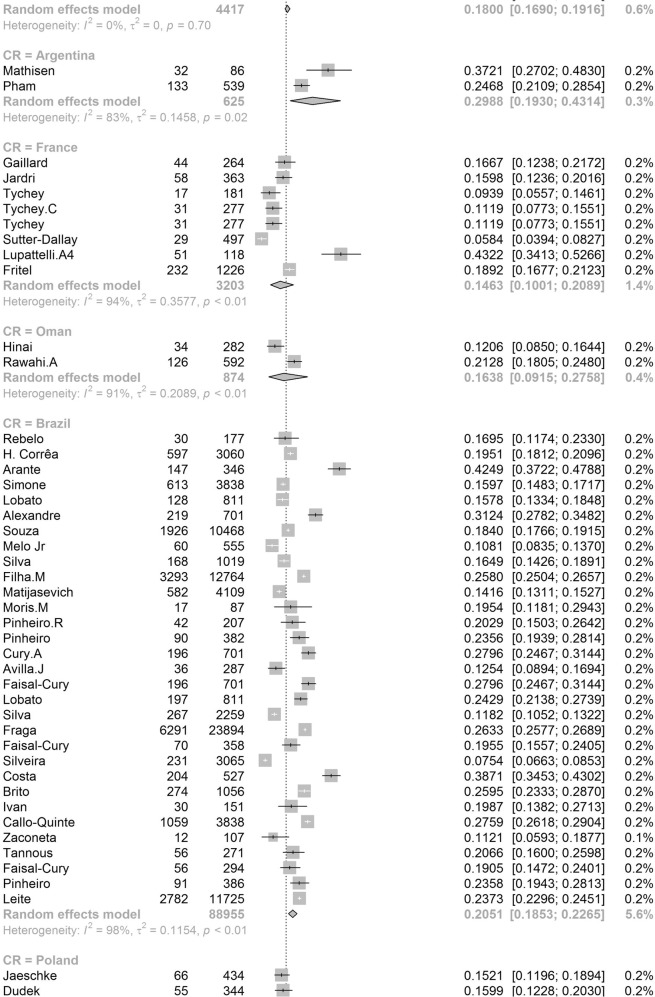
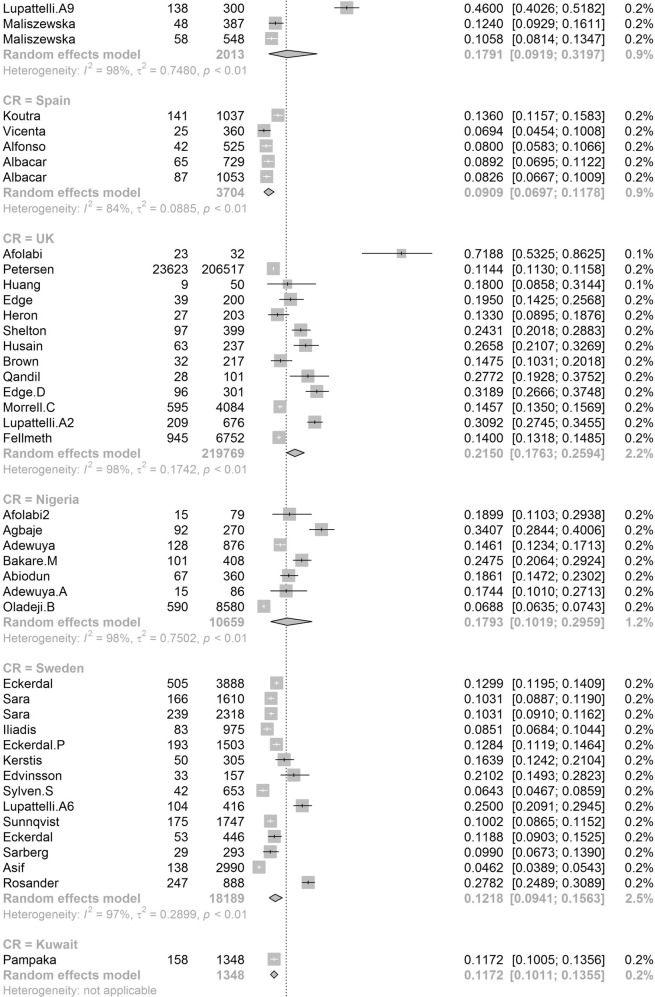
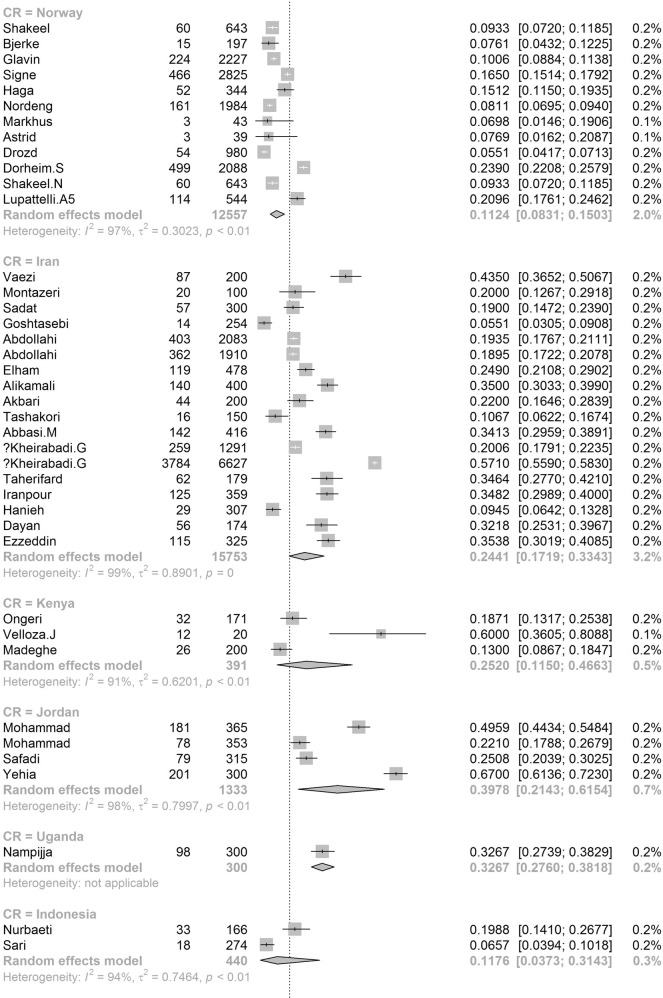
Fig. 3. Forest plot of prevalence of postpartum depression stratified by countries or regions.
(Postpartum depression prevalence varied substantially between different countries and regions, with the lowest prevalence observed in Denmark and highest one in Afghanistan).
Fig. 4. Multi-variable meta-regression for postpartum depression prevalence.
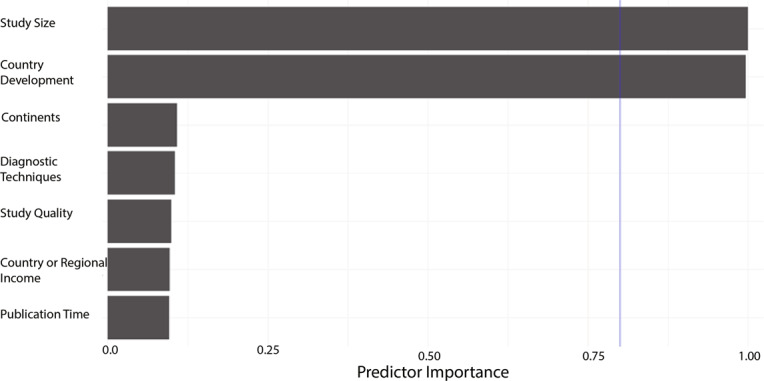
(Multi-variable meta-regression was performed in order to find out factors with the highest predictor importance).
To confirm results of the meta-regression, subgroup analysis was performed after removing the outliers. Among geographic regions that had at least five studies, Southern Africa had the highest prevalence rate (39.96%, 95% CI 27.81–53.48), followed by Southern Asia (22.32%, 95% CI 18.48–26.70), South America (21.71%, 95% CI 19.78–23.76), Western Asia (19.83%, 95% CI 17.33–22.58), Northern Africa (18.75%, 95% CI 11.40–29.26), Eastern Asia (17.39%, 95% CI 16.09–18.77), Northern America (17.01%, 95% 15.68–18.44), Eastern Europe (16.62%, 95% CI 10.95–24.43), Southern Europe (16.34%, 95% CI 12.90-20.48), Northern Europe (13.78%, 95% CI 12.47–15.21), Western Africa (13.62%, 95% CI 8.27–21.62), South-Eastern Asia (13.53%, 95% CI 11.00–16.52), and Oceania (11.11%, 95% CI 9.27–13.25, p < 0.01, Table 1). Postpartum depression prevalence varied substantially among countries and regions, from 6.48% (Denmark, 95% CI 5.70-7.36) to 60.93% (Afghanistan, 95% CI 54.25-67.22, Fig. 2). Among countries or regions containing at least five relevant studies, South Africa had the highest (38.79%, 95% CI 25.71–53.72) and Spain had the lowest (9.09%, 95% CI 6.97–11.08) postpartum depression prevalence among women (Table 1). Considering the income of countries or regions, those with high incomes had a significantly lower prevalence of 15.54% (95% CI 14.90–16.20, p < 0.01). Besides, developed countries (14.85%, 95% CI 14.22–15.51) shared a significantly lower postpartum depression prevalence than that of developing countries (19.99%, 95% CI 18.76–21.27, p < 0.01, Table 1). With regard to diagnostic scales, use of the Postpartum Depression Screening Scale (PDSS) resulted in the highest postpartum depression prevalence rate (37.23%, 95% CI 21.47–56.27) and the Structured Clinical Interview for DSM Disorders (SCID) with the lowest prevalence rate (10.11%, 95% CI 3.75–24.48). More than 80% of the studies used the Edinburgh Postnatal Depression Scale (EPDS) as their diagnostic tool with a prevalence rate of 16.86% (95% CI 16.04–17.72, Table 1). Interestingly, a pattern of increased prevalence rates was found in studies having more than 1,000 participants (12.97%, 95% CI 18.40–20.51) than those with less than 1,000 participants (19.44%, 95% CI 18.40–20.51, p < 0.01, Table 1). To be noted, postpartum depression appears to be universally prevalent in 1–3 months (17.70%, 95% CI 15.95-19.60), 3–6 months (15.31%, 95% CI 14.31–16.36), 6–12 months (18.19%, 95% CI 13.56–23.96) and greater than 12 months (17.95%, 95% CI 13.80–23.01, p = 0.08, Table 1) after birth.
Moreover, results indicated that a significant difference in PPD prevalence was found in the pooled estimate among marital status (married/cohabiting or single/divorced/widowed, 16.37% vs. 28.14%, p < 0.01), educational level (less than 12 years or more than 12 years, 19.84% vs. 15.66%, p < 0.01), social support from friends/family/parents (YES/NO, 15.15% vs. 32.03%, p < 0.01), support from partner (YES/NO, 15.40% vs. 35.99%, p < 0.01), violence (YES/NO, 40.40% vs. 15.65%, p < 0.01), gestational age (term or pre-/post-term, 15.48% vs. 22.04%, p = 0.01), breast feeding (YES/NO, 16.51% vs. 25.02%, p < 0.01), infant death (YES/NO, 43.33% vs. 18.50%, p < 0.01), planned pregnancy (YES/NO, 17.36% vs. 28.12%, p < 0.01), financial problems (YES/NO, 31.82% vs. 15.92%, p < 0.01), partnership (intimate/satisfied or unsatisfied, 17.11% vs. 39.96%, p < 0.01), life stress (YES/NO, 28.81% vs. 14.53%, p < 0.01), smoker (YES/NO, 25.17% vs. 15.74%, p < 0.01), alcohol use (YES/NO, 20.97% vs. 14.49%, p = 0.02) and living conditions (satisfied/well or unsatisfied, 20.35% vs. 38.82%, p = 0.02). However, minimal differences were observed among number of children (1 or less/2 or more, 17.74% vs. 19.38%, p = 0.68), employment (unemployed or paid employment, 21.08% vs. 18.29%, p = 0.11), sex of infant (male or female, 17.97% vs. 20.77%, p = 0.13), parity (primiparous or multiparous, 17.39% vs. 17.63%, p = 0.92), maternal age (adolescent or adult, 23.34% vs. 20.35, p = 0.52), residence (urban or rural/suburb, 12.10% vs. 14.46%, p = 0.73), religion (YES/NO, 15.11% vs. 17.47%, p = 0.77), mode of delivery (spontaneous or instrumental/cesarean delivery, 18.31% vs. 21.01%, p = 0.40), ethnicity (indigenous or nonindigenous/immigrant, 14.76% vs. 17.06%, p = 0.27), location of delivery (home or health facility, 14.88% vs. 11.08%, p = 0.49), sleep (satisfactory or unsatisfactory, 17.20% vs. 30.78%, p = 0.08), family type (nuclear or extended, 20.66% vs. 21.15%, p = 0.82) and gender preference (YES/NO, 17.78% vs. 13.82%, p = 0.40, Table 2).
Table 2.
Pooled estimates of risk factors for PPD.
| Studies | PPD | Participants | Prevalence (95% CI) | P value | I2 | |
|---|---|---|---|---|---|---|
| Age (in years) | 0.52 | |||||
| <20 | 54 | 3412 | 24310 | 23.34 (18.58–28.89) | 97.60% | |
| >20 | 54 | 30781 | 1133022 | 20.35 (14.01–28.62) | 99.90% | |
| Alcohol use | 0.02 | |||||
| Yes | 18 | 1387 | 10311 | 20.97 (15.73–27.39) | 92.20% | |
| No | 17 | 11000 | 80111 | 14.49 (12.52–16.72) | 91.60% | |
| Breast feeding | <0.01 | |||||
| Yes | 49 | 7747 | 62410 | 16.51 (13.64–19.84) | 98.30% | |
| No | 50 | 1225 | 5568 | 25.03 (20.99–29.54) | 89.40% | |
| Parity | 0.92 | |||||
| Primiparous | 120 | 21666 | 834265 | 17.39 (13.44–22.19) | 99.70% | |
| Multiparous | 120 | 15834 | 166938 | 17.63 (15.48–20.00) | 98.40% | |
| Education (in years) | <0.01 | |||||
| <12 | 130 | 17826 | 106174 | 19.84 (17.97–21.86) | 97.70% | |
| >12 | 127 | 15676 | 128967 | 15.66 (14.44–16.95) | 95.40% | |
| Employment | 0.11 | |||||
| Paid employment | 117 | 6802 | 48324 | 18.29 (15.80–21.08) | 97.30% | |
| Unemployment | 118 | 7331 | 37230 | 21.08 (19.05–23.25) | 95.10% | |
| Ethnicity | 0.27 | |||||
| Indigenous | 41 | 4114 | 38404 | 14.76 (12.19–17.76) | 97.50% | |
| Nonindigenous or immigrant | 41 | 4783 | 38948 | 17.06 (14.22–20.35) | 96.90% | |
| Family type | 0.82 | |||||
| Nuclear | 34 | 2378 | 11362 | 20.66 (17.95–23.67) | 91.50% | |
| Extend | 34 | 2763 | 12870 | 21.15 (18.30–24.31) | 92.70% | |
| Financial problems | <0.01 | |||||
| Yes | 23 | 1434 | 5480 | 31.82 (25.57–38.79) | 95.20% | |
| No | 23 | 1571 | 12286 | 15.92 (12.49–20.07) | 96.10% | |
| Gender preference | 0.4 | |||||
| Yes | 17 | 987 | 10288 | 17.78 (11.53–26.39) | 97.90% | |
| No | 17 | 1190 | 13107 | 13.82 (9.12–20.40) | 98.10% | |
| Gestational age | <0.01 | |||||
| Term | 42 | 13136 | 104944 | 15.48 (12.85–18.53) | 98.60% | |
| pre- or post-term | 42 | 3169 | 21341 | 22.04 (18.14–26.52) | 93.10% | |
| Infant death | 0.01 | |||||
| Yes | 17 | 479 | 1294 | 43.44 (25.89–62.80) | 94.50% | |
| No | 15 | 1493 | 18042 | 18.50 (11.53–28.35) | 98.90% | |
| Infant illness | <0.01 | |||||
| Yes | 41 | 2597 | 11180 | 29.00 (21.78–37.46) | 97.80% | |
| No | 40 | 5793 | 44536 | 17.95 (14.74–21.67) | 98.10% | |
| Infant weight | 0.14 | |||||
| Normal | 29 | 2490 | 18083 | 17.41 (14.00–21.45) | 96.90% | |
| Abnormal | 29 | 629 | 3582 | 23.55 (16.75–32.05) | 94.30% | |
| Infant sex | 0.13 | |||||
| Male | 78 | 10252 | 72227 | 17.97 (15.62–20.58) | 97.40% | |
| Female | 77 | 9760 | 67494 | 20.77 (18.20–23.60) | 97.20% | |
| Life stress | <0.01 | |||||
| Yes | 35 | 3735 | 23151 | 28.81 (23.49–34.78) | 96.70% | |
| No | 35 | 2538 | 20435 | 14.53 (11.84–17.70) | 96.10% | |
| Delivery Location | 0.49 | |||||
| Home | 11 | 316 | 5984 | 14.88 (6.93–29.10) | 96.90% | |
| Health facility | 11 | 969 | 15285 | 11.08 (7.29–16.50) | 97.40% | |
| Marital status | <0.01 | |||||
| Married or cohabiting | 91 | 22284 | 168779 | 16.37 (14.55–18.37) | 98.50% | |
| Single (unmarried, widowed or divorced) | 91 | 5247 | 26763 | 28.14 (24.96–31.55) | 94.40% | |
| Maternal health problems (perinatal period) | 0.01 | |||||
| Yes | 68 | 7970 | 77815 | 23.97 (19.40–29.23) | 98.30% | |
| No | 68 | 12014 | 143334 | 16.71 (13.81–20.09) | 99.00% | |
| Mode of delivery | 0.4 | |||||
| Spontaneous | 125 | 25499 | 972401 | 18.31 (14.34–23.08) | 99.70% | |
| Instrument or CS | 126 | 19053 | 555861 | 21.01 (16.83–25.90) | 99.60% | |
| Number of children | 0.68 | |||||
| 1 or less | 20 | 645 | 3355 | 17.74 (13.18–23.45) | 92.80% | |
| 2 or more | 20 | 710 | 4035 | 19.38 (14.15–25.95) | 94.50% | |
| Partner support (assistance) | <0.01 | |||||
| Yes | 31 | 10646 | 89016 | 15.40 (12.48–18.86) | 97.80% | |
| No | 31 | 2994 | 6793 | 35.99 (28.43–44.31) | 95.40% | |
| Partnership | <0.01 | |||||
| Intimate or satisfied | 42 | 4035 | 23404 | 17.11 (14.54–20.04) | 96.50% | |
| Unsatisfied | 42 | 1569 | 4921 | 39.96 (33.33–46.98) | 94.00% | |
| Pregnancy plan | <0.01 | |||||
| Planned | 81 | 5840 | 45033 | 17.36 (14.91–20.12) | 97.40% | |
| Unplanned | 81 | 4237 | 22925 | 28.12 (24.18–32.43) | 96.70% | |
| Religion | 0.77 | |||||
| Yes | 9 | 816 | 14470 | 15.11 (6.25–32.23) | 99.20% | |
| No | 9 | 489 | 3448 | 17.47 (10.65–27.33) | 96.00% | |
| Residence | 0.73 | |||||
| Urban | 15 | 2229 | 87091 | 12.10 (4.83–27.18) | 99.70% | |
| Rural | 15 | 1645 | 21927 | 14.46 (8.61–23.26) | 99.00% | |
| Sleep | 0.08 | |||||
| Satisfied | 11 | 948 | 10483 | 17.20 (10.10–27.75) | 98.40% | |
| Unsatisfied | 12 | 1045 | 4643 | 30.78 (19.49–44.95) | 98.20% | |
| Smoking | <0.01 | |||||
| Yes | 36 | 1238 | 6948 | 25.17 (20.84–30.07) | 88.80% | |
| No | 35 | 13314 | 97611 | 15.74 (13.93–17.73) | 95.70% | |
| Social support | <0.01 | |||||
| Yes | 55 | 4467 | 29888 | 15.15 (12.93–17.68) | 96.60% | |
| No | 55 | 2741 | 10078 | 32.03 (27.42-37.02) | 95.00% | |
| Violence | <0.01 | |||||
| Yes | 37 | 2210 | 6987 | 40.40 (34.11–47.02) | 95.00% | |
| No | 37 | 14631 | 111554 | 15.65 (12.88–18.89) | 98.60% | |
CS = Cesarean section.
Discussion
The global prevalence of PPD was found to be approximately 17.22% (95% CI 16.00-18.51) in the largest meta-analysis of PPD to-date. Study findings revealed significant differences between geographic regions, with Southern Africa having the highest prevalence rate (39.96%, 95% CI 27.81–53.48). Furthermore, country development and income inequalities had a major effect on PPD epidemiology. Furthermore, it was discovered that the prevalence of various variables such as marital status, educational level, violence, partnership, life stress, smoking, alcohol use, and living conditions differed significantly. However, no significant difference in PPD was noted in relation to infant gender and gender preference.
There have been recent systematic reviews of PPD worldwide [10–13] or in specific regions, including Asia [14, 15] and Africa [16], but to the researchers’ knowledge this is the most comprehensive review with the largest number of studies on PPD globally. Results showed that the estimates are significantly higher than the widely cited prevalence rate of 13% (95% CI: 12.3–13.4%), derived from a meta-analysis of studies from developed countries [10] and lower than the 19% prevalence rate for PPD derived from studies of relatively low- and middle-income countries [12]. Interestingly, the current study findings are more similar to pooled estimates of PPD when using the EPDS [13]. Furthermore, current findings revealed that the prevalence of PPD was closely linked to country development and national or regional income. This is in line with previous research, which has shown that developing countries with low or lower-middle income have a higher prevalence of PPD. Importantly, the PPD prevalence rate varied based on the scale used when comparisons were made between countries with different socioeconomic structures. Previous studies had observed inconsistent PPD prevalence with 1.9% to 82.1% in developed countries, and 5.2% to 74% in developing countries [17]. Moreover, another study evaluated PPD studies from 40 countries and reported the prevalence of PPD to be 10–15% and found this prevalence to vary between 0% and 60% in developed and developing countries, respectively [9]. One detailed study found that PPD prevalence in developing countries was greater in developing countries (31.1%) than that of developed countries (21.5%) in rural areas [18]. It is worth noting that even among nations in similar economic strata, there are differences in national estimates of the prevalence of postpartum depression. For example, the prevalence of PPD in the United Kingdom is 21.5%, while that in New Zealand, another high-income country, is 10.58%; PPD prevalence in Ghana and Egypt were 3% and 22.99% respectively, while in fact they belong to low-income countries and their per capita GDP is similar.
Almost all geographic regions were represented in this review, with the highest coverage in Eastern Asia (n = 96) and the lowest coverage in Central America and Caribbean areas (n = 1). As a result, the current study’s pooled estimates of Central America and the Caribbean are underrepresented. Furthermore, the current analysis showed substantial variations between graphic areas on the same continent. Southern Asia, for instance, led with the highest prevalence (22.32%, 95% CI 18.48–26.70), followed by Western Asia (19.83%, 95% CI 17.33–22.58), Eastern Asia (17.39%, 95% CI 16.09–18.77), and South-Eastern Asia (13.53%, 95% CI 11.00–16.52). This was mirrored in the vast spectrum of PPD prevalence in Asian countries, which ranged from 9.29 % (Korea) to 60.93% (Afghanistan). These findings matched those of a previous study, which found that Asians made up 3.5% to 63.3% of the population [19]. To be noted, current study results indicated the prevalence in Southern Asia and Western Asia were significantly higher than that of Northern America, Europe, and Oceania. This is largely in accordance with the results from previous studies [20]. Differences in cultural traditions may play a role in this disparity. In those areas, girls tended to marry at an early age. But when it comes to age as a risk factor, the literature is conflicting. Some studies discovered that mothers with younger children are more likely to develop PPD [21, 22], while other studies discovered that older age is related to PPD [23, 24]. No differences were found in a case-control study conducted by Balaha and colleagues [25]. To be noted, in the current study, the pooled estimates suggest a marginally higher PPD prevalence in adolescent mothers than adult mothers without significant difference. In addition, relationships with mothers-in-law were closely correlated with PPD in those women [23]. In these research participants, mothers-in-law tend to be essential to the survival of the marriage, as sons remain closely attached to their families of birth, frequently living with and even working within the family company their entire lives. Mothers-in-law often exercise a considerable amount of leverage over their daughters-in-law and grandchildren’s lives. As a result, having a healthy relationship with one’s mother-in-law is crucial in a woman’s life, and having a negative one can lead to depression. Moreover, other risk factors, such as postpartum rituals including the period of 40 days resting, restricted activities, and diets [26], multiple children [27] and unemployment [21, 28] were also correlated with a high prevalence rate.
Previous studies indicated that the past history of depression significantly enhanced the chance of PPD [29, 30]. That explains why studies on new mothers having perinatal depression were not included in pooled estimates. Fifteen factors were found related to an elevated risk of PPD in the current review. In terms of breastfeeding, it is generally thought to be a possible preventive factor, and it was found that starting breastfeeding reduced the likelihood of depression in this current research. Breastfeeding has also been linked to an elevated risk of PPD in several trials. Underlying variables such as the mother’s background traits may be a source of confusion. Moreover, breastfeeding duration and breastfeeding self-efficacy may also be correlated with PPD [31, 32]. Besides, according to the findings of the study, postpartum women face a variety of stressful life activities, including relationships, financial problems, social support, and maternal stressors. More than three-quarters of depressed postpartum women (78.2%) reported they had strained ties with their mothers-in-law [21]. With a strong correlation with their counterparts, almost half of postpartum mothers with depression reported having more than one stressful life events, such as low income (58.1%) and unplanned pregnancy (60.4%) [21]. Baker et al. found that low socioeconomic status, unwanted pregnancy and stressful life events during pregnancy have been associated with postpartum mental disorders [33]. Current study results are consistent with previous studies that unplanned pregnancy and a lack of family care were found to be important correlates of PPD. Support should be considered a protective factor based on the literature described previously [21, 34, 35]. Our findings are in line with previous research that support from partners, family members, and friends is shown to be adversely associated with the likelihood of PPD in the current study. The current study also found that women in financial difficulties or experiencing stressful events were at increased risk for PPD. This finding was confirmed in systematic reviews and meta-analyses conducted in low- and middle-income countries [36]. Due to lack of financial support, women in financial difficulties may be in a state of poverty, which leads to stress [36]. To be noted, our results indicated that mothers experiencing domestic violence were almost three times more likely than their counterparts to suffer from depression. Other studies found that postpartum depression was linked to mothers having a history of domestic violence and abuse from their husbands or family members [14, 37, 38]. Violence is harmful to one’s mental health. Mothers who are abused experience feelings of helplessness and despair, as well being at high risk to commit suicide. Unexpectedly, in our meta-analysis, an infant’s gender is not related to postpartum depression. Although female infant sex is favorably linked to PPD, according to research conducted in Asia (China, India), Africa (Nigeria), and Turkey, with qualitative research suggesting a role for male gender preference [39–41]. However, recent studies indicated that several biological mechanisms could underlie our observed findings, including sex-differential shifts in maternal reproductive and other hormones or immune activity [42–44].
There are strengths and limitations of this study to consider. It is the largest population-based study to-date, and allows for the investigation of factors which have not been previously studied in various regions. This study was a meta-analysis, so the pooled estimates of risk factors resulted in improved accuracy compared with findings from a single study. Limitations were also identified. First, although this was the most comprehensive PPD prevalence study, there remains a significant lack of research studies from developing countries with lower-middle or low incomes. Second, since the current research focused on cross-sectional research studies, recall bias may be present. Third, the diagnostic techniques used were based on participants’ self-reports which can result in reporting bias. Fourth, genes and polymorphisms are reported to be associated with PPD. However, in current study, we cannot further pool estimate those data due to the limited number of study on specific genes.
Postpartum depression affected one out of every five women after they gave birth which was triggered by a variety of causes. This necessitates the attention and committed intervention of primary care providers, clinicians, health authorities, and society as a whole.
Supplementary information
Acknowledgements
We thank Pengfei Li and Ling Wang from Erasmus University Rotterdam provided English revision for the manuscript and Prof. Han Luo from Sichuan University for providing us technical assistance for the revision. This research is supported by the National Key R&D Program of China grant (2018YFC1314600) to ZL; Grant of Science and Technology from Sichuan Province (2020YJ0237) to ZL and (2020YFS0259) to XF; The 1.3.5 project for disciplines of excellence, West China Hospital, Sichuan University to ZL (ZYJC18025); The National Natural Science Foundation of China to BY (72174152).
Author contributions
JL, ZW, HS, ZC, and SL completed the study, acquisition, and analysis of data. YL, XX, ZL, ZL, WZ, and BY discussed data; conceptualized the research project, revised the manuscript and provided technical assistance. ZW and JL drafted the manuscript. All authors have read the manuscript and provided feedback. ZW, JL, HS, and ZC shared the co-first author.
Competing interests
The authors declare no competing interests.
Footnotes
Publisher’s note Springer Nature remains neutral with regard to jurisdictional claims in published maps and institutional affiliations.
These authors contributed equally: Ziyi Wang, Jiaye Liu, Huan Shuai, Zhongxiang Cai.
Change history
12/20/2021
A Correction to this paper has been published: 10.1038/s41398-021-01692-1
Contributor Information
Zhongchun Liu, Email: zcliu6@whu.edu.cn.
Zhihui Li, Email: rockoliver@vip.sina.com.
Bing Xiang Yang, Email: 00009312@whu.edu.cn.
Supplementary information
The online version contains supplementary material available at 10.1038/s41398-021-01663-6.
References
- 1.Crotty F, Sheehan J. Prevalence and detection of postnatal depression in an Irish community sample. Ir J Psychol Med. 2004;21:117–21. doi: 10.1017/S0790966700008533. [DOI] [PubMed] [Google Scholar]
- 2.Cooper PJ, Murray L, Wilson A, Romaniuk H. Controlled trial of the short- and long-term effect of psychological treatment of post-partum depression. I. Impact on maternal mood. Br J Psychiatry. 2003;182:412–9. [PubMed] [Google Scholar]
- 3.Cox JL, Murray D, Chapman G. A controlled study of the onset, duration and prevalence of postnatal depression. Br J Psychiatry. 1993;163:27–31. doi: 10.1192/bjp.163.1.27. [DOI] [PubMed] [Google Scholar]
- 4.Pearlstein T, Howard M, Salisbury A, Zlotnick C. Postpartum depression. Am J Obstet Gynecol. 2009;200:357–64. doi: 10.1016/j.ajog.2008.11.033. [DOI] [PMC free article] [PubMed] [Google Scholar]
- 5.Lovestone S, Kumar R. Postnatal psychiatric illness: the impact on partners. Br J Psychiatry. 1993;163:210–6. doi: 10.1192/bjp.163.2.210. [DOI] [PubMed] [Google Scholar]
- 6.Murray L, Fiori-Cowley A, Hooper R, Cooper P. The impact of postnatal depression and associated adversity on early mother-infant interactions and later infant outcome. Child Dev. 1996;67:2512–26. [PubMed] [Google Scholar]
- 7.Robertson E, Grace S, Wallington T, Stewart DE. Antenatal risk factors for postpartum depression: a synthesis of recent literature. Gen Hosp Psychiatry. 2004;26:289–95. doi: 10.1016/j.genhosppsych.2004.02.006. [DOI] [PubMed] [Google Scholar]
- 8.Faisal-Cury A, Menezes PR, d'Oliveira AF, Schraiber LB, Lopes CS. Temporal relationship between intimate partner violence and postpartum depression in a sample of low income women. Matern Child Health J. 2013;17:1297–303. doi: 10.1007/s10995-012-1127-3. [DOI] [PubMed] [Google Scholar]
- 9.Halbreich U, Karkun S. Cross-cultural and social diversity of prevalence of postpartum depression and depressive symptoms. J Affect Disord. 2006;91:97–111. doi: 10.1016/j.jad.2005.12.051. [DOI] [PubMed] [Google Scholar]
- 10.O’Hara MW, Swain AM. Rates and risk of postpartum depression—a meta-analysis. Int Rev Psychiatry. 1996;8:37–54. [Google Scholar]
- 11.Shorey S, Chee CYI, Ng ED, Chan YH, Tam WWS, Chong YS. Prevalence and incidence of postpartum depression among healthy mothers: A systematic review and meta-analysis. J Psychiatr Res. 2018;104:235–48. doi: 10.1016/j.jpsychires.2018.08.001. [DOI] [PubMed] [Google Scholar]
- 12.Fisher J, Cabral de Mello M, Patel V, Rahman A, Tran T, Holton S, et al. Prevalence and determinants of common perinatal mental disorders in women in low- and lower-middle-income countries: a systematic review. Bull World Health Organ. 2012;90:139G–149G. doi: 10.2471/BLT.11.091850. [DOI] [PMC free article] [PubMed] [Google Scholar]
- 13.Hahn-Holbrook J, Cornwell-Hinrichs T, Anaya I. Economic and health predictors of national postpartum depression prevalence: a systematic review, meta-analysis, and meta-regression of 291 studies from 56 countries. Front Psychiatry. 2017;8:248. doi: 10.3389/fpsyt.2017.00248. [DOI] [PMC free article] [PubMed] [Google Scholar]
- 14.Upadhyay RP, Chowdhury R, Aslyeh S, Sarkar K, Singh SK, Sinha B, et al. Postpartum depression in India: a systematic review and meta-analysis. Bull World Health Organ. 2017;95:706–717C. doi: 10.2471/BLT.17.192237. [DOI] [PMC free article] [PubMed] [Google Scholar]
- 15.Ozcan NK, Boyacioglu NE, Dinc H. Postpartum depression prevalence and risk factors in Turkey: a systematic review and meta-analysis. Arch Psychiatr Nurs. 2017;31:420–8. doi: 10.1016/j.apnu.2017.04.006. [DOI] [PubMed] [Google Scholar]
- 16.Zeleke TA, Getinet W, Tadesse Tessema Z, Gebeyehu K. Prevalence and associated factors of post-partum depression in Ethiopia. A systematic review and meta-analysis. PLoS One. 2021;16:e0247005. doi: 10.1371/journal.pone.0247005. [DOI] [PMC free article] [PubMed] [Google Scholar]
- 17.Norhayati MN, Hazlina NH, Asrenee AR, Emilin WM. Magnitude and risk factors for postpartum symptoms: a literature review. J Affect Disord. 2015;175:34–52. doi: 10.1016/j.jad.2014.12.041. [DOI] [PubMed] [Google Scholar]
- 18.Villegas L, McKay K, Dennis CL, Ross LE. Postpartum depression among rural women from developed and developing countries: a systematic review. J Rural Health. 2011;27:278–88. doi: 10.1111/j.1748-0361.2010.00339.x. [DOI] [PubMed] [Google Scholar]
- 19.Klainin P, Arthur DG. Postpartum depression in Asian cultures: a literature review. Int J Nurs Stud. 2009;46:1355–73. doi: 10.1016/j.ijnurstu.2009.02.012. [DOI] [PubMed] [Google Scholar]
- 20.Affonso DD, De AK, Horowitz JA, Mayberry LJ. An international study exploring levels of postpartum depressive symptomatology. J Psychosom Res. 2000;49:207–16. doi: 10.1016/s0022-3999(00)00176-8. [DOI] [PubMed] [Google Scholar]
- 21.Bener A, Gerber LM, Sheikh J. Prevalence of psychiatric disorders and associated risk factors in women during their postpartum period: a major public health problem and global comparison. Int J Women’s Health. 2012;4:191–200. doi: 10.2147/IJWH.S29380. [DOI] [PMC free article] [PubMed] [Google Scholar]
- 22.Kheirabadi GR, Maracy MR, Barekatain M, Salehi M, Sadri GH, Kelishadi M, et al. Risk factors of postpartum depression in rural areas of Isfahan Province, Iran. Arch Iran Med. 2009;12:461–7. [PubMed] [Google Scholar]
- 23.Green K, Broome H, Mirabella J. Postnatal depression among mothers in the United Arab Emirates: socio-cultural and physical factors. Psychol Health Med. 2006;11:425–31. doi: 10.1080/13548500600678164. [DOI] [PubMed] [Google Scholar]
- 24.Rizk DE, Nasser M, Thomas L, Ezimokhai M. Women’s perceptions and experiences of childbirth in United Arab Emirates. J Perinat Med. 2001;29:298–307. doi: 10.1515/JPM.2001.043. [DOI] [PubMed] [Google Scholar]
- 25.Balaha, MH, Obstetric and Psychiatric Outcomes in a Sample of Saudi Teen-Aged Mothers 8, 2009. : p. 285-90.
- 26.Kim-Godwin YS. Postpartum beliefs and practices among non-Western cultures. MCN Am J Matern Child Nurs. 2003;28:74–8. doi: 10.1097/00005721-200303000-00006. [DOI] [PubMed] [Google Scholar]
- 27.Hamdan A, Tamim H. Psychosocial risk and protective factors for postpartum depression in the United Arab Emirates. Arch Women’s Ment Health. 2011;14:125–33. doi: 10.1007/s00737-010-0189-8. [DOI] [PubMed] [Google Scholar]
- 28.Chaaya M, Campbell OM, El Kak F, Shaar D, Harb H, Kaddour A. Postpartum depression: prevalence and determinants in Lebanon. Arch Women’s Ment Health. 2002;5:65–72. doi: 10.1007/s00737-002-0140-8. [DOI] [PMC free article] [PubMed] [Google Scholar]
- 29.Dibaba Y, Fantahun M, Hindin MJ. The association of unwanted pregnancy and social support with depressive symptoms in pregnancy: evidence from rural Southwestern Ethiopia. BMC Pregnancy Childbirth. 2013;13:135. doi: 10.1186/1471-2393-13-135. [DOI] [PMC free article] [PubMed] [Google Scholar]
- 30.Monti F, Agostini F, Fagandini P, La Sala GB, Blickstein I. Depressive symptoms during late pregnancy and early parenthood following assisted reproductive technology. Fertil Steril. 2009;91:851–7. doi: 10.1016/j.fertnstert.2008.01.021. [DOI] [PubMed] [Google Scholar]
- 31.Dias CC, Figueiredo B. Breastfeeding and depression: a systematic review of the literature. J Affect Disord. 2015;171:142–54. doi: 10.1016/j.jad.2014.09.022. [DOI] [PubMed] [Google Scholar]
- 32.Henshaw EJ, Fried R, Siskind E, Newhouse L, Cooper M. Breastfeeding self-efficacy, mood, and breastfeeding outcomes among primiparous women. J Hum Lact. 2015;31:511–8. doi: 10.1177/0890334415579654. [DOI] [PubMed] [Google Scholar]
- 33.Baker L, Cross S, Greaver L, Wei G, Lewis R, Healthy Start C. Prevalence of postpartum depression in a native American population. Matern Child Health J. 2005;9:21–5. doi: 10.1007/s10995-005-2448-2. [DOI] [PubMed] [Google Scholar]
- 34.Parsons CE, Young KS, Rochat TJ, Kringelbach ML, Stein A. Postnatal depression and its effects on child development: a review of evidence from low- and middle-income countries. Br Med Bull. 2012;101:57–79. doi: 10.1093/bmb/ldr047. [DOI] [PubMed] [Google Scholar]
- 35.Bell AF, Carter CS, Davis JM, Golding J, Adejumo O, Pyra M, et al. Childbirth and symptoms of postpartum depression and anxiety: a prospective birth cohort study. Arch Women’s Ment Health. 2016;19:219–27. doi: 10.1007/s00737-015-0555-7. [DOI] [PMC free article] [PubMed] [Google Scholar]
- 36.Gelaye B, Rondon MB, Araya R, Williams MA. Epidemiology of maternal depression, risk factors, and child outcomes in low-income and middle-income countries. Lancet Psychiatry. 2016;3:973–82. doi: 10.1016/S2215-0366(16)30284-X. [DOI] [PMC free article] [PubMed] [Google Scholar]
- 37.Patel HL, Ganjiwale JD, Nimbalkar AS, Vani SN, Vasa R, Nimbalkar SM. Characteristics of postpartum depression in Anand District, Gujarat, India. J Trop Pediatr. 2015;61:364–9. doi: 10.1093/tropej/fmv046. [DOI] [PubMed] [Google Scholar]
- 38.Ongeri L, Wanga V, Otieno P, Mbui J, Juma E, Stoep AV, et al. Demographic, psychosocial and clinical factors associated with postpartum depression in Kenyan women. BMC Psychiatry. 2018;18:318. doi: 10.1186/s12888-018-1904-7. [DOI] [PMC free article] [PubMed] [Google Scholar]
- 39.Adewuya AO, Fatoye FO, Ola BA, Ijaodola OR, Ibigbami SM. Sociodemographic and obstetric risk factors for postpartum depressive symptoms in Nigerian women. J Psychiatr Pr. 2005;11:353–8. doi: 10.1097/00131746-200509000-00009. [DOI] [PubMed] [Google Scholar]
- 40.Ekuklu G, Tokuc B, Eskiocak M, Berberoglu U, Saltik A. Prevalence of postpartum depression in Edirne, Turkey, and related factors. J Reprod Med. 2004;49:908–14. [PubMed] [Google Scholar]
- 41.Patel V, Rodrigues M, DeSouza N. Gender, poverty, and postnatal depression: a study of mothers in Goa, India. Am J Psychiatry. 2002;159:43–7. doi: 10.1176/appi.ajp.159.1.43. [DOI] [PubMed] [Google Scholar]
- 42.Galea LA, Wide JK, Barr AM. Estradiol alleviates depressive-like symptoms in a novel animal model of post-partum depression. Behav Brain Res. 2001;122:1–9. doi: 10.1016/s0166-4328(01)00170-x. [DOI] [PubMed] [Google Scholar]
- 43.Green AD, Barr AM, Galea LA. Role of estradiol withdrawal in ‘anhedonic’ sucrose consumption: a model of postpartum depression. Physiol Behav. 2009;97:259–65. doi: 10.1016/j.physbeh.2009.02.020. [DOI] [PubMed] [Google Scholar]
- 44.Schiller CE, O'Hara MW, Rubinow DR, Johnson AK. Estradiol modulates anhedonia and behavioral despair in rats and negative affect in a subgroup of women at high risk for postpartum depression. Physiol Behav. 2013;119:137–44. doi: 10.1016/j.physbeh.2013.06.009. [DOI] [PMC free article] [PubMed] [Google Scholar]
Associated Data
This section collects any data citations, data availability statements, or supplementary materials included in this article.


