Abstract
Background:
Frozen section (FS) diagnosis is one of the promising applications of digital pathology (DP). However, the implementation of an appropriate and economically viable DP solution for FS in routine practice is challenging. The objective of this study was to establish the non-inferiority of whole-slide imaging (WSI) versus optical microscopy (OM) for FS diagnosis using a low cost and portable DP system.
Materials and Methods:
A validation study to investigate the technical performance and diagnostic accuracy of WSI versus OM for FS diagnosis was performed using 60 FS cases[120 slides i.e, 60 hematoxylin and eosin (H & E) and 60 toluidine blue (TOLB)]. The diagnostic concordance, inter- and intra-observer agreement for FS diagnosis by WSI versus OM were recorded.
Results:
The first time successful scanning rate was 89.1% (107/120). Mean scanning time per slide for H and E and TOLB slide was 1:47 min (range; 0:22–3: 21 min) and 1:46 min (range; 0:21–3: 20 min), respectively. Mean storage space per slide for H and E and TOLB slide was 0.83 GB (range: 0.12–1.73 GB) and 0.71 GB (range: 0.11–1.66 GB), respectively. Considering major discrepancies, the overall diagnostic concordance for OM and WSI, when compared with the reference standard, was 95.42% and 95.83%, respectively. There was almost perfect intra as well as inter-observer agreement (k ≥ 0.8) among 4 pathologists between WSI and OM for FS diagnosis. Mean turnaround time (TAT) of 14:58 min was observed using WSI for FS diagnosis, which was within the College of American Pathologists recommended range for FS reporting. The image quality was average to best quality in most of the cases.
Conclusion:
WSI was noninferior to OM for FS diagnosis across various specimen types. This portable WSI system can be safely adopted for routine FS diagnosis and provides an economically viable alternative to high-end scanners.
Keywords: Digital pathology, frozen section, primary diagnosis, validation, whole-slide imaging
INTRODUCTION
The imaging technology used for telepathology (TP) has transformed significantly from static images to whole-slide imaging (WSI). Evolving technological advancements and regulatory approval for various TP systems have paved the way for digital pathology (DP) to move from research and education to routine diagnostic workflow.[1,2,3,4,5] One of the most promising applications of TP is intra-operative consultation, i e., frozen section (FS) diagnosis. This facility enables remote sites lacking direct pathologist support/specialist pathologist to obtain expert consultation intraoperatively, thereby reducing costs, preventing medical errors, and improving quality.[6,7,8,9]
Many TP systems are now capable of enabling remote FS diagnosis with minimal deferral rate, excellent accuracy, and in a reasonably timely fashion. Dynamic image streaming technologies (robotic and nonrobotic TP systems) and WSI systems are being increasingly used for FS diagnosis in recent times.[7,9] Although WSI has many advantages as compared to the conventional TP technologies, the exorbitant cost of the WSI systems and timely transmission of heavy digital files may be the major limiting factors in adopting WSI for FS diagnosis. In addition, few digital scanners may not be able to handle the temporarily mounted wet FS slides, which often also have frequent artefacts (e.g., variable thickness, tissue folds). Further, acquiring a dedicated high-end digital slide scanner exclusively for FS may not be economically viable.
Few centers have adopted digital imaging for remote FS diagnosis, especially in specific sub-specialties, for example, neuropathology intra-operative consultation. However, relatively limited studies have documented its utility across a range of specimens encountered in a routine FS workflow. Hence, to justify the implementation of an appropriate and economically viable DP solution for FS diagnosis in routine clinical practice, we performed a validation study to investigate the technical performance and diagnostic accuracy of WSI versus conventional optical microscopy (OM) for FS diagnosis using a low cost and portable WSI system. To the best of our knowledge, this is the first-ever study conducted on the diagnostic utility of WSI for FS diagnosis using a portable digital scanner system.
MATERIALS AND METHODS
This blinded prospective observational study was performed at a tertiary care oncology center, following approval from the institutional ethics committee. Both technical and diagnostic capabilities of WSI platform were assessed.
Case enrolment, scanning, and viewing
The glass slides of the cases accessioned for routine FS diagnosis between June 1, 2019 and June 30, 2019 were screened for enrolment in this study. Out of 86 cases initially screened, 60 cases that represented a standard set of cases, encountered in routine practice at our institution were shortlisted by the enrolment pathologist for evaluation, in accordance with the College of American Pathologists (CAP) recommendations for validation of DP for primary diagnosis.[10] The slides with minimum glass slide artifacts were finally selected for evaluation. Hence, those slides which had extensive folded tissue areas, freezing artifacts compromising staining, mounting artifacts such as bubbles and indelible markings were excluded. In addition, a set of 10 FS cases were used for training purposes to acquaint the pathologists to nuances of DP systems and these cases were not included in the final analysis. The selected FS cases were categorized into three broad categories, namely, primary diagnosis, margin and lymph node status, based on the original clinical request. For each individual case, a minimum of two slides were selected, including each of hematoxylin and eosin (H and E) and toluidine blue (TOLB)-stained slides, as per the existing department practice for slide preparation in FS. Hence, a set of 120 glass slides representing 60 cases formed the study cohort. The glass slides were de-identified and assigned a unique study identification number.
The selected slides were scanned in the FS room using Grundium Ocus®, Finland, single-slide microscope-based scanner at ×20 magnification (0.48 μm/pixel) in default setting, utilizing automated mode for tissue detection, as per the manufacturer's instructions. This scanner has its own in-built computer system with 500 GB internal storage and preinstalled, scanning software, image viewing software, image server, and web server. The scanner was operated through a laptop device, i.e., Dell inspiron with 2.60 GHz processor (Intel® Core™ i5-7300 CPU, 8 GB RAM, 64–bit operating system [Windows 10 pro]) to execute the scanning instruction in FS Room. The digital images were subsequently evaluated remotely from the pathologist's offices located in another building by connecting the scanner device with institute local area network at minimum connectivity speed of 1 Gbps and using chrome web-browser through http://grundium.netsoftwareweb-link [Figure 1]. The pathologists used their office computers for assessment, i.e., Dell Optiplex 5260, all-in-one desktop workstation consisting of a 3.20 GHz processor (Intel® Core™ i7-8700 CPU, 8GB RAM, 64–bit operating system [Windows 10 pro]) and LCD (flat panel) monitors with 21.5” screen size, a color depth of 8 bit, 1920 × 1200 display resolution, the brightness of 400 cd/m2 and contrast ratio of at least 1000:1. All the digital slides were archived on an external hard disc for future reference.
Figure 1.

Digital workflow environment using Grundium Ocus® for frozen section reporting; LAN: Local area network
Onsite technical assessment of the whole-slide imaging system
Functional capabilities of the scanner were assessed onsite with respect to the scanning of different types of slide preparations, i.e., H and E and TOLB (versatility), successful scanning rate (number of the first-time scan and rescans), scanning speed (scan time per slide) and image size for each case.
Diagnostic assessment; whole-slide imaging versus OM
The diagnostic evaluation was performed by four pathologists at various stages of their career in the field of diagnostic pathology. All participating pathologists had previous experience in evaluating digital images and were involved in validation of WSI for primary diagnosis in surgical pathology at our institute.[4,5]
Each case was independently assessed twice by every pathologist. Initial assessment was performed over the office computer connected to the WSI system followed by conventional OM, after a washout period of 4 weeks. The intra-observer concordance of the diagnoses rendered by each participating pathologist was evaluated [Figure 2]. The reading pathologist was provided with relevant clinico-radiological information available at the time of the intra-operative consultation and was blinded to the original FS diagnosis. Each diagnosis rendered by the reading pathologist on a case (whether by WSI or OM) was termed a “read.” Hence, there were 8 “reads” per case, besides the reference (sign-out) diagnosis.
Figure 2.
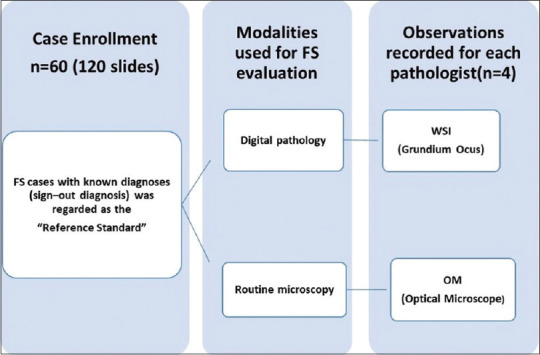
Study workflow
The original sign-out diagnosis during routine clinical workflow, using the existing OM in FS room was used for clinical decision making and was considered as the reference standard. The diagnoses rendered either on WSI or OM by participating pathologists were compared against this reference diagnosis for evaluating the diagnostic accuracy. All discordances between reference diagnoses and OM diagnoses, were reviewed independently by subspecialty pathologists and final reference standards were re-established for the analysis. Diagnostic discrepancies were classified as major and minor discordances, depending on the level of clinical impact it can cause. In addition to the overall percentage of concordance and discordance, inter-observer as well as intra-observer kappa agreement for WSI versus OM, were calculated [Figure 3].
Figure 3.
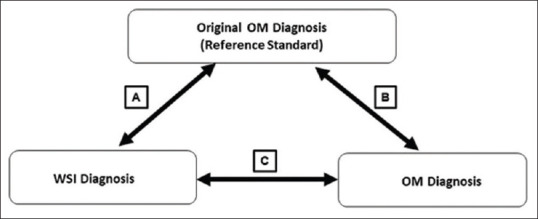
Study design for diagnostic evaluation. (A) Inter-observer agreement between reference diagnosis and WSI diagnoses (B) Inter-observer agreement between reference diagnosis and OM diagnoses of participating pathologist (C) Intra-observer agreement of the individual OM diagnosis of the participating pathologist and WSI diagnoses. OM: Optical microscopy, WSI: Whole-slide imaging
The level of confidence for reporting of each case and digital image quality was evaluated for each case. The level of confidence for reporting was scored on the scale of 1–3, where 1 denoted low, 2 - average, and 3 - high level of confidence for the diagnosis rendered and the image quality was assessed on a scale of 1–3, where 1 represented the worst quality, 2 – average, and 3 - best quality.
Diagnostic assessment time; turnaround time(TAT)
Diagnostic assessment time for rendering the diagnosis for each case was recorded for both the modalities and was compared for an individual pathologist. FS total TAT was defined as the interval between the receipt of tissue in the FS room and the time of communication of the diagnosis. This time was recorded as follows. Slide preparation time (SPT) referred to the interval between receiving tissue and the availability of slide/images for review by the pathologist. This included scanning time and time for the relay of the images for TP consultation in addition to the FS glass SPT. Slide interpretation time (SIT) referred to the interval between the receipt of the first diagnostic image by the pathologist and the communication of the diagnosis. Hence, TAT = SPT (inclusive of scanning time) + SIT.
Statistical analysis
All statistical analysis was performed using IBM SPSS Statistics for Windows, Version 25., (IBM Corp., Armonk, New York, USA). The number of major and minor discordances and percentage of concordance of diagnosis by OM and WSI were calculated to determine the accuracy rate. To establish the noninferiority of WSI over OM, the cut-off criteria of <4% as proposed by Bauer et al. was adopted.[11] Inter-observer and intra-observer agreement between OM and WSI were estimated through unweighted kappa statistics [Figure 3]. Based on the Landis and Koch guidelines, κ (kappa) values were interpreted as 0–0.2 representing poor agreement, 0.2–0.4 fair, 0.4–0.6 moderate, 0.6–0.8 substantial, and ≥0.8 perfect agreement.[12]
RESULTS
A comparative evaluation of the digital scanning platform was performed using 60 FS cases to assess the technical and diagnostic performance of the WSI as opposed to routine OM. The study set comprised 120 glass slides (60 H and E and 60 TOLB). The distribution of these cases according to the clinical indication was as follows: Lymph node status (n = 27/60; 45%), margin assessment (n = 22/60; 37%) and primary diagnosis (n = 11/60; 18%). A total of 480 diagnostic reads (OM-240, WSI-240) by 4 evaluating pathologists were recorded in order to assess the diagnostic accuracy and reproducibility of the WSI diagnosis as compared to OM for these 60 cases.
The results were recorded under four broad categories as follows:
1. Onsite technical assessment
Of the 120 slides, 107 slides (89.1%) were successfully scanned on the first occasion. Thirteen slides (11%) required rescan and were successfully scanned on the second attempt. The total time taken for scanning these 120 slides was 210:49 min. The mean scanning time per slide for H and E and for TOLB stained slide was 1:47 min (range; 0:22–3: 21 min) and 1:46 min (range; 0:21–3: 20 min), respectively. A total digital data of 87.8 GB were generated by scanning these 120 slides. The mean storage space occupied per slide for for a H&E-stained slidewas 0.83GB (range: 0.12–1.73 GB) and for a TOLB stained slide was 0.71 GB (range: 0.11–1.66 GB). There was no significant difference in scanning time and storage space occupied by digital images among different specimen types [Table 1].
Table 1.
Mean scanning time and storage space utilization; overall and as per specimen type for whole slide imaging
| Specimen type | Overall (n=60) | Lymph node (n=27) | Margin (n=22) | Primary diagnosis (n=11) | ||||
|---|---|---|---|---|---|---|---|---|
|
|
|
|
|
|||||
| H and E | TOLB | H and E | TOLB | H and E | TOLB | H and E | TOLB | |
| Scanning time (min), mean (range) | 1:47 (0:22-3:21) | 1:46 (0:21-3:20) | 1:51 (1-2:50) | 1:50 (1-2:51) | 1:52 (0:30-3:21) | 1:51 (0:29-3:18) | 1:38 (0:22-3:01) | 1:37 (0:21-2:50) |
| Storage space (GB) mean (range) | 0.83 (0.12-1.73) | 0.71 (0.11-1.66) | 0.87 (0.2-1.7) | 0.78 (0.11-1.6) | 0.83 (0.12-1.70) | 0.78 (0.10-1.72) | 0.75 (0.20-1.46) | 0.65 (0.12-1.34) |
TOLB: Toluidine blue, H and E: Hematoxylin and eosin
2. Diagnostic assessment; WSI versus OM
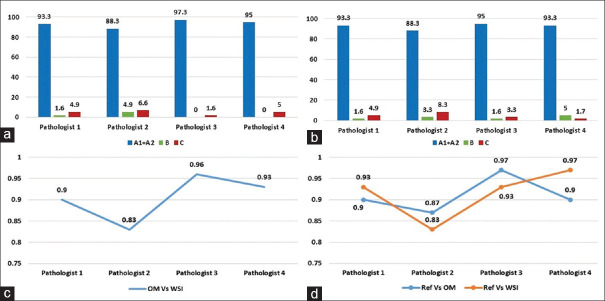
In the current study, overall diagnostic accuracy when compared with the reference standard for OM and WSI was 93.5% (range 88.3%–97.3%) and 92.5% (range 88.3%–95%), respectively. The diagnostic assessment of individual pathologists is illustrated in the bar diagram [Figure 4a and b]. The mean difference in the diagnostic accuracy between WSI and OM with reference standard was <4% for all four pathologists; thus proving that WSI was noninferior to OM for the primary diagnosis of FS. Specimen-wise analysis of the frozen cases also revealed that WSI was non–inferior to OM for lymph node assessment, margin assessment, and primary diagnosis.
Figure 4.
Bar diagram shows the diagnostic accuracy of OM versus reference standard (a) and WSI versus reference standard (b). Line diagram shows intra-observer agreement of four pathologists between OM and WSI (c) and inter-observer agreement of four pathologists using OM and WSI as compared to a reference standard (d); Concordance (Absolute [A1] and essentially correct [A2]) and Discordance (minor [B] and major [C]), OM: Optical microscopy, WSI: Whole-slide imaging
There was almost perfect intra-observer agreement (k ≥ 0.8) between WSI and OM for four pathologists (mean k coefficient of 0.9 for WSI vs. OM). There was also near-perfect inter-observer agreement (k ≥ 0.8) for WSI and OM (mean k coefficient of 0.91 for OM and 0.91 for WSI) in comparison with the reference standard for all pathologists [Figure 4c and d].
In the current study, out of 480 diagnostic reads, a total of 34 discordant reads were recorded, on both OM and WSI platforms by all four pathologists(21 major discordant reads in 8 cases and 12 minor discordant reads in 5 cases). Using OM, a total of 15 discrepant reads were recorded (11 major discrepancies and 4 minor discrepancies), while using WSI, a total of 18 discrepant reads were recorded (10 major discrepancies and 8 minor discrepancies) [Figure 5]. Most discordances were observed in observations recorded by Pathologist 2. Considering only major discrepancies, the overall diagnostic accuracy for OM and WSI, when compared with the reference standard, was 95.42% and 95.83%, respectively. Hence, the difference between the clinically significant discrepancies by WSI and OM diagnosis was 0.41% (95% confidence interval, 0.25–1.0) and this difference was not statistically significant. Examples of few discordant cases in the current study are illustrated in Figure 6.
Figure 5.
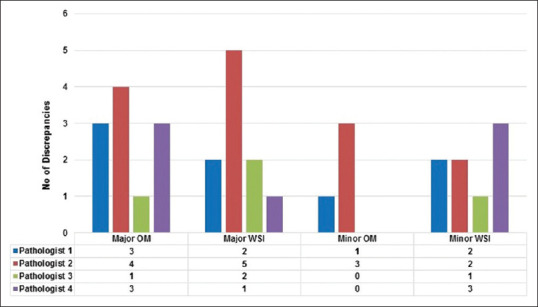
Bar diagram shows major and minor discordances for each individual pathologist on WSI and OM, as compared to the reference standard
Figure 6.
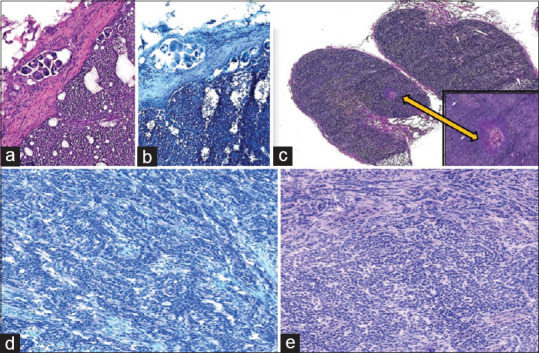
Photomicrograph of a few discordant cases. (a) The scanty focus of metastatic adenocarcinoma in the lymph node in case of carcinoma breast (a: H and E; ×4, b: Toluidine blue; ×4) (a) Scanty focus of metastatic squamous carcinoma (c: H and E; ×4, inset - H and E; ×10) Granulosa cell tumor misdiagnosed on WSI as adenocarcinoma (d: H&E; ×10, e: Toluidine blue; ×10)
All discordances(major and minor) observed in this study were summarized in [Table 2]. The major discordances were noted in 3 cases each for lymph node status and primary diagnosis assessment and in 2 cases for margin assessment. All 6 cases of minor discordances were seen in cases for primary diagnosis.
Table 2.
Summary of all discordant reads
| Specimen type | Reference diagnosis | Observed diagnosis | Modality (OM/WSI) and discrepant pathologist | Discordance category |
|---|---|---|---|---|
| Lymph node | Metastatic lymph node | Reactive LN | P1-OM P2-WSI |
Major |
| Lymph node | Reactive LN | Metastatic LN | P2-WSI | Major |
| Lymph node | Reactive LN | Metastatic LN | P2-OM | Major |
| Primary diagnosis | Breast (nipple under shave)-benign breast disease Ductal hyperplasia |
DCIS | P1-OM and WSI P2-OM and WSI P3-WSI P4-OM and WSI |
Major |
| Primary diagnosis | Thyroid-papillary thyroid carcinoma | Adenomatous thyroid lesion with goitre Benign thyroid lesion |
P2-WSI P3-OM and WSI |
Major |
| Primary diagnosis | Oesophagus-squamous cell carcinoma | Hyperplastic and inflamed squamous mucosa | P1-WSI | Major |
| Margin | Tongue base-involved by squamous cell carcinoma | Free of tumour | P1-OM P2-OM P4-OM |
Major |
| Margin | Larynx-dysplasia | Free of dysplasia/tumour | P2-OM &WSI P4-OM |
Major |
| Primary diagnosis | Thyroid-Papillary thyroid carcinoma | Follicular carcinoma of thyroid | P4-WSI | Minor |
| Primary diagnosis | Frozen diagnosis: Salivary gland tumor with secretory morphology Metastatic adenocarcinoma Final HPR: Secretory carcinoma of salivary gland |
Papillary thyroid carcinoma metastasis | P1-WSI | Minor |
| Primary diagnosis | Esophagus: Squamous cell carcinoma (microinvasive) | Dysplastic and inflamed squamous mucosa | P2-OM and WSI P3-WSI |
Minor |
| Primary diagnosis | Gall bladder-papillary adenocarcinoma | Intracystic papillary proliferation | P2-OM and WSI | Minor |
| Primary diagnosis | Ovary: Benign serous cystadenoma | Borderline ovarian tumor | P1-WSI P2-OM and WSI |
Minor |
| Primary diagnosis | Ovary: Sex cord tumor favor granulosa cell tumor | Adenocarcinoma | P1-OM P4-WSI |
Minor |
LN: Lymph node, OM: Optical microscopy, WSI: Whole-slide imaging, P1: Pathologist 1, P2: Pathologist 2, P1-P3: Pathologist 3, P4-P1: Pathologist 4, DCIS: Ductal carcinoma in situ
3. Diagnostic assessment time and turnaround time; WSI versus OM
The mean diagnostic assessment time for OM was less as opposed to WSI across all specimen types for FS diagnosis by all pathologists [Table 3 and Figure 7]. Pathologist 3 took relatively less time for reporting on WSI as compared to other pathologists. Besides the usual mean SPT of 10 minfor a single frozen case, in our study, an additional time of 3:33 min was required[mean scanning time: 1:47 min (range: 0:22–3: 21 min) for H&E slide and 1:46 min (range; 0:21–3: 20 min) for TOLB slide]. The mean SIT was 1:12 min using WSI (total time taken in WSI by four pathologists for 60 cases = 288:7 min; average time taken by one pathologist for 60 cases = 72:2 min; average time taken by one pathologist per case = 1:12 min). Hence, an average TAT of 14.45 min (SPT + SIT i.e., (10 + 3.33) + 1.2 = 14.45 min) per case was recorded in our study using WSI for FS diagnosis.
Table 3.
Mean diagnostic assessment time for various specimen per case using optical microscopy and whole-slide imaging
| Pathologist 1 | Pathologist 2 | Pathologist 3 | Pathologist 4 | |||||
|---|---|---|---|---|---|---|---|---|
|
|
|
|
|
|||||
| OM | WSI | OM | WSI | OM | WSI | OM | WSI | |
| Overall (s) | 34.98 (5-130) | 77.2 (12-240) | 52.2 (5-197) | 76.5 (13-244) | 24.95 (5-88) | 50.43 (12-240) | 53.93 (10-269) | 83.95 (6-343) |
| Lymph nodes (s) | 53.5 (5-110) | 64.03 (13-127) | 37.70 (5-130) | 78 (12-200) | 21.7 (5-70) | 52.1 (10-120) | 62.48 (12-269) | 93.78 (6-343) |
| Margin (s) | 24 (10-54) | 71.70 (50-121) | 43.27 (21-89) | 67.18 (24-113) | 18.09 (10-49) | 37.73 (22-52) | 39.18 (23-66) | 64.55 (20-187) |
| Primary diagnosis (s) | 37.13 (9-95) | 78.2 (16-240) | 55.5 (10-197) | 96.5 (23-244) | 32.36 (5-88) | 54.72 (10-150) | 50.82 (10-102) | 81.59 (11-236) |
WSI: Whole slide imaging, OM: Optical microscopy
Figure 7.
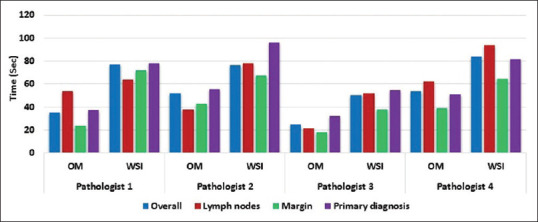
Bar diagram shows mean diagnostic assessment time for OM and WSI by specimen type for each pathologist
4. Assessment of digital image quality and level of confidence
The image quality was average to the best quality in most of the cases. Pathologist 3 had assigned score 2 for image quality in more number of cases as compared to others. There was no significant difference for image quality between HE and TOLB sections [Figure 8]. The level of confidence was low for WSI when compared to the OM for all the participants. The highest level of confidence was noted with the interpretation of lymph nodes, whereas the lowest level of confidence was noted with the primary diagnosis by three pathologists. On the contrary, Pathologist 4 recorded the highest level of confidence in cases for primary diagnosis and the lowest level of confidence for interpretation of negative lymph nodes [Figure 9].
Figure 8.
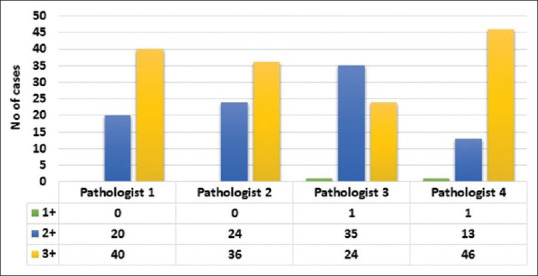
Bar diagram shows the level of image quality as evaluated by study pathologists
Figure 9.
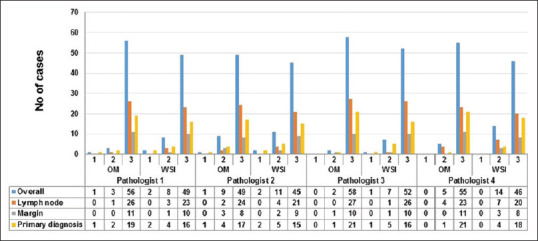
Bar diagram shows the overall level of confidence of pathologists for whole-slide imaging and OM according to specimen types
DISCUSSION
Recently published guidelines advocate robust validation of WSI platforms for each application before adoption into clinical practice.[5,10,11] Increased interest in the use of DP for FS diagnosis was observed recently. However, its actual use for routine FS practice is still very limited. The major hurdles preventing the more widespread use of TP for FS include technical hurdles pertaining to scanning and timely transmission of the FS slides in digital formats, economical barriers and reluctance amongst the pathologist to use this technology for FS diagnosis. Pathologists have generally been of the opinion that suboptimal image quality will result in errors in FS diagnosis with adverse patient outcomes and medico-legal consequences.[6,9,13,14,15] Hence, there is a need to explore efficient and cost effective WSI system for intra-operative consultation.
In order to address these issues and to justify the implementation of a DP solution for the FS diagnosis, we undertook this comprehensive validation using a compact portable scanner, in accordance with the CAP clinical validation recommendations for WSI.[10] A wide spectrum of complexity of cases (60 cases including lymph nodes, margins and tissue for primary diagnosis), likely to closely emulate the real-world clinical environment were included in this study which was evaluated by WSI and OM with a wash-off period of 1 month between each evaluation. The current study is unique, since it provided a detailed technical performance assessment covering all the parameters of WSI system, along with the conventional diagnostic assessment of WSI versus OM. Further, it also provided an opportunity not only for intra-observer comparison between individual OM versus WSI observations but also for the inter-observer comparison among the four pathologists for OM and WSI using a standard reference diagnosis, which was the first of its kind from the Indian subcontinent, for primary FS diagnosis.
In terms of scanning capabilities, the system used in this study i.e., Grundium Ocus®, performed fairly well for the handling of FS slides. The competence of this compact and portable scanner for FS diagnosis was clinically validated for the first time. Deployment and integration of this system into the routine workflow in FS were very easy and the whole setup took < 5 min to start the scanning process. This system was able to handle the wet FS slides efficiently, with the first time successful scanning rate of approximately 89.1% and and all failed slides could be successfully rescanned on the second attempt. Further, the risk of impairing the scanner's camera while handling the wet FS slides was minimal using this device, as the slides were placed horizontally on the stage and were not moved into the scanner device by any robotic arm.
Scan time and image size are matters of great concern, while adopting the DP for the FS diagnosis as they might influence the TAT, which is a critical factor, while rendering intra-operative consultation. Limited information is available in a realistic clinical setting addressing these determinants. In the current study, the total time taken to scan all the slides (n = 120) was 210:49 min and the average time taken to scan a slide was 1:45 min. There was no difference in the average time taken to scan H and E slides and TOLB slides. Hence, the current study emphasized the need for approximately additional 3:33 min to scan a single frozen case (one H and E and one TOLB slide). The average scan time required in our study was within the range and was similar to other studies (3–11 min) [Table 4]. Hence, converting the glass slides to digital format using this system, did not impact the TAT for FS diagnosis significantly, and can be adopted safely without compromising the need for prompt FS diagnosis. The WSI images are usually very heavy (in GB) as compared to radiology digital images (in KB). Hence, the average file size of the image will have a direct impact on the transmission of slides in digital format, the cost for digital archival and maintenance of the WSI database. A total of 120 slides included in this study, when scanned generated digital data of 87.8 GB and the average size per slide was 0.73 GB. There was no difference in the average file size of digital H and E slides and TOLB slides. Hence, approximately 1.5–2 GB (including each of H and E and TOLB slides) of the storage space would be required per frozen case.
Table 4.
Comparison of the current study with the major published whole-slide imaging studies for frozen section diagnosis in literature
| Reference, year | Number of cases | Scanner | Diagnostic accuracy (%) | Observer variability | Cohen’s kappa (K) | Mean scanning time (range) | Mean reporting time (range) |
|---|---|---|---|---|---|---|---|
| Tsuchihashi et al., 2008 | 15 | Vassalo | 100 | N/S | N/P | 10 min (N/S) | 5 min (N/S) |
| Slodkowska et al., 2009 | 33 | Aperio scan scope | 100 | Inter-observer | N/P | N/S (2-7 min) | N/S (1-2 min) |
| Fallon et al., 2010 | 52 | Mirax Desk | 96 | Inter-observer | N/P | 9 (1-20 min) | N/S (3-5 min) |
| Ramey et al., 2011 | 67 | Aperio scan scope | 89 | Inter-observer | 0.85 | 3 (1-9 min) | 1 (30 s-13 min) |
| Gould et al., 2012 | 30 | Nanozoomer 2.0 | 96.7 | Inter-observer | N/P | N/S | N/S |
| Perron et al., 2014 | 104 | Nanozoomer 2.0 | 98.1 | Inter-observer | N/P | 5 min (1-25 min) | 1 min (1-10 min) |
| Ribback et al., 2014 | 1204 | Mirax Desk | 98.6 | Intra-observer | N/P | 11 min (3-19 min) | |
| Bauer et al., 2015 | 70 | Aperio CS2 | 95.7 | Intra-observer | N/P | N/S | N/S |
| Yu et al., 2017 | 100 | Aperio AT2 | 1:61 2:74 3:87 4:75 |
Inter-observer | N/P | N/S | N/S |
| Cima et al.,2018 | 125 | Navigo | 97 | Intra-observer | 0.96 | 12 min | 3 min |
| Present study 2020 | 60 | Grundium Ocus® | 95 | Inter-observer and intra-observer | Inter: 0.915 Intra: 0.905 |
H and E: 1 min 47 s TOLB: 1 min 46 s |
1 min 8 s |
N/P: Not performed, N/S: Not specified, TOLB: Toluidine blue
The current study has provided more realistic information on average scan time and image size required across various slide preparation types used in FS diagnosis[Table 2].
Several retrospective validation studies have demonstrated acceptable accuracy rates (average accuracy rate - 96.7%; range 68%–100%) for TP diagnoses of FS [Table 4].[6,8,14,15,16,17,18,19,20,21] Hence, the utility of TP for primary FS diagnosis is growing as we move into an age of increasing sub-specialization and centralization of pathology services. In the year 2008, Tsuchihashi et al. reported one of the first experiences using remote FS evaluation with WSI technology in a pilot study comprising 15 test cases.[8] There was 100% diagnostic concordance using the virtual slide system in this historic study. In the year 2014, Ribback et al. reported the large series of FS diagnosis using digital imaging, where 1204 FS cases were scanned and showed a diagnostic accuracy rate of 98.6% using digital slides.[14] In the current study, the overall diagnostic accuracy using WSI was 95.83% considering major discordances, which was within the range that has been reported in the literature [Table 4]. In addition, we found that the difference in diagnostic accuracy between OM and WSI was <4% and hence WSI can be regarded as noninferior to OM for FS diagnosis. Further, there was almost perfect inter-observer and intra-observer agreement (k > 0.8) for all pathologists between OM and WSI evaluation as compared to the reference standard. Hence, WSI can be safely deployed for FS diagnosis.
The annual discrepancy rates as reported by Evans from University Health Network in Toronto, Canada, on >4000 Toronto Western Hospital FS by WSI in the real-world scenario by comparing FS diagnoses to final permanent diagnoses ranged from 0% to 2%.[7] In our study, the major discordance rate for OM was 4.58% and for WSI was 4.17%. The possible reasons for marginally higher number of disparity in both OM and WSI discordance with respect to the reference standard, in our cohort, as compared to reported in the literature could be due to (1) inherent interpretation difficulties even with OM in few cases, possibly related to their innate complex nature, (2) difference in the experience of participating pathologists for DP, and (3) less number of cases in our study cohort for each specimen subtype.
Despite the use of a compact portable scanner used in this study, the image quality was equivalent to any other high resolution scanner as the resolution of the system is more or less standard, i.e., 0.48 um/pixel at ×20 objective. Since no correlation between the discordance and quality of digital images could be established, discrepancies in this study were possibly related to pathologist interpretation errors and not directly related to technical factors. The overall level of confidence for reporting FS was low using WSI when compared to the OM for all the participants. Hence, consistent routine use and training on WSI are the only ways to improve the level of diagnostic confidence in WSI.
In this study, we have found that the average time taken to evaluate a frozen case using WSI was 1:12 min (range 0: 50–1:16 min) which is well within range of the published literature (viz. 1–5 min) [Table 4]. Three out of 4 previous validation studies, have reported a longer diagnostic time for WSI compared to OM.[22,23,24,25,26] We also observed that the overall time required for OM was less as opposed to WSI across all frozen specimen types. Increased time taken for diagnosis on WSI may be due to the pathologists' limited previous experience on reporting frozen cases by WSI. This can be overcome with more practice, consistent use and training with WSI.
As per CAP recommendations, TAT for releasing the report on a single block FS as calculated from the time the pathologist receives FS specimens to the time that pathologist conveys FS diagnosis to the surgeon is 20 min.[27] Evans et al. had also reported average TAT for single block FS using WSI ranged from 14 to 16 min.[7] Average TAT of approximately 15 min was observed in our study using WSI for FS diagnosis, which was within the recommended range as per CAP recommendations for FS diagnosis.
CONCLUSION
Based on this prospective validation for use of WSI platform for FS diagnosis including technical, diagnostic and operational factors, it can be concluded that WSI was noninferior to OM for FS diagnosis across various specimen types. TAT observed in our study using WSI for FS diagnosis was within CAP recommended range. Further training and consistent use are required to improve evaluation time and level of confidence with this technology for intraoperative consultation. Space constraints in FS room, cost, and workflow integration were the major concerns for choosing an appropriate scanner for FS diagnosis. This petite, compact, high precision, user-friendly, and portable scanner provided a practical solution to our requirement for adoption of WSI for FS diagnosis and proved to be an economically viable alternative to high end scanners.
Financial support and sponsorship
Nil.
Conflicts of interest
There are no conflicts of interest.
Footnotes
Available FREE in open access from: http://www.jpathinformatics.org/text.asp?2021/12/1/5/307703
REFERENCES
- 1.Cornish TC, Swapp RE, Kaplan KJ. Whole-slide imaging: Routine pathologic diagnosis. Adv Anat Pathol. 2012;19:152–9. doi: 10.1097/PAP.0b013e318253459e. [DOI] [PubMed] [Google Scholar]
- 2.Griffin J, Treanor D. Digital pathology in clinical use: Where are we now and what is holding us back? Histopathology. 2017;70:134–45. doi: 10.1111/his.12993. [DOI] [PubMed] [Google Scholar]
- 3.Evans AJ, Salama ME, Henricks WH, Pantanowitz L. Implementation of Whole Slide Imaging for Clinical Purposes: Issues to Consider From the Perspective of Early Adopters. Arch Pathol Lab Med. 2017;141:944–59. doi: 10.5858/arpa.2016-0074-OA. [DOI] [PubMed] [Google Scholar]
- 4.Rao V, Subramanian P, Sali AP, Menon S, Desai SB. Validation of Whole Slide Imaging for primary surgical pathology diagnosis of prostate biopsies. Indian J Pathol Microbiol. 2021;64:78–83. doi: 10.4103/IJPM.IJPM_855_19. [DOI] [PubMed] [Google Scholar]
- 5.Rajaganesan S, Kumar R, Rao V, Pai T, Mittal N, Sahay A, et al. Comparative assessment of digital pathology systems for primary diagnosis. J Pathol Inform. 2021;12:25. doi: 10.4103/jpi.jpi_94_20. [DOI] [PMC free article] [PubMed] [Google Scholar]
- 6.Bauer TW, Slaw RJ, McKenney JK, Patil DT. Validation of whole slide imaging for frozen section diagnosis in surgical pathology. J Pathol Inform. 2015;6:49. doi: 10.4103/2153-3539.163988. [DOI] [PMC free article] [PubMed] [Google Scholar]
- 7.Evans AJ, Chetty R, Clarke BA, Croul S, Ghazarian DM, Kiehl TR et al. Primary frozen section diagnosis by robotic microscopy and virtual slide telepathology: the University Health Network experience. Semin Diagn Pathol. 2009;26:165–76. doi: 10.1053/j.semdp.2009.09.006. [DOI] [PubMed] [Google Scholar]
- 8.Tsuchihashi Y, Takamatsu T, Hashimoto Y, Takashima T, Nakano K, Fujita S. Use of virtual slide system for quick frozen intra-operative telepathology diagnosis in Kyoto, Japan. Diagn Pathol. 2008;3(Suppl 1):1–2. doi: 10.1186/1746-1596-3-S1-S6. [DOI] [PMC free article] [PubMed] [Google Scholar]
- 9.Wilbur DC, Madi K, Colvin RB, Duncan LM, Faquin WC, Ferry JA, et al. Whole-slide imaging digital pathology as a platform for teleconsultation: A pilot study using paired subspecialist correlations. Arch Pathol Lab Med. 2009;133:1949–53. doi: 10.1043/1543-2165-133.12.1949. [DOI] [PMC free article] [PubMed] [Google Scholar]
- 10.Pantanowitz L, Sinard JH, Henricks WH, Fatheree LA, Carter AB, Contis L, et al. Validating whole slide imaging for diagnostic purposes in pathology: Guideline from the College of American Pathologists Pathology and Laboratory Quality Center. Arch Pathol Lab Med. 2013;137:1710–22. doi: 10.5858/arpa.2013-0093-CP. [DOI] [PMC free article] [PubMed] [Google Scholar]
- 11.Bauer TW, Schoenfield L, Slaw RJ, Yerian L, Sun Z, Henricks WH. Validation of whole slide imaging for primary diagnosis in surgical pathology. Arch Pathol Lab Med. 2013;137:518–24. doi: 10.5858/arpa.2011-0678-OA. [DOI] [PubMed] [Google Scholar]
- 12.Landis JR, Koch GG. An application of hierarchical kappa-type statistics in the assessment of majority agreement among multiple observers. Biometrics. 1977;33:363–74. [PubMed] [Google Scholar]
- 13.Farahani N, Parwani AV, Pantanowitz L. Whole slide imaging in pathology: Advantages, limitations, and emerging perspectives. Pathol Lab Med Int. 2015;7:4321. [Google Scholar]
- 14.Ribback S, Flessa S, Gromoll-Bergmann K, Evert M, Dombrowski F. Virtual slide telepathology with scanner systems for intraoperative frozen-section consultation. Pathol Res Pract. 2014;210:377–82. doi: 10.1016/j.prp.2014.02.007. [DOI] [PubMed] [Google Scholar]
- 15.Perron E, Louahlia S, Nadeau L, Boilard F, Ing M, Orain M, et al. Telepathology for intraoperative consultations and expert opinions: The experience of the Eastern Québec Telepathology Network. Arch Pathol Lab Med. 2014;138:1223–8. doi: 10.5858/arpa.2013-0466-OA. [DOI] [PubMed] [Google Scholar]
- 16.Fallon MA, Wilbur DC, Prasad M. Ovarian frozen section diagnosis: Use of whole-slide imaging shows excellent correlation between virtual slide and original interpretations in a large series of cases. Arch Pathol Lab Med. 2010;134:1020–3. doi: 10.5858/2009-0320-OA.1. [DOI] [PubMed] [Google Scholar]
- 17.Słodkowska J, Pankowski J, Siemiatkowska K, Chyczewski L. Use of the virtual slide and the dynamic real-time telepathology systems for a consultation and the frozen section intra-operative diagnosis in thoracic/pulmonary pathology. Folia Histochem Cytobiol. 2009;47:679–84. doi: 10.2478/v10042-010-0009-z. [DOI] [PubMed] [Google Scholar]
- 18.Ramey J, Fung KM, Hassell LA. Use of mobile high-resolution device for remote frozen section evaluation of whole slide images. J Pathol Inform. 2011;2:41. doi: 10.4103/2153-3539.84276. [DOI] [PMC free article] [PubMed] [Google Scholar]
- 19.Gould PV, Saikali S. A comparison of digitized frozen section and smear preparations for intraoperative neurotelepathology. Anal Cell Pathol (Amst) 2012;35:85–91. doi: 10.3233/ACP-2011-0026. [DOI] [PMC free article] [PubMed] [Google Scholar]
- 20.Yu H, Gao F, Jiang L, Ma S. Development of a whole slide imaging system on smartphones and evaluation with frozen section samples. JMIR Mhealth Uhealth. 2017;5:e132. doi: 10.2196/mhealth.8242. [DOI] [PMC free article] [PubMed] [Google Scholar]
- 21.Cima L, Brunelli M, Parwani A, Girolami I, Ciangherotti A, Riva G, et al. Validation of remote digital frozen sections for cancer and transplant intraoperative services. J Pathol Inform. 2018;9:34. doi: 10.4103/jpi.jpi_52_18. [DOI] [PMC free article] [PubMed] [Google Scholar]
- 22.Lauro GR, Cable W, Lesniak A, Tseytlin E, McHugh J, Parwani A, et al. Digital pathology consultations – A new era in digital imaging, challenges and practical applications. J Digit Imaging. 2013;26:668–77. doi: 10.1007/s10278-013-9572-0. [DOI] [PMC free article] [PubMed] [Google Scholar]
- 23.Vodovnik A. Diagnostic time in digital pathology: A comparative study on 400 cases. J Pathol Inform. 2016;7:4. doi: 10.4103/2153-3539.175377. [DOI] [PMC free article] [PubMed] [Google Scholar]
- 24.Gui D, Cortina G, Naini B, Hart S, Gerney G, Dawson D, et al. Diagnosis of dysplasia in upper gastro-intestinal tract biopsies through digital microscopy. J Pathol Inform. 2012;3:27. doi: 10.4103/2153-3539.100149. [DOI] [PMC free article] [PubMed] [Google Scholar]
- 25.Velez N, Jukic D, Ho J. Evaluation of 2 whole-slide imaging applications in dermatopathology. Hum Pathol. 2008;39:1341–9. doi: 10.1016/j.humpath.2008.01.006. [DOI] [PubMed] [Google Scholar]
- 26.Jen KY, Olson JL, Brodsky S, Zhou XJ, Nadasdy T, Laszik ZG. Reliability of whole slide images as a diagnostic modality for renal allograft biopsies. Hum Pathol. 2013;44:888–94. doi: 10.1016/j.humpath.2012.08.015. [DOI] [PubMed] [Google Scholar]
- 27.Novis DA, Zarbo RJ. Interinstitutional comparison of frozen section turnaround time.A College of American Pathologists Q-Probes study of 32868 frozen sections in 700 hospitals. Arch Pathol Lab Med. 1997;121:559–67. [PubMed] [Google Scholar]


