

Abstract
Functional localizers are invaluable as they can help define regions of interest, provide cross-study comparisons, and most importantly, allow for the aggregation and meta-analyses of data across studies and laboratories. To achieve these goals within the non-human primate (NHP) imaging community, there is a pressing need for the use of standardized and validated localizers that can be readily implemented across different groups. The goal of this paper is to provide an overview of the value of localizer protocols to imaging research and we describe a number of commonly used or novel localizers within NHPs, and keys to implement them across studies. As has been shown with the aggregation of resting-state imaging data in the original PRIME-DE submissions, we believe that the field is ready to apply the same initiative for task-based functional localizers in NHP imaging. By coming together to collect large datasets across research group, implementing the same functional localizers, and sharing the localizers and data via PRIME-DE, it is now possible to fully test their robustness, selectivity and specificity. To do this, we reviewed a number of common localizers and we created a repository of well-established localizer that are easily accessible and implemented through the PRIME-RE platform.
Keywords: fMRI, Non-human primate, Brain, Localizers, Retinotopy, Face, Metadata
1. Importance of functional localizers in the study of primate brain functions
Localizers are extensively used in fMRI studies, whether in human or non-human primates, in order to identify cortical regions of interest in a systematic and repeatable manner. For example, in a face localizer paradigm (Kanwisher et al., 1997), stimuli from different visual categories containing face and non-face stimuli are presented to identify face-selective areas by contrasting the hemodynamic responses to face and non-face stimuli. These activations can subsequently serve as reference anatomo-functional anchor points that can be compared across studies and to guide invasive follow-up studies. For example, face areas can be easily identified in and compared across multiple subjects or across species using a face localizer (Tsao et al., 2008a). These activations can also serve as a starting point for studies investigating the functional properties of these localized areas in independent tasks. For example, one can study how face patches differentially respond to positive and negative facial expressions (Hadj-Bouziane et al., 2008; Zhu et al., 2013). Moreover, these studies can serve to build probabilistic functional brain atlas (Huang et al., 2019; Janssens et al., 2014). Last but not least, such localizers are becoming more and more critical for guiding invasive electrophysiological and perturbation studies which are required to unravel the precise neuronal properties in these fMRI-defined patches (Alizadeh et al., 2018; Caprara et al., 2018; Conway et al., 2007; Dubois et al., 2015; Freiwald et al., 2009; Gerits et al., 2012; Miyamoto et al., 2017; Park et al., 2017; Taubert et al., 2015; Tsao et al., 2006; Van Dromme et al., 2015).
1.1. Characteristics of efficient functional localizers
A functional localizer ideally needs to meet specific conditions that are briefly reviewed here (Saxe et al., 2006). A valid localizer needs to be robust and specific. The validity of a given localizer will rely on whether when the same localizer, same task, and same stimuli are used, the obtained brain activations are highly reproducible across subjects, studies, and research centers. Additionally, the localizer needs to be specific enough to selectively activate regions of interest involved in the targeted functional processes to the exclusion of others (Berman et al., 2010). For example, a face localizer can be defined by the contrast between face stimuli and inanimate object stimuli. A more specific face localizer can be defined by the contrast between face stimuli and a mixture of inanimate object stimuli and animated non-face stimuli such as animals, headless bodies and so on.
Lastly a localizer should also be unbiased. While specificity is necessary for a good functional localizer, for example, using expanding rings in a retinotopic localizer to favor a response towards eccentricity coding. This specificity must be considered when interpreting results. For example, although a given localizer (e.g. standardized neutral front-facing faces) might specifically target a certain functional property in an unbiased manner (i.e., neutral and front-facing faces), the same localizer might miss areas relevant to another process of interest (e.g. gaze following, (Marciniak et al., 2014)). Therefore, it is important for researchers to fully understand the notion of specificity associated with a given localizer, and the potential descriptive biases it inherently introduces. Accounting for these features and correcting for them can help foster the development of novel localizers. Additionally, novel analytical approaches (such as dimensionality reduction or machine learning algorithms) can help uncover and correct for biases introduced by a given localizer, by a combination of localizers to look for common and defining features.
The activations obtained by such localizers can be directly compared across subjects and experimental setups. Importantly, the resultant functional observations can be shared and pooled, enhancing the statistical power of the described effects and fostering the inferences that can be drawn from such data (Rossion et al., 2012). In addition, they often capture functional properties more consistently and precisely than atlas-based stereotaxic or anatomical localization, particularly when the function does not perfectly correspond to structural landmarks. The subject-specific regions of interest (ROI) identified by such localizers are described at a higher sensitivity and an enhanced functional resolution (Nieto-Castañón and Fedorenko, 2012). They can subsequently be used in order to probe local functional responses to more complex fMRI designs (Berman et al., 2010). Because hypotheses can be tested on these ROIs rather than on the whole brain, statistical power is enhanced, and this statistical benefit is further boosted in multivariate analyses within these regions, such as multi-voxel pattern analyses (MVPA, (Abassi and Papeo, 2020; Dubois et al., 2015; Rezk et al., 2020; Shashidhara et al., 2020; Valdés-Sosa et al., 2020)). Care should be taken to avoid double-dipping and circular statistical reasoning, whereby the subsequent functional interrogation of localizer-identified ROIs is performed on a different dataset than the localizer data (Button, 2019; Kriegeskorte et al., 2009). In the context of non-human primate research, these functional ROIs or fiducials can also be targeted by single cell recordings or focal perturbation tools to identify the neuronal categories that subserve their functional activation as well as the underlying computation (Dubois et al., 2015; Freiwald et al., 2009; Park et al., 2017; Popivanov et al., 2014; Taubert et al., 2015; Klink et al., 2021, this issue). Overall, an efficient localizer thus enhances solid knowledge accumulation. Several localizer sharing initiatives can be found in the human fMRI community (e.g., the Stanford Vision and Perception Neuroscience localizers, or the Social Cognitive Neuroscience lab localizers). Starting such a localizer sharing initiative is at the core of the present paper.
1.2. Benefits of localizer studies to NHP neuroscience research
In the context of NHP imaging, functional localizers have distinctive added value compared to human imaging. The first most straightforward advantage is the increase in the number of subjects, when pooled across study sites, while at the same time allowing each study to comply with the reduction principle of the 3R’s (refinement, reduction, replacement) (Prescott and Lidster, 2017; Prescott and Poirier, 2021; Tannenbaum and Bennett, 2015). This results in higher power in group analyses while at the same time offering a better description and understanding of inter-individual differences. Second, as already indicated above, localizer-identified ROIs have extremely high value to precisely guide electrophysiological recordings or reversible manipulations at well-identified functional sites in the same animal (Alizadeh et al., 2018; Caprara et al., 2018; Conway et al., 2007; Dubois et al., 2015; Freiwald et al., 2009; Gerits et al., 2012; Miyamoto et al., 2017; Park et al., 2017; Taubert et al., 2015; Tsao et al., 2006; Van Dromme et al., 2015). In addition, the understanding of inter-individual variability in these localizer-identified ROIs can serve to optimize electrophysiological or focal perturbations in monkeys that cannot be scanned for fMRI due to non-MRI compatible head-mounted hardware, easy access to MRI facility, or time constraints. When time constraints are at stake, the use of localizers that require minimal animal training, or relying on probabilistic localizers can be useful (Huang et al., 2019; Janssens et al., 2014). Last but not least, using the same functional localizer in different primate species (e.g., humans, macaques, and marmosets) is crucial to understand functional homologies and differences in functional and anatomo-functional organization of the brain (Hung et al., 2015; Mantini et al., 2012b; Orban and Jastorff, 2014; Peeters et al., 2009; Van Essen and Glasser, 2018). In the following, we exemplify the prospective utility of sharing NHP localizer data to two specific topics: cortical lateralization in primates and anatomo-functional organization constraints across primate species.
Hemispheric specialization is thought to be an important feature for sensory and cognitive processing, and is especially pronounced in humans (Karolis et al., 2019). Although anatomical, psychophysical and lesion studies in monkeys provided some evidence for hemispheric lateralization (Denenberg, 1981; Falk, 1987; Halpern et al., 2005; Hamilton, 1983; Vogels et al., 1994), surprisingly little physiological data exist outside the auditory system for lateralized processing in non-human primates (Heffner and Heffner, 1984; Joly et al., 2012b; Poremba et al., 2004). The main reason is that electrophysiology, which constitutes the majority of functional studies in NHP, is suboptimal to provide conclusive evidence concerning lateralized processing. Asymmetrical electrophysiological responses in the two hemispheres may be explained by mismatched homotopic targets leading to systematic sampling biases. To avoid such issues, whole brain imaging is superior for addressing the lateralization question, as imaging is expected to be void of spatial sensitivity biases across both hemispheres when care is taken that the profile and sensitivity of surface coils are well balanced. Although several neuroimaging laboratories obtained indications for lateralized processing in NHP (Gil-da-Costa et al., 2006; Joly et al., 2012b; Petkov et al., 2008; Poremba et al., 2004), these data cannot be considered irrefutable due to the low number of animals participating in such experiments. Concerted efforts using similar paradigms, as promoted in the present manuscript will yield enough power to finally make conclusive inferences about this potentially fundamental functional organization principle in primate brains. This type of data sharing can be further enhanced by a systematic documentation of monkey manual lateralization using for example the bimanual coordination tube task (Hopkins, 1995). This would be important as, for macaques and marmosets, the two main primate species used in MRI neuroimaging, the existence of a population-level handedness remains unclear for bimanual coordinated tasks, although at least in macaques, strong individual hand preferences have been reported (Meguerditchian et al., 2013).
What defines the localization of functional areas with respect to anatomical landmarks such as sulci or fundi and whether this could be at the root of inter-species and -individual differences is an important question in neuroscience. Indeed, anatomical landmarks such as sulci or gyri are thought to reflect underlying cortico-cortical and subcortical connectivity (Passingham et al., 2002; Van Essen, 1997), cortical folding patterns have been associated with psychiatric and neurological disorders (Cachia et al., 2008; Im et al., 2008; Penttilä et al., 2009), and described to be under genetic control (Atkinson et al., 2015; Belmonte et al., 2015). Accordingly, the morphology of human ventromedial prefrontal or midcingulate cortex influences its functional organization (Amiez et al., 2018; 2013; Lopez-Persem et al., 2019). In parallel, recent studies have compared sulcal organization across primates (humans, chimpanzees, Baboons and macaques), and showed a progressive complexification of sulci brain patterns, some patterns being preserved across species, others the probability of occurring increasing from macaques to humans, and others yet only present in chimps or humans (Amiez et al., 2019; Van Essen et al., 2019). This contributes to addressing the question of evolution of brain functions across macaque species (Van Essen et al., 2016; Van Essen and Glasser, 2018). In the discussion on inter-species and inter-individual functional variability, the question of functional-anatomical correspondence is a crucial question, as some anatomical landmarks are preserved across species and individuals while others are not (Amiez et al., 2019; Baumann et al., 2013; Orban et al., 2004; Sereno and Tootell, 2005; Tootell et al., 2003; Vanduffel et al., 2014). This question has been widely explored in humans due to the data availability in large cohorts of subjects. So far, this is an underexploited research avenue in monkeys, the major limiting factor being cohort size.
There is thus a strong scientific need for collecting robust and replicable imaging data from NHPs. However, the primate neuroimaging community has collected localizer data using non-uniform laboratory specific protocols. As a result, and because of the lack of coherence across localizer studies, little of the existing data can currently be shared or pooled. Platforms such as PRIME-DE and PRIME-RE aim to achieve scalable NHP imaging (Milham et al., 2020, 2018; Messinger et al., 2021, this issue) and collect standardized localizer data across centers worldwide. Most of the localizers that will be discussed next have also been used in humans, thus opening the floor to in-depth and large-scale investigation of cross-species functional and anatomo-functional homologies. Obtaining such large scale ‘homogeneous’ data sets using the same paradigms is exactly one of the ideas put forward in the current manuscript.
1.3. Proper understanding of localizer data
While the localizer approach has proven extremely useful in human and monkey cognitive neuroscience research using fMRI, a critique of this approach has also been voiced (Friston et al., 2006). The main idea behind these considerations is that one always needs to keep in mind what specific process each specific localizer captures and which processes it might actually miss. For example, the target sensory or cognitive process might be state and/or context-dependent. Thus, a single localizer might be too restrictive in identifying relevant functional ROIs. This might be more critical for ROIs higher up in the processing hierarchy, where a diversity of operations may be implemented, compared to lower level ROIs. Also, by using localizer-based ROIs to seed more complex fMRI task analyses, one assumes response homogeneity within these ROIs. If one believes there may be significant heterogeneity of responses with a region, voxel-based analyses, such as searchlight MVPA (Haxby et al., 2001), might be more appropriate to probe the target functional networks.
Furthermore, while the aim of this review is to provide a set of unifying localizers that can be implement across research groups, it is additionally important for new localizers to be developed for identifying more specific or even novel targets. Such new localizers are expected to refine current knowledge about the brain, and to acquire new knowledge about functional brain organization. In this respect, it is useful to associate them with more standard localizers, so as to have precise grounds of description and comparison relative to prior knowledge. For example, the gaze following face patch cannot be identified using the classical face patch localizers and requires a specific type of localizers to be identified (Marciniak et al., 2014).
2. Challenges in the face of efficient cross-center non-human primate fMRI localizer data sharing
While the scientific value of collecting and sharing NHP localizer fMRI data is clear, several constraints need to be anticipated and solutions formalized in order to make such data collection and sharing as efficient and useful as possible. In the following section, we identify two independent types of challenges. The first pertains to sources of possible cross-center discrepancies in data collection which complicate subsequent cross-center data analysis (see Box 1). The second relates to the need for minimizing the time and effort put on each center in the process of data collection, so that as many centers as possible invest in this effort.
Box 1. Sources of variance in standard localizers.
The goal of any good localizer is to provide a reliable estimate of the region(s) that respond best to a particular category of stimuli. The estimates need to be reliable both within a given subject and importantly, across the population. It is therefore critical for researchers to assess sources of variance for each type of localizer in order to accurately compare responses across subjects and different localizers. Below, we describe some of the main sources of variance that can influence the reliability and generalizability of localizers:
Stimuli: The choice of specific stimuli can have a major impact on the reliability and reproducibility of a given localizer paradigm, in a given subject and across subjects. This is particularly true for early perceptual localizer such as visual retinotopic and auditory tonotopic mapping, whereas for higher level localizers there can be more leeway in the exact stimulus choice. As an example, in retinotopic mapping the choice between expanding rings and rotating wedges will provide differential maps of retinotopy based on eccentricity or angular preference. However, face localizers are only minorly influenced by the use of human or monkey faces, or using objects or scrambled images as the control condition. The choice of a given stimulus should be made carefully with respect to the exact nature of the localizer, and one should try to match the existent literature as it will increase the ability to compare across studies and populations.
Paradigm: Generally speaking, there are three main paradigms used in localizers, block designs, event-related designs, and phase-encoding approaches. Block designs tend to have the most reliable response as they take advantage of the cumulative effect of the slow hemodynamic response, whereas event-related designs are excellent for differentiating individual stimuli and components of a given task. Phase encoding approaches do not seek to identify specific regions of interests. Rather, their aim is to identify the preferred response dimension of each cortical voxel (e.g. eccentricity or orientation), all throughout the cortical extent of interest (e.g. striate, extrastriate, temporal, parietal etc.)
Behavior: A critical component of almost any localizer is the animal’s behavior, and how performance is measured. It cannot be overstated how reliant fMRI data is on the compliance of the subject to the task parameters. Like stimulus choice, behavior can have a particularly strong influence on low-level perceptual localizers. Retinotopic maps require the tight fixation of the subject across the whole paradigm. Behavior also has a strong influence on higher-order cognitive localizers, involving attention or decision-making. Indeed, several of the cortical regions involved in these processes are also responsive to eye saccades. More generally, any source of signal of non-interest (saccades, retinal slip, change in blink rate or in heart rate, etc.) will impact the reliability with which the signals of interest can be described (Poirier et al., this issue).
2.1. Sources of possible variability across center & minimal harmonization requirements
Signal-to-noise ratio can vary across non-human MRI centers due to multiple non-neuronal sources of variability (Milham et al., 2018). These include the specific scanner, receive coils, transmit coils, and sequences employed. Other sources relate to the use of BOLD vs. contrast agents (type, dosage, half-life, etc.), head fixation system, monkey training procedures for minimizing head motion artefacts, and maybe most important, actual monkey behavior. While some of these cross-center differences are inescapable, others can be minimized thanks to anticipated coordination (e.g., BOLD vs. contrast agents).
Additional sources of cross-center differences arise from the specifics of the experimental design and hardware used, in terms of stimulus duration, frequency, luminosity, contrast w/background, categories, and the quality of projectors, MR compatible headphones and other stimulus-delivery hardware. Subtle variations in these components may impact effect size at equal sample sizes (number of blocks or runs). In phase-encoded retinotopic mapping, differences in timing parameters (e.g., stimulus timing) or spatial stimulation (e.g., visual field coverage) parameters may have a drastic impact on the analyses. This will affect (or even preclude) group analyses and bias inter-individual variability analyses. Collectively agreeing beforehand on a standardized localizer, i.e. a set of stimuli and a specific stimulation design, ideally by sharing the stimuli and the design on a preselected set of experimental control platforms would help solve several of these issues and provide a clear guide for critical experimental parameters (see Box 2).
Box 2. Requirements for sharing localizer data and links to localizer stimuli samples.
Equalizing stimulation conditions:
One should aim to equalize, as much as possible, the sensory stimulation across different laboratories, which are usually equipped with different stimulation and acquisition hardware. For visual stimulation, for example, one should try to present the stimuli at the same size, the same spatial and temporal resolution, and with same mean luminance. To measure accurately all events, it can be useful to present a small white square, synchronized with the on- and offset of the stimuli, in one of the corners of the screen, but invisible to the monkeys. The same can be done for natural movie sequences, whereby the photocell can be stimulated at the beginning of each TR, simply by inserting this small white square in the corner of a movie, again invisible for the monkeys. These light transitions can be captured with a photocell. Timestamps of these photo events can be used in subsequent analysis and are exceedingly useful to have accurate post-hoc logs of all event types, including the synchronized position of the eyes, hands, pupil size, juice rewards, etc. These events can be further used as regressors of (no) interest. The photo events on their own are an excellent means to check post-hoc if the planned stimuli were actually presented during the experiment, particularly relevant in event-related designs.
Metadata to collect in addition to imaging data:
(see Poirier et al., this issue for a broader discussion on this topic). For most localizers, it is important to collect concomitantly with fMRI data eye information, either using MRI compatible video-tracking systems (at 60 Hz or more) or eye information extracted from the fMRI images (at TR resolution). For some localizer data, heart rate can be an important metadata to track. Automated video-based heart rate tracking methods are now available and could be used across centers (Froesel et al., 2020). As larger cohorts of animals start to participate in experiments across multiple sites, it would be highly beneficial to acquire blood samples for genetic analysis. Other more trivial experimental details such as weight, gender, date and hour of data acquisition, housing conditions should be accurately logged as they may provide additional insights in the results. Although not feasible for many sites, additional physiological measures such as respiration, but also body motion could add useful information in the analyses and for the interpretation of the results.
Pick and collect your localizer:
Below are links towards downloadable localizer stimuli from the Prime-RE website @https://prime-re.github.io/resources. Each localizer comes with a description file that specifies the minimal data collection requirement to maximize data sharing feasibility (in terms of implementation and data pooling), quality and optimal exploitation (in terms of metadata). See supplementary material for localizer description. Beyond the localizers made available at this time, this list is meant to be dynamically incremented as new localizers are validated, and older localizers refined. Please make sure to indicate when sharing your data the exact version of the localizer that your used. For any specific question contact Brian Russ, brian.russ@nki.rfmh.org. Individual localizer DIO should be properly cited on publication
Retinotopic localizer, http://doi.org/10.5281/zenodo.4043025, Wim.vanduffel@kuleuven.be
Monkey Face/Body Localizer, http://doi.org/10.5281/zenodo.4041128, Wim.vanduffel@kuleuven.be
Monkey Voice Localizer, http://doi.org/10.17605/OSF.IO/ARQP8, chris.petkov@newcastle.ac.uk
Tonotopic Localizer, http://doi.org/10.17605/OSF.IO/ARQP8, chris.petkov@newcastle.ac.uk
Movie localizer 1, https://doi.org/10.5281/zenodo.4044578, Brian.Russ@nki.rfmh.org
Movie localizer 2, upon request due to commercial copyrights, sk5899@nyu.edu
Movie localizer 3, upon request due to commercial copyrights, Wim.vanduffel@kuleuven.be
2.2. Minimal data collection burden
Localizers are usually run in preparation of, or in association with the main scientific goals of an experiment. Thus, localizers may vary from one laboratory to another and from one experiment to another. Getting multiple centers and multiple laboratories to contribute to the collection of the same set of predefined standardized localizers thus requires a minimization of the experimental burden. Animal training requirements should include head fixation and aim for minimal head movements during MRI scanning. Some localizers will additionally require that monkeys are trained on a variety of tasks, such as gaze fixation, or lever presses. Gaze fixation allows for controlling the retinal location of visual stimulation, and provides a direct measure for eye movement regressors of non-interest when an eye calibration is run before data acquisition. Most of these methods rely on video-eye tracking and cannot be used in naive untrained animals. It is noteworthy that eye position information can also be directly inferred from the fMRI time series of the eye voxels, albeit only at TR resolution. This approach has been developed in humans (Son et al., 2020) and is currently being tested in NHP experiments. The time cost of localizers on the rest of the scanning session should also be minimal. A target time cost below 10 min seems reasonable though this might be unachievable for some localizers. Alternatively, localizer data can be collected independently from the main experiment in one or two sessions. Ideally, the behavioral requirement on the monkeys would be such that the localizer runs could be played at the end of the experimental session rather than at the beginning, so as not to jeopardize data collection for the main experiment. A clear effect size analysis should allow researchers to specify, beforehand, the length of individual runs, the required number of runs collected per scanning session, as well as the overall recommended number of runs to be collected for reliable individual subject data analysis (see Box 1). Last, a clear common format for data and metadata logging should be defined in anticipation so as to facilitate data sharing and its expected benefit (see Box 2).
3. Existent localizers
A large variety of localizers have been developed and used in NHP fMRI research. In the following sections, we discuss both categorical or discrete localizers that identify ROIs selectively activated by one stimulus category (e.g. face localizers) and continuous localizers that allow the mapping of the topographical organization of a specific cortical function (e.g. phase-encoded retinotopic visual mapping localizers). We first review low-level sensory localizers. We subsequently address higher-level sensory and cognitive localizers. Whenever possible, we discuss whether and how the Prime-DE/Prime-RE consortia could contribute to enhancing data sharing for each type of localizer.
3.1. Low-level features
Perceptual features are a mainstay of functional localizers across all species, and have been used extensively with fMRI localizer paradigms. These ‘localizers’ are typically based on discoveries of the functional organization of sensory systems.
3.2. Somatosensory maps
Somatosensory regions of the primate cortex have been characterized extensively at the neurophysiological level. The localization of different body parts can be traced to an organized map that spans primary somatosensory cortex (S1) and is mirrored in the corresponding regions of primary motor cortex (M1). Due to this well-organized mapping of bodily regions, a number of studies have used somatosensory mapping as a means of validating their methods. Of particular relevance to the current discussion, the early functional resting state studies used interhemispheric somatosensory cortex to show that resting state fluctuations can be used to probe functionally connected regions of the brain (Biswal et al., 1995). While this research was conducted in humans, similar efforts have been conducted in NHPs (Xu et al., 2018).
The actual mapping of somatosensory cortex is fairly straightforward, though some of the required equipment is a bit specialized. The basic design used by most studies is a pneumatically driven device to deliver precisely timed pressurized air puffs via rigid tubing to tactors placed on the subject. These air puffs produce a light tap on the targeted tissue both in humans (Huang and Sereno, 2007) and monkeys (Avillac et al., 2007; Xu et al., 2018). Most often this stimulation is used in a block design, where two or more target regions are stimulated in alternating blocks, usually with rest, or unstimulated, blocks interspersed. Importantly, somatosensory mapping can be done in the anesthetized state making it easier to implement than many other localizers which can require significant behavioral training. The resolution of the somatosensory maps that are produced will vary based on both the spatial resolution of the MRI protocol and the placement of the differentially tactors. In the awake monkey, air puffs are often thought to be aversive. However, if training is performed with air puffs progressively increasing in intensity, up to an individual subject’s threshold, habituation can easily be achieved. It is easy, requiring minimal training, to target isolated body parts such as the face or the upper arms. In contrast, targeting the arms, hands, trunk or legs requires extensive training of monkeys not to move during the scanning sessions.
Surprisingly, to date, very few studies have provided a systematic whole-brain somatosensory fMRI mapping in the macaque monkey. Fine-grained functional connectivity on the somatosensory cortex has, for example, been mapped with ultra-high resolution rs-fMRI (9.4T) in the anesthetized squirrel monkey (Chen et al., 2007; Yang et al., 2018). In the awake macaque, Wardak et al. (2016) describe the face-centered somatosensory maps, comparing the cortical activations obtained for stimulation of the center or the periphery of the face, or the shoulders. Activations encompass primary and secondary somatosensory areas, prefrontal and premotor areas, and parietal, temporal, and cingulate areas as well as low-level visual cortex. While most of these cortical regions show a topographical organization of somatosensory responses, a parieto-frontal network appears to be selective for face stimulations and coincides with the network activated by visual stimulations in the peripersonal head-centered space (Cléry et al., 2018b) or approaching this space (Cléry et al., 2017). Somatomotor maps have also been investigated using fMRI in new-born monkeys, showing a refinement of the topographic somatosensory representation over development (Arcaro et al., 2019). Last, somatosensory maps have also been investigated using fMRI in the awake marmoset (Cléry et al., 2020).
A possible easy way to implement contribution of the Prime-DE consortium would be that multiple centers associate to provide, in the anesthetized monkey, a whole-body or body-part-centered high resolution mapping of somatosensory networks in multiple animals. This would entail sharing a common anesthesia protocol, acquisition sequence and coil positioning, an agreement on the use of a contrast agent and a precise definition of the body localization of the stimulations and their strength. This latter point could be achieved by sharing the prints for a 3D printable prosthesis embedding stimulators and sensors, and associated hardware.
3.3. Low-level auditory features
The functional organization of the macaque auditory cortex has been extensively studied over decades with lesion, tracer and neurophysiological studies. It is thought to consist of a set of interconnected, tonotopically organized ‘core’ regions receiving direct input from the medial geniculate nucleus, connected in turn to adjacent ‘belt’ and ‘para-belt’ regions along two bilateral dorsal and ventral streams of processing (Rauschecker, 1998; Rauschecker and Tian, 2000). In the auditory cortex, as in the visual cortex, there is an orderly progression of topography that captures the stimulation pattern across the sensory epithelium (the basilar membrane in the cochlea).There are also mirror reversals between adjacent fields that can be used to define borders between fields (Formisano et al., 2003). In the auditory domain, this can be conducted with tones or other sounds that have a certain center frequency and the variability in the center frequency will excite different parts of the auditory cortex where neurons show a preference for certain sound frequencies over others. Typically, a gradient analysis is conducted to evaluate the change in retinotopic or tonotopic selectivity and borders are easier to define between fields where gradients reverse. In the auditory system, this works well in between areas within primary (core) auditory cortical fields that are sensitive to pure tones and show mirror reversed gradients.
More recently, fMRI studies inspired by human neuroimaging have been used to functionally localize cortical fields using tonotopic mapping. Petkov et al. (2006) used sparse-sampling fMRI during auditory stimulation with tones and noises of different frequencies to derive gradients of frequency preference across voxels and identify region boundaries based on gradient reversals. This protocol could easily be adapted to a shorter ‘tonotopic localizer’ that could be used to identify primary cortical fields in a standardized manner across studies and sites.
However, non-primary fields surrounding the core (i.e., belt non-primary auditory cortex) respond more strongly to complex sounds like band-passed noise rather than simple tones (Rauschecker, 1998). Although these fields have gradients that are co-linear with the adjacent core fields, it is difficult to objectively define a border between the core and belt fields since it is based on the strength of tone/noise responses rather than a mirror reversed border. Although, currently, not all borders between fields can be defined with the same level of accuracy, having retinotopic or tonotopic maps allows making more meaningful inferences about where fMRI effects fall either based on individually identified maps or probability maps from the organization across several animals.
An alternative could consist of using auditory stimulation with complex natural sounds to derive tonotopic gradients and region boundaries based on modeling of each voxel’s frequency response. Using such an approach in the human brain, Moerel et al. (2014) found that tonotopic gradients were observable far beyond the primary areas known to respond to synthetic tones or noises. An added benefit of using complex natural stimuli for mapping is that features other than frequency can be mapped at the same time, such as pitch, spectral and temporal modulation rate, etc. A comparative macaque-human study presented similar natural sounds and used a multivariate model-based decoding approach in an attempt to compare the topographic organization of different auditory areas in the two species (Erb et al., 2019). This study revealed largely similar topographic maps of acoustic feature preferences for frequency, spectral and temporal modulations in the auditory belt and para-belt regions in both species. Tonotopic maps exhibited a mirror-symmetric low-high-low-high frequency gradient from posterior to anterior sectors in the lateral fissure.
Auditory localizers can be run on animals with head fixation implants and minimal eye fixation training. Multiple centers from the Prime-DE/Prime-RE consortium could thus associate to provide auditory localizer data on multiple monkeys. Similar to the somatosensory localizer, this would entail sharing a common acquisition sequence and coil positioning, an agreement on the use of a contrast agent, sharing the stimulation presentation design, as well as the auditory stimuli themselves (see Box 2).
3.4. Low-level visual features
As with human neuroimaging, the implementation of visual feature localizers has been practiced extensively in NHPs. Early visual areas are characterized by sensitivity to where light stimulates the retina topographically.
Retinotopic Organization.
One of the most implemented sets of localizers are those that help define retinotopic maps across early visual cortex. These localizers stimulate the visual field in a systematic manner which leads to an orderly activation of different portions of the visual cortices representing the stimulated regions. Retinotopic organization of the cortex has been hypothesized to be a defining principle for the organization of the primate visual cortices (Arcaro and Livingstone, 2017; Conway, 2018; Srihasam et al., 2014). A hierarchical, topographic organization is already present at birth in NHP and has been suggested to constitute a proto-organization for the entire primate visual system (Arcaro and Livingstone, 2017; Srihasam et al., 2014). As a functional localizer, retinotopic mapping can help delineate borders of early visual areas and to define the functional organization of early visual regions from V1 up to posterior inferotemporal cortex (Janssens et al., 2014; Kolster et al., 2014). Similarly, while receptive fields become larger in higher order visual areas (Boussaoud et al., 1991), numerous regions throughout the ventral and dorsal pathways respond to particular hemifields and exhibit differential mapping of foveal representations compared to peripheral representations (Ben Hamed et al., 2001; Kolster et al., 2014). With retinotopic organization being fairly ubiquitous throughout the visual brain, including significant portions of occipital, temporal, parietal and frontal cortex, retinotopic functional localizers are one of the most useful localizers to differentiate particular regions.
From a behavioral perspective, it is critically important that the eye position of the subject be tightly controlled. This has been accomplished in the past through two different means. Firstly, it is possible to map the retinotopic organization of the cortex while the subject is anesthetized, by opening the eye lids and projecting the stimuli on the retina using a fiber-optic system and a fundus camera (Brewer et al., 2002). Secondly, with well-trained animals, and a properly implemented eye tracking system, it is possible to collect retinotopic maps from awake animals. The quality of the functional data during such awake behaving retinotopy scans can be substantially improved when the position of the hands are also controlled. Information on both the hand and eye positions can be implemented during the operant conditioning of the subjects. The use of awake animals is particular attractive as it opens the door to comparing retinotopy to activations driven by more complex stimuli and tasks, and to reliably evoke visually-driven activity in higher order cortex which is often silenced during anesthesia.
There have been a number of different retinotopic mapping techniques depending on the exact nature of the research question being asked. We will discuss some of the more common paradigms. Historically, one started with the static presentation of flickering checkerboard patterns restricted to either the horizontal and vertical meridian, or to annuli at different eccentricities and scaled to the cortical magnification factor (Fize et al., 2003; Vanduffel et al., 2002). This approach, however, only reveals the representations of discrete portions of the visual field which is just sufficient to estimate roughly which eccentricities are represented in early visual cortex and to approximate borders of retinotopically organized visual areas, such as the vertical meridian representation between area V1 and V2, the horizontal meridian between V2 and V3, etc. In fact, most studies are restricted to only 10–15° of eccentricity, given hardware limitations to present large visual stimuli in a scanner. To obtain polar angle and eccentricity information from all voxels within these eccentricity ranges, phase encoded retinotopic mapping was first developed for humans (Sereno et al., 1995), and subsequently adopted by the macaque imaging community (Fig. 1, (Brewer et al., 2002; Janssens et al., 2014; Kolster et al., 2009, 2014)). In these paradigms, macaques are presented with alternating runs of expanding/contracting rings and clockwise/counterclockwise rotating wedges composed of flickering checkerboard patterns, while the monkeys maintain fixation at the center of the screen. The exact specifics of the timing of the paradigm will depend as much on the specifics of the scanner protocol, particularly the spatial resolution and repetition time (TR). However, generally, the rate of change in the ring expansion and wedge rotation should align with the protocol’s TR. In more recent approaches, more complex stimuli are embedded within the rotating wedges or expanding/contracting annuli, with the aim to drive cells with more complex receptive field properties in higher order areas -i.e., cells that are driven by complex stimulus features and not by simple checkerboards. These stimuli can be mixtures between flickering checkerboards and incorporated natural moving objects such as dynamic faces and walking subjects (Fig. 1). Together with stringent eye-movement and hand-movement controls these stimuli revealed highly robust retinotopic maps throughout substantial portions of visually-driven cortex (see supplemental information for the stimuli and Box 2, (Janssens et al., 2014; Kolster et al., 2014; Zhu and Vanduffel, 2019).
Fig. 1.
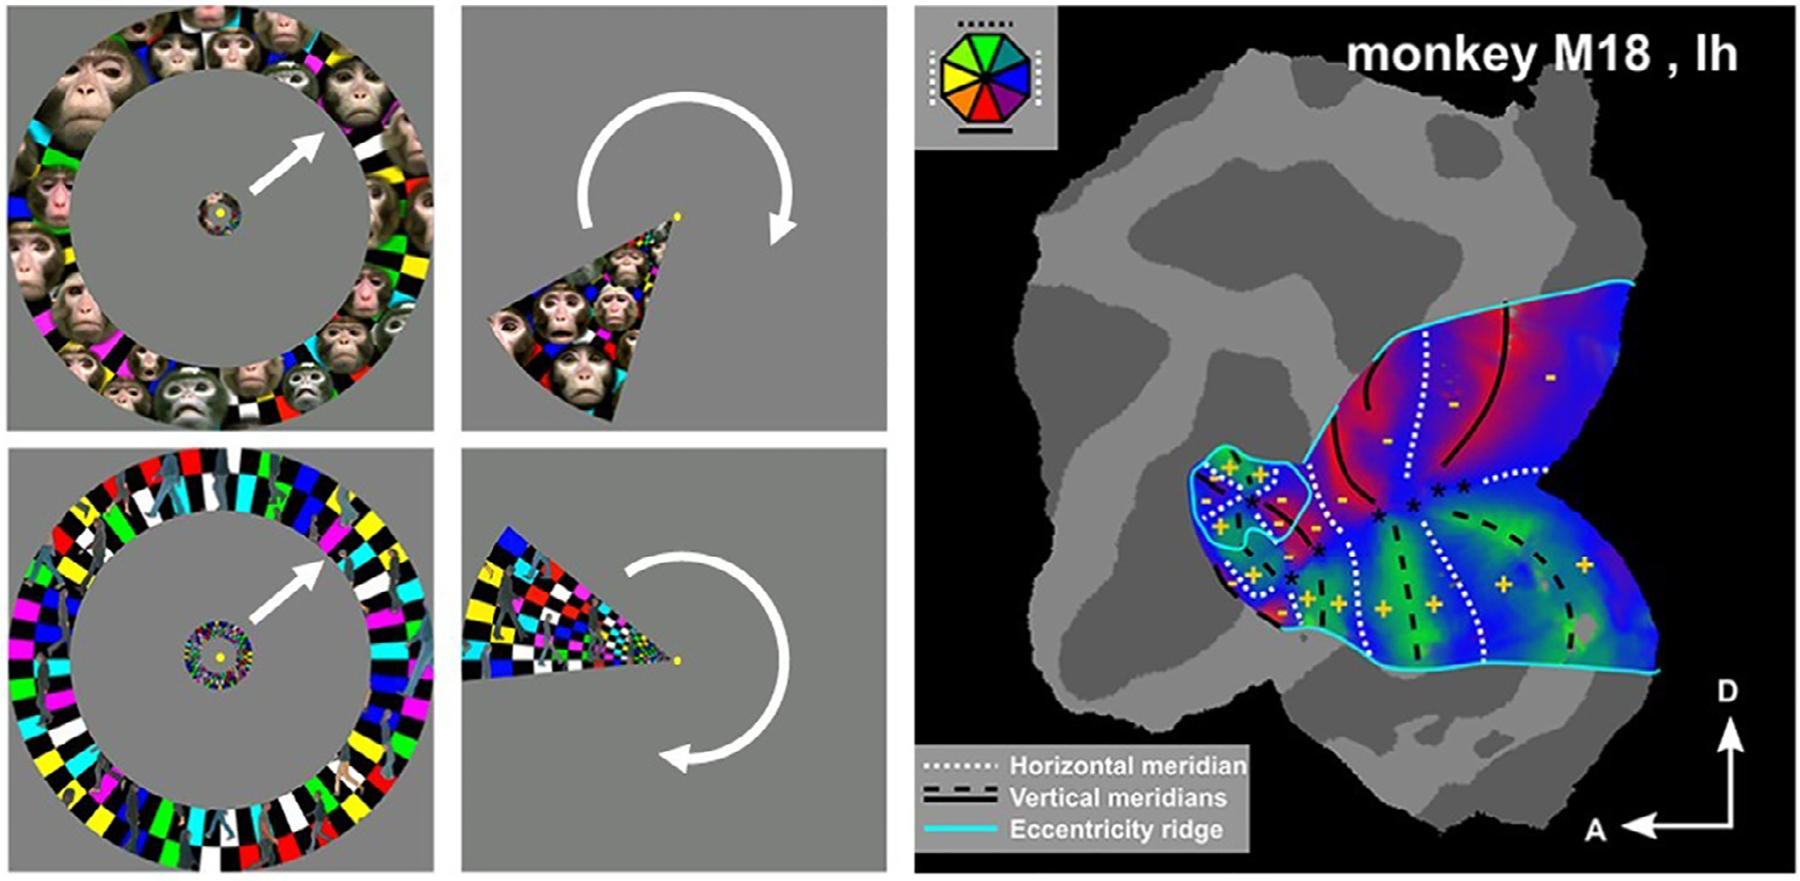
Phase-encoded visual retinotopic mapping rely on expanding/contracting annuli (left panels), clockwise/counterclockwise rotating wedges (middle panels). Stimuli (from Zhu and Vanduffel, 2019) can be flickering checkerboards or mixtures between flickering checkerboards and incorporated natural moving objects such as dynamic faces and walking subjects (left and middle panels). Such mapping results in a polar angle and eccentricity information from all voxels and a precise description of the retinotopic organization of the visual cortex (right panel; adapted from Vanduffel et al., 2014).
Motion Sensitivity.
As visual information proceeds along the visual pathway, the information that is processed within each region becomes more complex. One such form of information is visual motion. As with retinotopic mapping, a variety of relevant paradigms have been used to map the location of motion sensitive regions within the cortex of both NHPs and humans. The simplest form of a motion processing localizer involves the use of static versus moving dots in a standard block design format. The contrast of moving dots versus static dots reveals a robust set of activations within the early visual system that is composed of areas MT, MST, and VIP (Vanduffel et al., 2001). To localize more specialized motion-processing regions within the superior temporal sulcus and parietal cortex, one can use more complex motion stimuli including, for example, optic flow patterns and structure from motion stimuli (Nelissen et al., 2006; Sereno et al., 2002; Vanduffel et al., 2002). Other studies used a two (Kinematics: biological and translational) by two (Configuration: full and scrambled) stimulus matrix which allowed them to localize not just motion sensitive regions, but also the types of motion which the regions were responding to (Jastorff et al., 2012). They found that distinct portions within the motion sensitive regions of the posterior STS responded to different forms of motion. Rostral to MT, the kinematic and configural components of the stimuli were processed within distinct regions. These results highlight the strength of using more specific stimulus conditions to tease apart complex stimulus information.
Depth coding.
An important visual feature of our daily environment is how objects are organized in 3D space. This covers at least four distinct aspects. The first is how individual objects are organized in 3D, i.e. their three dimensional shape. Specific stereoscopic or 3D-structure from motion stimuli are used to identify distinct superior temporal and intraparietal regions activated by 3D object information (Durand et al., 2007; Sereno et al., 2002; Tsao et al., 2003b; Vanduffel et al., 2002). The second aspect of depth information is the relation of objects to each other in space. A monkey fMRI study comparing near or far depths defined by binocular disparity, relative motion, and their combination showed that area MT computes the fusion of disparity and motion depth signals, exactly as shown for human area V3B/KO (Armendariz et al., 2019). Such comparative studies are powerful means to link electrophysiological studies with human imaging. Specifically, this study reconciled previously reported discrepancies between depth processing in the dorsal stream of human and monkey. The third aspect is about where stimuli are in space relative to the subject. Cléry et al. (2018) have used ecological stimuli presented either far away from the subject or within 30 cm for the monkey’s head. Stimuli could either have the same real size or the same retinal size. Near stimuli provided a very specific and reliable functional identification of a core peripersonal space network composed of ventral intraparietal area VIP and premotor zone PMz (Cléry and Ben Hamed, 2018). The fourth aspect is about the processing of relative motion to the subject, contrasting optic flow stimuli, mimicking ego-motion, to 2D translational large field motion (Guipponi et al., 2013, 2015) or to multifocal optic flow stimuli (Cottereau et al., 2017). These studies identify specific cortical regions involved in the coding of ego-motion. Finally, imaging-based localization of intraparietal patches coding for depth structure can be targeted by electrophysiology, microstimulation or inactivations during fMRI. Such studies reveal effective connectivity patterns within the parietal cortex (Premereur et al., 2015) and between parietal and inferotemporal cortex (Van Dromme et al., 2016).
Overall, while one may think that the use of low-level visual localizers has exhausted what one can learn about the organization of the primate visual system, recent studies, either mapping a larger extent of the visual field (Rima et al., 2020) or using submillimeter fMRI (Zhu and Vanduffel, 2019), describe new retinotopic clusters in the macaque brain. Prime-DE/Prime-RE consortia are expected to foster such novel research avenues across research centers. Through the collaboration of multiple centers, we expect to discover new knowledge on the organization of early visual cortex and importantly on its individual variation in relation with both behavioral and genetic variability.
3.5. Low-level multisensory mapping
Our perception of our environment is most often based onto the combination of sensory information from multiple senses. Accordingly, converging evidence indicates that the brain is massively multisensory (Guipponi et al., 2015; Schroeder and Foxe, 2005). However, the exact network bases of multisensory perception are still poorly understood and systematic multisensory mapping localizers would be extremely helpful to gain a better understanding of these processes. For example, Guipponi et al. (2015) characterized, using visual and somatosensory fMRI mapping in the awake monkey, the cortical regions that respond to both large field visual stimuli and face or shoulder somatosensory stimulations. They report two main findings: The first, is the observation that visuo-tactile convergence spans a large portion of early visual striate and extrastriate areas, mostly those regions coding for the periphery of the visual field. This finding has been independently confirmed in another unpublished study (Armendariz et al., 2018). While there have previously been reports of a modulation of visual V1 single unit responses by auditory stimuli (Wang et al., 2008), these large somatosensory activations in the early visual cortex are a first demonstration of massive heteromodal modulatory influences in the primary visual cortex. The second observation is that the spatial organization of this visuo-tactile convergence, throughout the brain, is stimulus dependent. Areas responding to tactile face stimulations and static whole field visual stimuli do not fully coincide with cortical regions responding to tactile face stimulations and whole field optic flow stimuli, nor to regions responding to tactile shoulder stimulations and static whole field visual stimuli. Thus, the exact pattern of multisensory convergence is stimulus dependent. Guipponi et al. (2013) further probed multisensory convergence of visual, auditory and tactile information within the intra-parietal sulcus (Fig. 2A). This study identifies ventral intra-parietal area VIP based on its responsiveness to large-field dynamic stimuli. They show that only part of this larger VIP is responsive to tactile face stimulations and that only part of this visuo-tactile VIP is further responsive to auditory stimuli. This study clearly highlights the complexity of multisensory cortical brain organization. Importantly, it also highlights inter-individual differences, whereby one monkey has a unique bilateral intraparietal visuo-tactile convergence ROIs, while the other monkey has two such convergence ROIs (observation reproduced in other monkeys, Ben Hamed et al., personal communication).
Fig. 2.

The conjunction of multiple localizers allows to identify interindividual variations in cortical functional organization. (A) Projection of the (visual and tactile) and (visual, tactile and auditory) conjunction onto the left and right flattened intraparietal cortex of two monkeys M1 and M2. Limits of intraparietal areas LOP, LIPv, LIPd, VIPm, VIPl and AIP defined based on the F6 Caret atlas. Adapted from Guipponi et al., 2013). (B) Anterior and medial cingulate face fields defined by local maxima for reward, blink, saccade and tactile to the face and to the shoulder localizers. Adapted from Cléry et al., 2018.
The complexity of multisensory convergence patterns as well as inter-individual differences in this respect is apparent using low-level sensory localizers. Higher levels of complexity are expected for higher level sensory localizers. Fig. 2B represents the functional identification of cingulate face fields based on multiple localizers (reward, spontaneous blinks, saccades, tactile stimulations to the face and tactile stimulations to the shoulders, Cléry et al., 2018a). While the medial and anterior cingulate face fields can be identified in both monkeys bilaterally, all localizers did not activate all face fields, suggesting some degree of functional inter-individual differences.
Gaining a proper understanding of how multisensory convergence is organized across stimulus ranges and levels of complexity, while important to understand perception, cannot be carried out by a single lab. The Prime-DE/Prime-RE initiative is expected to be instrumental in providing simple multisensory localizers that can be run and parametrically varied in several labs, thus increasing both stimuli ranges and subject sample size.
3.6. High-Level features
The localization of high-level perceptual features is of great interest within the NHP neuroimaging community. In the following section, we will discuss the advantages and disadvantages of a few well-known functional localizers for high-level perceptual and cognitive features. The goal is not to cover all possible localizers but to highlight localizers that are fairly commonly used and how we may improve upon the current state of these localizers.
3.7. Face processing system
One of the most common localizers used in both human and NHP neuroimaging is a face processing localizer. Kanwisher et al. (1997) began the explosion of face localizer tasks with their discovery of a region of ventral aspect of the human temporal lobe, on the fusiform gyrus, that responded most strongly to faces over other stimuli. This discovery has led to both a large body of literature investigating face processing within the human cortex, and a fair bit of controversy (Gauthier et al., 2000; Haxby et al., 2001). Not long after the discovery of the fusiform face area, Tsao et al. (2003a) used a similar face localizer paradigm in the macaque monkey. They found not a single face region but instead discovered what has come to be known as the face patch system consisting of five to seven regions along the temporal lobe.
As with the low-level localizers discussed earlier, face localizer tasks have tended to fall into one of two categories, block designs or event-related designs, with a majority using block designs. The issue that arises when targeting the localization of high-level features is exactly what comparison will best localize a given feature. There has been considerable debate within the field about what set of stimuli are best used for precise localization of the face-selective regions (Bell et al., 2011; Ku et al., 2011; Pinsk et al., 2005a; Premereur et al., 2016; Russ and Leopold, 2015; Tsao et al., 2008a). The main set of categories that have been used are conspecific faces, and/or human faces, versus objects, scenes, and phase scrambled versions of faces. Each category provides a distinct form of comparison and control. The field has generally agreed that the comparison of faces and any of the other categories provides a fairly accurate mapping of face responsive regions within the cortex, and temporal lobe in general. However, face-selective regions are often defined as a subset of that space which are best localized by the comparison of faces and objects (see Popivanov et al., 2012 for comparison across these conditions).
Similar to face localization, a number of other categories of stimuli have been shown to activate particular regions within the NHP cortex (Bao and Tsao, 2018; Lafer-Sousa and Conway, 2013; Pinsk et al., 2009; Popivanov et al., 2014, 2012). In particular, researchers have shown that in conjunctions with the network of face patches, there are corresponding, usually connected regions that respond more to body parts than objects (Pinsk et al., 2005a, 2009; Popivanov et al., 2012, 2014). These regions often overlap face-selective regions but are significantly larger. As with the face-localizer tasks, they are mapped using a similar localizer of body parts, either full animal images or isolated limbs, and inanimate objects. A well-controlled localizer for both faces and bodies, in which low-level image characteristics (aspect ratio, mean luminance, contrast, surface area) were equated as much as possible across different object classes, was used in a study by Popivanov et al. (2012). This localizer consists of 10 categories (monkey bodies, human bodies, mammals, birds, monkey faces, human faces, body-like sculptures, fruits/vegetables, and two sets of control objects), and one scan session is typically sufficient to reliably identify all the face and body patches consistent with previous localizers (Bell et al., 2011; Ku et al., 2011; Pinsk et al., 2005a; Premereur et al., 2016; Russ and Leopold, 2015; Tsao et al., 2008a), as well as object-processing regions within monkey cortex.
The use of multiple localizers can provide further validity and robustness to the discovery of a particular feature. For example, there are numerous paradigms that have localized face, body, scene selectivity across labs (Tsao et al., 2003; Moeller et al., 2008; Moeller et al., 2009; Freiwald et al., 2009; Russ and Leopold 2015; Popivanov et al. 2014; Janssens et al. 2014; Koyano et al., 2021). By and large, major category-selective areas/patches, are surprisingly well reproducible across sites and tasks (e.g. discussed in Vanduffel et al., 2014 and shown in Janssens et al., 2014). This is also illustrated in the data presented in Fig. 3B. Here we have combined face selective responses across 5 animals who participated in one of three tasks: face vs scrambled images (block design), face versus objects (block design), or a naturalistic movie free-viewing task processed with a face regressor. These individual animals were all mapped to the common NMT-template (Seidlitz et al., 2017) and plotted on the NMT surface maps along with the probabilistic face-responses generated from Janssens and colleagues (2014). As can be seen, in general, all the subjects and the probabilistic maps are overlapping to a significant degree with each other along the temporal lobe. However, there are also substantial individual differences in the exact location of the face-responsive regions. These differences are likely a result of both true individual differences, measurement errors, and differences in behavioral performance (e.g. fixation performance). The use of convergent paradigms across sites and within individuals can help to elucidate how much of these errors can be truly linked to individual differences in the functional organization of the brain.
Fig. 3.

A) Number of blocks for estimating the location of the face patches. Subject participated in multiple sessions, with multiple runs per session, of a block design experiment (intact faces versus phase scrambled faces; data from Russ and Leopold, 2015). T-values were calculated for an increasing number of blocks within predefined face selective regions (14) and visually responsive regions (10). Mean and standard deviation of the calculated t-value for each set of blocks is displayed. A representative t-map for 4 sets of blocks are shown above. B) Mapping of face selectivity: comparison across research centers and tasks. NHP 1–5 were collected animals on the 4.7T Bruker Vertical bore at the National Institutes of Health. Three face-processing localizers were used, a Face/Objects (NHPs 1 and 2), Face/Scrambled images (NHP 3 and 4), and Face Regressor in a movie (NHP 5) (data from: Russ and Leopold 2015; Koyano et al., 2021; McMahon et al., 2015). In addition, the probabilistic face-selectivity maps from Janssens and colleagues (2014) is mapped to show the overlap between single subjects and the maps generated from separate subjects collected at 3T.
Based on the extensive literature available, we believe that the best way forward for standardizing the localization of face responsive regions is to employ a block design that incorporates 6 separate categories of stimuli: conspecific faces and bodies, objects, and hetero-specific mammals, birds, and plants (see box 2 for link to stimuli). Pseudo-randomization of these blocks across 10 min of imaging would provide a good estimation of face responsive and face-selective regions within the population. Fig. 3 describes, on empirical data, t-value scores as a function of number of collected blocks in a predefined face patch. Note that the more blocks are collected, the more face patches are identified.
3.8. Object processing
On the flip side of both body and face localizers, it is possible to compute the inverse contrast highlighting regions that respond more strongly to objects compared to faces and/or body parts (Bao and Tsao, 2018; Bell et al., 2009, 2011). Previous research has shown that regions outside of the face and body areas respond more strongly to objects than biological stimuli regions (Bell et al., 2011; Pinsk et al., 2005a, 2009; Popivanov et al., 2012, 2014). These responses can be further broken down into more distinct regions depending on the particular set of stimuli and contrast used.
Of particular note, modulating the amount of color present within the stimulus set has revealed a set of color responsive patches that mirror, but are ventral to, the face patch system (Lafer-Sousa and Conway, 2013). The presence of these color patches, in conjunction to the face patches, have put forth the hypothesis that the ventral visual system is organized into sets of interconnected streams that specialize in particular stimuli (Bao et al., 2020; Conway, 2018; Premereur et al., 2016).
3.9. Voice localizers
One often-used localizer in human neuroimaging is the ‘Voice Localizer’ contrasting vocal (speech and non-speech) vs non-vocal sounds to localize the temporal (TVAs) and frontal (FVA) voice areas (Pernet et al., 2015). Because it does not focus on (uniquely-human) speech, but on voice (conspecific vocalizations), this localizer can be transposed to macaque fMRI (Joly et al., 2012a). Petkov et al. (2008) contrasted macaque vocalizations to nonvocal sounds and identified at least one anterior ‘voice patch’, later shown to contain between 25 and 55% of voice-selective neurons. Experience with the human voice localizer suggests that the voice/non-voice contrast is so strong that it only requires a small amount of stimulation and can be achieved in less than 10 min as an fMRI localizer. Such a contrast of vocalizations versus other sounds could potentially also be used in macaques to localize primary auditory regions within a single localizer task (cf. section on low-level localizers).
The contrast of the voice versus non-voice conditions will identify several areas in the temporal, and even frontal cortex, that show sensitivity to the voice set of stimuli. This is analogous to the face versus non-face visual localizer (Freiwald et al., 2009; Tsao et al., 2008b). For instance, one could use a set of different vocalizations from the same and different individuals. Then the stimulation could be different vocalizations from the same individual or the same vocalization from different individuals (Belin and Zatorre, 2003). Many auditory areas will respond to the acoustical difference of different vocalizations from the same individual, but some areas preferentially respond to vocalizations from the different individuals (who vocalized rather than what was vocalized (Petkov et al., 2006). Identity-specific stimulation seems to involve more anterior temporal lobe regions (Perrodin et al., 2015). A link to a voice localizer can be found in box 2.
3.10. Movies (a.k.a. naturalistic materials)
One potential avenue for obtaining multiple functional localizers from a single task is the use of naturalistic movies. Naturalistic movies by definition have a large number of superposed features that, if taken into account, can provide functional localizers for both low-level perceptual features, including low-level retinotopic maps (Nishimoto et al., 2011), and high-level semantic/cognitive features (Huth et al., 2012; Mantini et al., 2013, 2012a, 2012b; Russ and Leopold, 2015; Sliwa and Freiwald, 2017). In fact, the use of naturalistic movies has increased significantly in the last decade as both human and animal research has seen the potential of using these less constrained but more ethologically relevant stimuli (Gao et al., 2020). Just within NHPs, naturalistic movies have been used to localize low-level visual features such as contrast, luminance, and motion responses (Russ and Leopold, 2015), face specific responses (Russ and Leopold, 2015; Sliwa and Freiwald, 2017), eye-movement related signals (Russ et al., 2016), cross-species functional homologies (Mantini et al., 2013, 2012a; 2012b), and social processing (Sliwa and Freiwald, 2017). The use of a naturalistic movie set to localize features, such as the face processing system, can be particularly useful as it requires no experimental training (Russ and Leopold, 2015), whereas standard visual localizers usually require the subjects to maintain fixation within a small fixation window (Pinsk et al., 2005b). Removing these training requirements can drastically reduce the need for additional behavioral training and provide quick functional localizations of a variety of features.
Challenges and analytical approaches of using movies as localizers:
These studies have highlighted the use of naturalistic movies as an effective method for localizing all manner of functional domains using a variety of analytical methods. Traditionally, the two main methods currently employed for localizing function with naturalistic movies are: 1) regression models based on the coding of particular features; and 2) inter-subject correlation methods where the stimulus is used as a common driver of neural activity. Given the complexity of movies as localizers, a number of more recently developed methods also warrant mentioning.
Regression models
Regression models for naturalistic movies have provided relatively good localizers for a variety of features. Although the exact nature of the regression model varies between studies, the main component of each method remains constant. An algorithmically or user-defined feature vector is extracted from the movie and then compared to the fMRI activity. Some studies have used short movies to target particular variables. For example, Sliwa et al. (2017) used a set of short movies with particular social interactions, a method very similar to a standard block design, to localize regions of the macaque cortex that are preferentially associated with social processing. Like the more standard functional localizers discussed above, these study designs have the benefit of controlling for variables of no-interest and isolate the desired feature. However, by controlling for all these features they may lack the ability to localize any feature not specifically designed to be tested for.
A complementary method for using naturalistic movies is to use longer movies that allow for a variety of different features to be present at any given moment. Mantini et al. used three 30-minute video fragments (2012b), and Russ and Leopold (2015) used a set of fifteen 5-minute movies that contained multiple visual features superposed. A downside of these less constrained movies (independently of their length) is that any particular feature may be correlated with other features of interest in your regression model, thus potentially violating assumptions of independence between variables. Luckily, there are numerous methods to clean these correlations up, such as ridge regression, stepwise regressions, principal components analysis (PCA), and partial correlations, to name a few (Draper and Smith 1998). Each method provides a particular trade-off when attempting to reduce or remove correlations between variables. For example, partial correlations and stepwise regressions both implement an ordered regression where variance is attributed to one variable before other variables are considered. This removes the potential for shared variance, but can inappropriately attribute variance to the wrong variable depending on the order they enter into the model. PCA, on the other hand, can help to reduce issues of independence by first creating a new set of variables that are orthogonal to each other by combining variables together. However, the new variables that are created may not map specifically onto a particular feature of interest.
As mentioned with each of these methods, a trade-off is made to try to minimize the effects of collinearity between the variables. Russ and Leopold (2015) used a stepwise regression approach in which up to 21 different visual feature models were submitted. They could reliably map the functional localization of a variety of the visual features based on the stimulus models such as: the location of contrast sensitive early visual regions; motion sensitive regions, such as MT and MST; and the face patch system (Bell et al., 2011; Freiwald et al., 2009; Pinsk et al., 2005a; Premereur et al., 2016; Tsao et al., 2008a, 2003a). As was discussed above, the localization of the face patch system has been explored by a number of labs and represents a reliable localizer across groups and animals. Russ and Leopold (2015) found that the face feature model extracted from their naturalistic movie set produced a near identical set of patches compared to an independently run face processing localizer. Additionally, they were able to localize the face patches with only 15 min of naturalistic viewing.
Recent advances of the deep learning approaches:
Beyond the afore-mentioned methods, recent advances in convolutional neural network (CNN) and deep learning methods also provide important insights into how to best leverage the visual complexity embedded in naturalistic viewing paradigms. Bao et al. (2020) made use of a deep network (AlexNet) that is trained on object classification to identify an object space network in the monkeys’ inferotemporal cortex. In fact, these deep learning approaches have also been used previously to explain variance of cortical activity in humans while they watch natural-videos. For instance, Wen et al. (2018) used a deep CNN, trained with supervised learning for image recognition, to form a model of visual cortex’s feed-forward neural computation. Han et al. (2019) developed a variational auto-encoder that could predict and decode cortical activity observed with fMRI from a viewing experiment in humans. However, while these CNNs can predict cortical representations across most levels of visual processing, their application to the modeling of higher cognitive processing that are inherent in movies (such as storyline, social saliency, and plots) remains a challenge.
Functional Alignment through Hyperalignment:
An important assumption in neuroimaging studies is that each subject’s brain responses to the same information are the same across subjects. However, there is a wide variation in each individual’s neuroanatomy. As a result, a critical step is to normalize each subject’s responses into a common ‘functional’ space. This improves cross-subject comparisons and thus the exploitation of a common movie localizer. To address these issues, a class of algorithms, which is collectively termed as hyperalignment (or functional alignment), have been developed. For example, response-based hyperalignment uses an iterative Procrustes transform to scale, rotate, and reflect voxel time series so that they are in the same functional space across participants (Guntupalli et al., 2016; Haxby et al., 2011; Taschereau-Dumouchel et al., 2018). Take Guntupalli et al. (2016) as an example, their hyperalignment model was able to account for individual variability of coarse-scale topographies, such as retinotopy and category selectivity, which can produce better classification performance for movie segments than models that are based on standard anatomically aligned features across occipital, temporal, parietal, and prefrontal cortices. A second approach known as Shared Response Model, which learns a joint singular value decomposition (joint-SVD) and can project subjects into a lower dimensional common space (Chen et al., 2014, 2015).
Inter-subject activity correlation:
The inter-subject correlation method has been used extensively in human subjects research to investigate a number of functional topics ranging from temporal processing, memory, and face processing (Chen et al., 2015, 2017; Hasson et al., 2012, 2008, 2004; Nguyen et al., 2019; Regev et al., 2013). A recent review of inter-subject correlation studies was published highlighting its many uses (Simony and Chang, 2020). However, this approach has not been used on a large scale in NHP imaging studies, mostly due to a need for a larger number of subjects than are used in a typical awake NHP neuroimaging study. Mantini et al. (2012b), however, have demonstrated its potential applications in NHP. In this study, humans and NHPs both watched the same Hollywood movie (The Good, the Bad, and the Ugly). The authors then used inter-species activity correlation (ISAC) to investigate functional homologies across species. They found that while many primary sensory cortical regions remain preserved across species, a number of higher-order processing regions appear to differentially move between the two species, in a manner not simply consistent with cortical expansion. Expanding on these methods with large groups of NHP subjects viewing more ethologically relevant stimuli has the potential to expand our understanding of inter-subject cognition similar to the current results coming from human research. Moreover, it will provide a unique opportunity to investigate functional homologies across primate species in a completely data-driven manner.
Inter-subject beta correlations:
The inter subject correlation method has recently been complemented by a data-driven inter-subject beta-correlation approach whereby beta-coefficients across subjects of the same species, or even across species (coined inter-species beta correlations, ISBC) can be compared (Caspari et al., 2018). For an ISBC analysis, one first performs a regular GLM analysis on the two independent fMRI data sets acquired in the two species. This analysis will yield beta-values for each voxel and for each condition of a specific paradigm. This results in a fingerprint of beta values for each voxel, and the more conditions, the more informative the fingerprint. Subsequently, one can perform a voxel-to-voxel correlation analysis of these beta-fingerprints across species. Alternatively, one averages all the beta-fingerprints of all voxels within an independently defined ROI of one species, and correlate the average beta-fingerprint of the ROI with those of all voxels in the other species. This approach is different from ISAC because it circumvents the timing issues when the timing of different trials and sub-trial components might not be synchronized across subjects. For example, when the animal is engaged in a task whereby the pace of trials is determined by task performance, the ISAC procedure cannot be used. For example, Caspari et al. (2018) used the ISBC approach to compare shifts of selective spatial attention between humans and monkeys. In such experiments, the timing of different trials and sub-trial components can be completely de-synchronized across subjects, hence the ISAC approach is useless. The ISBC approach, whereby the beta coefficients obtained in one species are correlated with those in the other species, showed that specific regions within the superior parietal lobe are engaged during shifts of spatial attention. The richer the set of beta values (i.e. the more conditions in an experimental paradigm), the more powerful the ISBC approach, provided that there is enough contrast-to-noise ratio for each of the individual conditions -i.e. the signal-to-noise ratio (SNR) of the modulated signal. The same approach can be used both for within and across-species comparisons using natural movie designs, but also in regular well-controlled block or event-related designs.
Inter-subject representational similarity analysis:
However, one problem with ISAC is the fact that it operates at the level of subject pairs, while behaviors (responses to movies) operate at the individual subject level. It has been recently proposed that we can take a subjects-by-subjects ISC matrix as a “brain similarity ” matrix, and then construct a “behavioral similarity” matrix and use representational similarity analysis (RSA) to identify brain regions where subjects who are more similar in their behavior are also more similar in their neural response (Finn et al., 2020). Each viewer is associated with both behavioral scores (if any) and a pattern of brain activity (e.g., time series data from a region of interest during movie-viewing). Weighted graphs obtained from similarity matrices can then be computed, compared and tested statistically pairwise (i.e., subject-by-subject), using IS-RSA. However, this analysis method is not only specific to movie paradigms, it is well suited for any paradigm that involve behavioral data and can be applied to detect shared structure between brain data and behavioral data (Bacha-Trams et al., 2018; Chen et al., 2020; Gruskin et al., 2020; Jääskeläinen et al., 2016; Mantini et al., 2011; Nguyen et al., 2019; Nummenmaa et al., 2012; Saalasti et al., 2019; Tei et al., 2019; van Baar et al., 2019). As for the ISAC and ISBC tools, the inter-subject representational similarity analysis can also be extended to compare activity patterns across species. For example, the inter-species representational similarity method has been used to provide data-driven evidence for linking the different face patches in humans and monkeys (Zhu et al., 2015).
Automated annotations & automated feature extraction:
Complex stimuli pose serious practical challenges to analyze. Manual annotation is effortful and time consuming, whereas crowd-sourcing effort (Wang et al., 2020; Zuo et al., 2020) still might not capture the wide range of perceptual dynamics embedded in the stimuli. Recent progresses in machine learning algorithms have however automated the process of rapidly an-notating multi-modal stimuli. Extracted features include low-level perceptual features (such as brightness and loudness), to complex, semantically relevant features such as predictions from state-of-the-art language comprehension models (Kuperman et al., 2012; Warriner et al., 2013). The time courses of these extracted features can then be entered as regressors in the analysis (see section on “ Regression models” above).
Finally, we should remark that the exceptionally low training requirements and the potential to map multiple features from one task make naturalistic movies a potentially ideal method for obtaining functional localization over large cohorts (see also Leopold and Park, 2020). However, while the current set of movies that are available have worked for some features, they do not work for all relevant features. For example, the movies used in Russ and Leopold (2015) contained no auditory stimulus, and specific behaviors were sparsely represented making any attempt at specific behavioral coding underpowered. Additionally, the movies (audiovisual stimulation in this case) used in Mantini et al. (2012b) were selected for their interest to human subjects, thus they contained human faces, voices, and interactions. While macaques and humans do attend to many of the same features in movies, their viewing patterns diverge significantly during particular types of social interactions (Shepherd et al., 2010).
A particularly interesting movie which alleviates at least partially these concerns shows a combination of highly social monkey behavior both in natural as well as man-made settings. Moreover, this movie is currently being used by several monkey and human imaging laboratories (‘Monkey Kingdom’, Disney, Fig. 4) with the goal to perform the intra- and interspecies comparisons as discussed above. Initial results show that monkeys are paying significant attention to the movie. A detailed description of the stimuli is provided on the PRIME-RE resources page (see Box 2). The use of the same movie fragments in different NHP species, including humans and marmosets, may serve as an easy and powerful localizer as argued above and facilitate functional homology research.
Fig. 4.

Monkey Kingdom: Four snapshots of the movie localizer “Monkey Kingdom”, released by Disney. The movie contains images of monkeys, humans, actions, social behavior, man-made and natural objects and scenes. The movie is entertaining for humans and attracts attention of monkeys and is currently used in several human and non-human imaging laboratories for cross-species homology research. For details see Box 2 and wim.vanduffel@kuleuven.be.
3.11. Cognitive localizers
Beyond the low-level and high-level sensory localizer described above, specific cognitive functions can also be mapped using fairly easy to implement localizer tasks. Collecting such data on as large as possible as NHP groups would be crucial in order to start and tackle the origins of inter-individual cognitive variability, be it in correlation with genetic or behavioral data.
It should be noted, that cognitive localizers in general will often require significant amounts of behavioral training prior to be implemented within a neuroimaging paradigm. Cognitive localizers often require the subjects to not only fixate, and/or hold a lever, but to learn task rules that must be applied to novel stimuli. While NHP are more than capable of learning multiple rule sets and applying them appropriately within different tasks (Buschman et al., 2012; Premereur et al., 2018), the training of these behaviors can take months depending on the complexity of the task.
3.12. Attention
Regions involved in selective spatial attention can be localized using straightforward covert attention paradigms whereby the subjects fixate centrally while two stimuli, the attended target stimuli and the distractor stimulus) are presented in opposite hemifields. Animals are instructed, using either symbolic or external cues, to attend the target stimuli and ignore the distractor. Changes in stimulus appearance of the attended stimulus (such as a short change in luminance) have to be detected to have a behavioral assessment of the animal’s allocation of spatial attention. Changes of the distractor stimulus have to be ignored. Variations on these approaches have been successfully used by several groups and provided attention-selective activations in the dorsal and ventral attention networks in addition to visual cortical and subcortical regions in which sensory processing is purportedly modulated by the attention signals (Arsenault et al., 2018; Bogadhi et al., 2018; Caspari et al., 2015, 2018; Stemmann and Freiwald, 2016, 2019). These studies reproducibly show a contralateral modulation of visually-driven activity by covert selective spatial attention (Fig. 5). In prior NHP studies, typical search tasks, in which a target needs to be detected amongst distractor, have also been used to identify typical attention regions (Wardak et al., 2010).
Fig. 5.

Contralateral modulation of visually-driven activity by covert selective spatial attention. Flattened and inflated cortical representations of the left and right hemispheres showing contralateral modulation of fMRI activity induced by covert attention to either the right (left panels) or to the left (right panels) while monkeys fixate to a central fixation spot. Areal boundaries are indicated by white outlines. T-score maps are shown in hot colors (right versus left attention for the left hemisphere and vice versa for the right hemisphere). The cortical representations of the stimuli are shown in green, and were obtained in independent sessions, without directed attention to the stimuli. Figure adapted from Caspari et al., 2015, where also the experimental details are described.
3.13. Extracting structure and regularities
Other localizers can be used to identify cortical regions that contribute to the extraction of structure and regularities in the environment. For example, an auditory sequence of the type AAAB (compared to the type AAAA) represents a first order (local) structure violation. Uhrig et al. (2014) show that such violations are primarily encoded in the auditory cortex. In contrast, an auditory sequence of the type AAAA (or AAAB) embedded in auditory sequences of the type AAAB (or AAAA) represents a second order (global) structure violation. Uhrig et al. (2014) show that such violations are encoded in a monkey fronto-parietal network, as is the case in humans. Both these first order and second order sequence effects are disrupted by propofol or ketamine anesthesia (Uhrig et al., 2018). More complex localizer of structure and regularity extraction can also be used. For example, the violation in the number of expected auditory tones in a sequence activates the monkey ventral intraparietal sulcus and dorsal premotor area, while higher order sequence violation (in expected number and tone) activates the inferior frontal and superior temporal regions (Wang et al., 2015). The theoretical value of such localizers lies in the fact that such structure and regularity prediction violation localizers allow one to probe the neuronal networks that subserve human specific functions such as language, music and mathematical understanding and production (Jiang et al., 2018). Importantly, this type of localizers requires only minimal animal training and can be complexified along multiple sensory and/or abstraction dimensions.
3.14. Decision making
Decision making tasks take considerably more behavioral training than many of the other localizers discussed in this manuscript. With that said, a few groups have shown that both within humans and macaques, it is possible to localize regions involved in particular aspects of the decision making process (Noonan et al., 2012). Within the macaque, decision making localizers have focused on defining regions of the prefrontal and limbic system that are involved in learning and reward assignment (Arsenault et al., 2013; 2014; Chau et al., 2014; 2015; Kaskan et al., 2017; Wittmann et al., 2020). These experiments by necessity are run using event-related designs, which can have a major impact on signal-to-noise ratios particularly in NHPs (Pelekanos et al., 2020). However, even taking these issues into account, the resultant studies have helped to define a number of hubs within the frontal and limbic system that preferentially code for particular aspects of the task that were run. For example, Chau et al. (2015) used an object discrimination reversal task to probe how the obito-frontal cortex (OFC) and amygdala were differentially recruited during the learning and reward assignment phases of the task. After initial training, the subject participated in sets of object discrimination trials where reward values remained consistent. After a set number of trials, the reward contingencies would shift, and the subjects had to relearn the best options. They found that the coupling of amygdala and OFC activity was highest during trials in which the subjects had gotten the last trial wrong and then shifted their responses, and this coupling was modulated by how reward should have been assigned based on the block information. The use of similar types of tasks and experimental designs can help to elucidate targets for future invasive studies to see how neurons within these coupled regions interact with each other. These types of tasks are expected to demonstrate high levels of inter-individual variability, a question that single labs cannot address. Although data sharing for this type of localizers can turn out to be more challenging than sensory localizers, this should still be considered a high priority for the NHP imaging community.
Conclusion
It would greatly benefit the monkey research community if several universal localizers could be acquired on as many individual subjects and in as many laboratories as possible. Not a single group is in a position to acquire data from a single localizer, or using a single experimental paradigm in large numbers of animals. Therefore, the only means to achieve population-based statistics in NHPs, as is now the standard for the human imaging community, is to spread the efforts across many research groups. In the present manuscript, a number of relatively straight-forward localizers are proposed, some of them which can be acquired without too much training of the subjects and in relatively short periods of time. In order to increase the efficiency of meta-analyses based on such multi-center localizer data, important experimental aspects should be considered. These are described in detail in Box 2. Box 2 additionally described several sets of functional localizers that are being shared with the community and provides a link to the data repository where they can be downloaded. This repository is dynamic and should be populated with more localizers from anyone in the NHP imaging community, each linked to an individual DOI (see below).
Such large-scale data sharing initiative as foreseen here raises multiple important issues that will need to be addressed collectively. A first aspect pertains to data sharing format. Raw data and metadata can be shared. Alternatively, preprocessed ready to analyze data (or individual activation maps) and metadata can also be shared, as well as basic quality indicators (Milham et al., 2018). Towards this end, members of the PRIME-DE initiative has worked toward integrating NHP results into the already widely used NeuroVault repository (Fox et al., 2021) and EBRAINS. NeuroVault has been used extensively to aggregate results across human imaging studies. With the adoption of similar results sharing among NHP researchers, the ability to compare results across groups, institutes, and studies will be significantly accelerated. Several initiatives are ongoing to facilitative this data sharing process. For exemple some groups aim at registering NHP data to a common template interchangeable with all currently available parcellation schemas. A second aspect pertains to the availability of shared data analyses pipelines for the most basic analyses. This would encourage multiple centers to engage into the analysis of this shared data while at the same time fostering result replication. A third aspect pertains to data ownership. Like considered for the localizer stimuli shared in the present paper, the dataset could be identified by a data DOI acknowledging all contributors to the data. A fourth aspect pertains to whether the different groups sharing the data get acknowledged as authors on the scientific contributions exploiting this data. This is a complex issue that deserves consideration. While some might consider that the data DOI is sufficient acknowledgement, authors might argue that data analysis is fully dependent on the data collection effort. Human neuroimaging data sharing is clearly ahead of monkey neuroimaging data sharing. Whether the former can serve as a model for the latter or whether the latter has its own specificities is a matter of discussion. In the specific case of localizer data sharing, the fact that some centers will be collecting the data exclusively for data sharing purposes needs to be singled out and might argue in favor of an explicit acknowledgement on initial publications. A last aspect is the possible divergence in ethical standards and legislations across centers contributing to the data set. While a strong effort worldwide is manifest to increase and homogenize these standards and improve animal well-being in science, regulations can substantially vary across countries (Mitchell et al., this issue), and this has raised concerns from some funding agencies and scientific publishers. At minimum, each shared data should be clearly identified by its specific ethical project authorization.
As larger cohorts of animals start to participate in experiments across multiple sites, it would be highly beneficial to acquire blood samples for genetic analysis. Other more trivial experimental details such as weight, gender, date and hour of data acquisition, housing conditions should be accurately logged as they may provide additional insights in the results. Although not feasible for many sites, additional physiological measures such as respiration and heart rate, but also body motion could add useful information in the analyses and for the interpretation of the results. Some automated video-based heart rate tracking are now available and could be used across centers (Froesel et al., 2020).
Contrary to the human imaging community, it is difficult to obtain data from many single subjects in a single laboratory. However, given the challenging nature of NHP experiments, subjects are typically much better trained to perform a task and much more data can be obtained in single subjects compared to human experiments. Hence by combining forces across research centers, it should be possible to obtain imaging data comparable to those in multi-center human imaging consortia such as the HCP and to considerably move forward brain science in general.
Supplementary Material
Acknowledgements
SBH was support by fundings from the French National Research Agency (ANR) ANR-16-CE37-0009-01, ANR-18-CE37-0022-02, ANR-18-CE92-0048-01 and European Research Council Horizon 2020 ERC Brain3.0 #681978. WV was supported by Fonds Wetenschappelijk Onderzoek-Vlaanderen (FWO) G0D5817N, G0B8617N, G0C1920N, G0E0520N, VS02219N; and the European Union’s Horizon 2020 Framework Programme for Research and Innovation under Grant Agreement No 945539 (Human Brain Project SGA3) (W.V). BER was supported by funding from NIH BRAIN Initiative Grants R01-MH101555 and RF1MH117040. PB was supported by grants ANR-16-CE3760011601, ANR-18-CE37-0022-02, and European Research Council (ERC) grant ERC-17-ADG-788240 COVOPRIM. SCK was supported by the Science and Technology Commission of Shanghai Municipality 201409002800 and a National Natural Science Foundation of China General Program grant 32071060. CIP was supported by Wellcome Trust (WT092606AIA); European Research Council Horizon 2020 (ERC CoG, Consolidator Grant, MECHIDENT 724198); and the National Institutes of Health (with Matthew Howard III: R01-DC04290). QZ was supported by Fonds Wetenschappelijk Onderzoek-Vlaanderen (FWO) G0C1920N and CEA PE bottom up 2020 (20P28).
Footnotes
Data sharing statement
The current manuscript is a review article, therefore the is no new data or code that went into the production of the current manuscript. However, one goal for the current manuscript is the creation of a localizer database. With that in mind, seven localizers have been shared with the community through data sharing websites (Zenodo, PRIME-RE, and OSF), these experimental stimuli and paradigms are described in the manuscript and Supplementary Material.
Declaration of Competing Interest
The authors declare no competing interests.
Supplementary materials
Supplementary material associated with this article can be found, in the online version, at doi:10.1016/j.neuroimage.2021.118203.
References
- Abassi E, Papeo L, 2020. The representation of two-body shapes in the human visual cortex. J. Neurosci. Off. J. Soc. Neurosci 40, 852–863 10.1523/JNEUROSCI.1378-19.2019. [DOI] [PMC free article] [PubMed] [Google Scholar]
- Alizadeh A−M, Van Dromme I, Verhoef B−E, Janssen P, 2018. Caudal Intraparietal Sulcus and three-dimensional vision: a combined functional magnetic resonance imaging and single-cell study. Neuroimage 166, 46–59 10.1016/j.neuroimage.2017.10.045. [DOI] [PubMed] [Google Scholar]
- Amiez C, Neveu R, Warrot D, Petrides M, Knoblauch K, Procyk E, 2013. The location of feedback-related activity in the midcingulate cortex is predicted by local morphology. J. Neurosci 33, 2217–2228 10.1523/JNEUROSCI.2779-12.2013. [DOI] [PMC free article] [PubMed] [Google Scholar]
- Amiez C, Sallet J, Hopkins WD, Meguerditchian A, Hadj-Bouziane F, Ben Hamed S, Wilson CRE, Procyk E, Petrides M, 2019. Sulcal organization in the medial frontal cortex provides insights into primate brain evolution. Nat. Commun 10, 3437 10.1038/s41467-019-11347-x. [DOI] [PMC free article] [PubMed] [Google Scholar]
- Amiez C, Wilson CRE, Procyk E, 2018. Variations of cingulate sulcal organization and link with cognitive performance. Sci. Rep 8, 13988 10.1038/s41598-018-32088-9. [DOI] [PMC free article] [PubMed] [Google Scholar]
- Arcaro MJ, Livingstone MS, 2017. A hierarchical, retinotopic proto-organization of the primate visual system at birth. Elife 6 10.7554/eLife.26196. [DOI] [PMC free article] [PubMed] [Google Scholar]
- Arcaro MJ, Schade PF, Livingstone MS, 2019. Body map proto-organization in newborn macaques. Proc. Natl. Acad. Sci. U. S. A 116, 24861–24871 10.1073/pnas.1912636116. [DOI] [PMC free article] [PubMed] [Google Scholar]
- Armendariz M, Ban H, Welchman AE, Vanduffel W, 2019. Areal differences in depth cue integration between monkey and human. PLoS Biol 17, e2006405 10.1371/journal.pbio.2006405. [DOI] [PMC free article] [PubMed] [Google Scholar]
- Armendariz M, Mantini D, Vanduffel W, 2018. Multisensory data-driven modeling of fMRI responses across primate species. Present. Soc. Neurosci 2018 San Diego USA. [Google Scholar]
- Arsenault JT, Caspari N, Vandenberghe R, Vanduffel W, 2018. Attention shifts recruit the monkey default mode network. J. Neurosci. Off. J. Soc. Neurosci 38, 1202–1217 10.1523/JNEUROSCI.1111-17.2017. [DOI] [PMC free article] [PubMed] [Google Scholar]
- Arsenault JT, Nelissen K, Jarraya B, Vanduffel W, 2013. Dopaminergic reward signals selectively decrease fMRI activity in primate visual cortex. Neuron 77, 1174–1186 10.1016/j.neuron.2013.01.008. [DOI] [PMC free article] [PubMed] [Google Scholar]
- Arsenault JT, Rima S, Stemmann H, Vanduffel W, 2014. Role of the primate ventral tegmental area in reinforcement and motivation. Curr. Biol. CB 24, 1347–1353 10.1016/j.cub.2014.04.044. [DOI] [PMC free article] [PubMed] [Google Scholar]
- Atkinson EG, Rogers J, Mahaney MC, Cox LA, Cheverud JM, 2015. Cortical folding of the primate brain: an interdisciplinary examination of the genetic architecture, modularity, and evolvability of a significant neurological trait in pedigreed baboons (Genus Papio). Genetics 200, 651–665 10.1534/genetics.114.173443. [DOI] [PMC free article] [PubMed] [Google Scholar]
- Avillac M, Ben Hamed S, Duhamel J−R, 2007. Multisensory integration in the ventral intraparietal area of the macaque monkey. J. Neurosci. Off. J. Soc. Neurosci 27, 1922–1932 https://doi.org/27/8/1922. [DOI] [PMC free article] [PubMed] [Google Scholar]
- Bacha-Trams M, Alexandrov YI, Broman E, Glerean E, Kauppila M, Kauttonen J, Ryyppö E, Sams M, Jääskeläinen IP, 2018. A drama movie activates brains of holistic and analytical thinkers differentially. Soc. Cogn. Affect. Neurosci 13, 1293–1304 10.1093/scan/nsy099. [DOI] [PMC free article] [PubMed] [Google Scholar]
- Bao P, She L, McGill M, Tsao DY, 2020. A map of object space in primate inferotemporal cortex. Nature 583, 103–108 10.1038/s41586-020-2350-5. [DOI] [PMC free article] [PubMed] [Google Scholar]
- Bao P, Tsao DY, 2018. Representation of multiple objects in macaque category-selective areas. Nat. Commun 9, 1774 10.1038/s41467-018-04126-7. [DOI] [PMC free article] [PubMed] [Google Scholar]
- Baumann S, Petkov CI, Griffiths TD, 2013. A unified framework for the organization of the primate auditory cortex. Front Syst Neurosci 7, 11. 10.3389/fnsys.2013.00011. [DOI] [PMC free article] [PubMed] [Google Scholar]
- Belin P, Zatorre RJ, 2003. Adaptation to speaker’s voice in right anterior temporal lobe. Neuroreport 14, 2105–2109 10.1097/00001756-200311140-00019. [DOI] [PubMed] [Google Scholar]
- Bell AH, Hadj-Bouziane F, Frihauf JB, Tootell RBH, Ungerleider LG, 2009. Object representations in the temporal cortex of monkeys and humans as revealed by functional magnetic resonance imaging. J. Neurophysiol 101, 688–700 10.1152/jn.90657.2008. [DOI] [PMC free article] [PubMed] [Google Scholar]
- Bell AH, Malecek NJ, Morin EL, Hadj-Bouziane F, Tootell RBH, Ungerleider LG, 2011. Relationship between functional magnetic resonance imaging-identified regions and neuronal category selectivity. J. Neurosci. Off. J. Soc. Neurosci 31, 12229–12240 10.1523/JNEUROSCI.5865-10.2011. [DOI] [PMC free article] [PubMed] [Google Scholar]
- Belmonte JCI, Callaway EM, Churchland P, Caddick SJ, Feng G, Homanics GE, Lee K−F, Leopold DA, Miller CT, Mitchell JF, Mitalipov S, Moutri AR, Movshon JA, Okano H, Reynolds JH, Ringach D, Sejnowski TJ, Silva AC, Strick PL, Wu J, Zhang F, 2015. Brains, Genes, and Primates. Neuron 86, 617–631 10.1016/j.neuron.2015.03.021. [DOI] [PMC free article] [PubMed] [Google Scholar]
- Ben Hamed S, Duhamel JR, Bremmer F, Graf W, 2001. Representation of the visual field in the lateral intraparietal area of macaque monkeys: a quantitative receptive field analysis. Exp. Brain Res. Exp. Hirnforsch. Exp. Céréb 140, 127–144. [DOI] [PubMed] [Google Scholar]
- Berman MG, Park J, Gonzalez R, Polk TA, Gehrke A, Knaffla S, Jonides J, 2010. Evaluating functional localizers: the case of the FFA. Neuroimage 50, 56–71 10.1016/j.neuroimage.2009.12.024. [DOI] [PMC free article] [PubMed] [Google Scholar]
- Biswal B, Yetkin FZ, Haughton VM, Hyde JS, 1995. Functional connectivity in the motor cortex of resting human brain using echo-planar MRI. Magn. Reson. Med 34, 537–541 10.1002/mrm.1910340409. [DOI] [PubMed] [Google Scholar]
- Bogadhi AR, Bollimunta A, Leopold DA, Krauzlis RJ, 2018. Brain regions modulated during covert visual attention in the macaque. Sci. Rep 8, 15237 10.1038/s41598-018-33567-9. [DOI] [PMC free article] [PubMed] [Google Scholar]
- Boussaoud D, Desimone R, Ungerleider LG, 1991. Visual topography of area TEO in the macaque. J. Comp. Neurol 306, 554–575 10.1002/cne.903060403. [DOI] [PubMed] [Google Scholar]
- Brewer AA, Press WA, Logothetis NK, Wandell BA, 2002. Visual areas in macaque cortex measured using functional magnetic resonance imaging. J. Neurosci. Off. J. Soc. Neurosci 22, 10416–10426 https://doi.org/12451141. [DOI] [PMC free article] [PubMed] [Google Scholar]
- Buschman TJ, Denovellis EL, Diogo C, Bullock D, Miller EK, 2012. November 21. Synchronous oscillatory neural ensembles for rules in the prefrontal cortex. Neuron 76 (4), 838–846 10.1016/j.neuron.2012.09.029. [DOI] [PMC free article] [PubMed] [Google Scholar]
- Button KS, 2019. Double-dipping revisited. Nat. Neurosci 22, 688–690 10.1038/s41593-019-0398-z. [DOI] [PubMed] [Google Scholar]
- Cachia A, Paillère-Martinot M−L, Galinowski A, Januel D, de Beaurepaire R, Bellivier F, Artiges E, Andoh J, Bartrés-Faz D, Duchesnay E, Rivière D, Plaze M, Mangin J−F, Martinot J−L, 2008. Cortical folding abnormalities in schizophrenia patients with resistant auditory hallucinations. Neuroimage 39, 927–935 10.1016/j.neuroimage.2007.08.049. [DOI] [PubMed] [Google Scholar]
- Caprara I, Premereur E, Romero MC, Faria P, Janssen P, 2018. Shape responses in a macaque frontal area connected to posterior parietal cortex. Neuroimage 179, 298–312 10.1016/j.neuroimage.2018.06.052. [DOI] [PubMed] [Google Scholar]
- Caspari N, Arsenault JT, Vandenberghe R, Vanduffel W, 2018. Functional similarity of medial superior parietal areas for shift-selective attention signals in humans and monkeys. Cereb. Cortex N. Y. N 1991 28, 2085–2099 10.1093/cercor/bhx114. [DOI] [PubMed] [Google Scholar]
- Caspari N, Janssens T, Mantini D, Vandenberghe R, Vanduffel W, 2015. Covert shifts of spatial attention in the Macaque monkey. J. Neurosci 35, 7695–7714 10.1523/JNEUROSCI.4383-14.2015. [DOI] [PMC free article] [PubMed] [Google Scholar]
- Chau BKH, Kolling N, Hunt LT, Walton ME, Rushworth MFS, 2014. A neural mechanism underlying failure of optimal choice with multiple alternatives. Nat. Neurosci 17, 463–470 10.1038/nn.3649. [DOI] [PMC free article] [PubMed] [Google Scholar]
- Chau BKH, Sallet J, Papageorgiou GK, Noonan MP, Bell AH, Walton ME, Rushworth MFS, 2015. Contrasting roles for orbitofrontal cortex and amygdala in credit assignment and learning in Macaques. Neuron 87, 1106–1118 10.1016/j.neuron.2015.08.018. [DOI] [PMC free article] [PubMed] [Google Scholar]
- Chen J, Hasson U, Honey CJ, 2015. Processing timescales as an organizing principle for primate cortex. Neuron 88, 244–246 10.1016/j.neuron.2015.10.010. [DOI] [PubMed] [Google Scholar]
- Chen J, Leong YC, Honey CJ, Yong CH, Norman KA, Hasson U, 2017. Shared memories reveal shared structure in neural activity across individuals. Nat. Neurosci 20, 115–125 10.1038/nn.4450. [DOI] [PMC free article] [PubMed] [Google Scholar]
- Chen LM, Turner GH, Friedman RM, Zhang N, Gore JC, Roe AW, Avison MJ, 2007. High-resolution maps of real and illusory tactile activation in primary somatosensory cortex in individual monkeys with functional magnetic resonance imaging and optical imaging. J. Neurosci. Off. J. Soc. Neurosci 27, 9181–9191 10.1523/JNEUROSCI.1588-07.2007. [DOI] [PMC free article] [PubMed] [Google Scholar]
- Chen P−H, Guntupalli JS, Haxby JV, Ramadge PJ, 2014. Joint SVD-hyperalignment for multi-subject FMRI data alignment. In: 2014 IEEE International Workshop on Machine Learning for Signal Processing (MLSP). Presented at the 2014 IEEE International Workshop on Machine Learning for Signal Processing (MLSP), pp. 1–6 10.1109/MLSP.2014.6958912. [DOI] [Google Scholar]
- Chen P-HA, Jolly E, Cheong JH, Chang LJ, 2020. Intersubject representational similarity analysis reveals individual variations in affective experience when watching erotic movies. Neuroimage 216, 116851 10.1016/j.neuroimage.2020.116851. [DOI] [PMC free article] [PubMed] [Google Scholar]
- Cléry J, Amiez C, Guipponi O, Wardak C, Procyk E, Ben Hamed S, 2018a. Reward activations and face fields in monkey cingulate motor areas. J. Neurophysiol 119, 1037–1044 10.1152/jn.00749.2017. [DOI] [PubMed] [Google Scholar]
- Cléry J, Ben Hamed S, 2018. Frontier of self and impact prediction. Front. Psychol 9, 1073 10.3389/fpsyg.2018.01073. [DOI] [PMC free article] [PubMed] [Google Scholar]
- Cléry J, Guipponi O, Odouard S, Pinède S, Wardak C, Ben Hamed S, 2017. The prediction of impact of a looming stimulus onto the body is subserved by multisensory integration mechanisms. J. Neurosci. Off. J. Soc. Neurosci 37, 10656–10670 10.1523/JNEUROSCI.0610-17.2017. [DOI] [PMC free article] [PubMed] [Google Scholar]
- Cléry J, Guipponi O, Odouard S, Wardak C, Ben Hamed S, 2018b. Cortical networks for encoding near and far space in the non-human primate. Neuroimage 176, 164–178 10.1016/j.neuroimage.2018.04.036. [DOI] [PubMed] [Google Scholar]
- Cléry JC, Hori Y, Schaeffer DJ, Gati JS, Pruszynski JA, Everling S, 2020. Whole brain mapping of somatosensory responses in awake marmosets investigated with ultra-high field fMRI (preprint). Neuroscience 10.1101/2020.08.05.238592. [DOI] [PubMed] [Google Scholar]
- Conway BR, 2018. The organization and operation of inferior temporal cortex. Annu. Rev. Vis. Sci 4, 381–402 10.1146/annurev-vision-091517-034202. [DOI] [PMC free article] [PubMed] [Google Scholar]
- Conway BR, Moeller S, Tsao DY, 2007. Specialized color modules in macaque extrastriate cortex. Neuron 56, 560–573 10.1016/j.neuron.2007.10.008. [DOI] [PMC free article] [PubMed] [Google Scholar]
- Cottereau BR, Smith AT, Rima S, Fize D, Héjja-Brichard Y, Renaud L, Lejards C, Vayssière N, Trotter Y, Durand J−B, 2017. Processing of egomotion-consistent optic flow in the rhesus Macaque cortex. Cereb. Cortex N. Y. N 1991 27, 330–343 10.1093/cercor/bhw412. [DOI] [PMC free article] [PubMed] [Google Scholar]
- Denenberg VH, 1981. Hemispheric laterality in animals and the effects of early experience. Behav. Brain Sci 4, 1–21 . [DOI] [Google Scholar]
- Draper NR, Smith H, 1998. Applied Regression Analysis (Third Edition). John Wiley & Sons, Inc. [Google Scholar]
- Dubois J, de Berker AO, Tsao DY, 2015. Single-unit recordings in the macaque face patch system reveal limitations of fMRI MVPA. J. Neurosci. Off. J. Soc. Neurosci 35, 2791–2802 10.1523/JNEUROSCI.4037-14.2015. [DOI] [PMC free article] [PubMed] [Google Scholar]
- Durand J−B, Nelissen K, Joly O, Wardak C, Todd JT, Norman JF, Janssen P, Vanduffel W, Orban GA, 2007. Anterior regions of monkey parietal cortex process visual 3D shape. Neuron 55, 493–505 https://doi.org/S0896-6273(07)00499-0. [DOI] [PMC free article] [PubMed] [Google Scholar]
- Erb J, Armendariz M, De Martino F, Goebel R, Vanduffel W, Formisano E, 2019. Homology and specificity of natural sound-encoding in human and monkey auditory cortex. Cereb. Cortex N. Y. N 1991 29, 3636–3650 10.1093/cercor/bhy243. [DOI] [PubMed] [Google Scholar]
- Falk D, 1987. Brain lateralization in primates and its evolution in hominids. Am. J. Phys. Anthropol 30, 107–125 10.1002/ajpa.1330300508. [DOI] [Google Scholar]
- Finn ES, Glerean E, Khojandi AY, Nielson D, Molfese PJ, Handwerker DA, Bandettini PA, 2020. Idiosynchrony: from shared responses to individual differences during naturalistic neuroimaging. Neuroimage 215, 116828 10.1016/j.neuroimage.2020.116828. [DOI] [PMC free article] [PubMed] [Google Scholar]
- Fize D, Vanduffel W, Nelissen K, Denys K, Chef d’Hotel C, Faugeras O, Orban GA, 2003. The retinotopic organization of primate dorsal V4 and surrounding areas: a functional magnetic resonance imaging study in awake monkeys. J. Neurosci. Off. J. Soc. Neurosci 23, 7395–7406 https://doi.org/12917375. [DOI] [PMC free article] [PubMed] [Google Scholar]
- Formisano E, Kim DS, Di Salle F, van de Moortele PF, Ugurbil K, Goebel R, 2003. Mirror-symmetric tonotopic maps in human primary auditory cortex. Neuron 40, 859–869. [DOI] [PubMed] [Google Scholar]
- Fox AS, Holley D, Klink PC, Arbuckle SA, Barnes CA, Diedrichsen J, et al. , 2021. Sharing voxelwise neuroimaging results from rhesus monkeys and other species with Neurovault. Neuroimage 225, 117518 10.1016/j.neuroimage.2020.117518. [DOI] [PMC free article] [PubMed] [Google Scholar]
- Freiwald WA, Tsao DY, Livingstone MS, 2009. A face feature space in the macaque temporal lobe. Nat. Neurosci 12, 1187–1196 10.1038/nn.2363. [DOI] [PMC free article] [PubMed] [Google Scholar]
- Froesel M, Goudard Q, Hauser M, Gacoin M, Hamed SB, 2020. Automated video-based heart rate tracking for the anesthetized and behaving monkey. Sci Rep 10 (1), 17940 10.1038/s41598-020-74954-5.2020.06.23.16741110.1038/s41598-020-74954-5.2020.06.23.167411https://doi.org/10.1101/2020.06.23.167411https://doi.org/10.1101/2020.06.23.167411 . [DOI] [PMC free article] [PubMed] [Google Scholar]
- Gao J, Chen G, Wu J, Wang Y, Hu Y, Xu T, Zuo X−N, Yang Z, 2020. Reliability map of individual differences reflected in inter-subject correlation in naturalistic imaging. Neuroimage 223, 117277 10.1016/j.neuroimage.2020.117277. [DOI] [PubMed] [Google Scholar]
- Gauthier I, Skudlarski P, Gore JC, Anderson AW, 2000. Expertise for cars and birds recruits brain areas involved in face recognition. Nat. Neurosci 3, 191–197 10.1038/72140. [DOI] [PubMed] [Google Scholar]
- Gerits A, Farivar R, Rosen BR, Wald LL, Boyden ES, Vanduffel W, 2012. Optogenetically induced behavioral and functional network changes in primates. Curr. Biol. CB 22, 1722–1726 10.1016/j.cub.2012.07.023. [DOI] [PMC free article] [PubMed] [Google Scholar]
- Gil-da-Costa R, Martin A, Lopes MA, Muñoz M, Fritz JB, Braun AR, 2006. Species-specific calls activate homologs of Broca’s and Wernicke’s areas in the macaque. Nat. Neurosci 9, 1064–1070 10.1038/nn1741. [DOI] [PubMed] [Google Scholar]
- Gruskin DC, Rosenberg MD, Holmes AJ, 2020. Relationships between depressive symptoms and brain responses during emotional movie viewing emerge in adolescence. Neuroimage 216, 116217 10.1016/j.neuroimage.2019.116217. [DOI] [PMC free article] [PubMed] [Google Scholar]
- Guipponi O, Cléry J, Odouard S, Wardak C, Ben Hamed S, 2015. Whole brain mapping of visual and tactile convergence in the macaque monkey. Neuroimage 117, 93–102 10.1016/j.neuroimage.2015.05.022. [DOI] [PubMed] [Google Scholar]
- Guipponi O, Wardak C, Ibarrola D, Comte J−C, Sappey-Marinier D, Pinède S, Ben Hamed S, 2013. Multimodal convergence within the intraparietal sulcus of the Macaque monkey. J. Neurosci. Off. J. Soc. Neurosci 33, 4128–4139 10.1523/JNEUROSCI.1421-12.2013. [DOI] [PMC free article] [PubMed] [Google Scholar]
- Guntupalli JS, Hanke M, Halchenko YO, Connolly AC, Ramadge PJ, Haxby JV, 2016. A model of representational spaces in human cortex. Cereb. Cortex N. Y. N 1991 26, 2919–2934 10.1093/cercor/bhw068. [DOI] [PMC free article] [PubMed] [Google Scholar]
- Hadj-Bouziane F, Bell AH, Knusten TA, Ungerleider LG, Tootell RBH, 2008. Perception of emotional expressions is independent of face selectivity in monkey inferior temporal cortex. Proc. Natl. Acad. Sci. U. S. A 105, 5591–5596 https://doi.org/0800489105. [DOI] [PMC free article] [PubMed] [Google Scholar]
- Halpern ME, Güntürkün O, Hopkins WD, Rogers LJ, 2005. Lateralization of the vertebrate brain: taking the side of model systems. J. Neurosci 25, 10351–10357 10.1523/JNEUROSCI.3439-05.2005. [DOI] [PMC free article] [PubMed] [Google Scholar]
- Hamilton CR, 1983. Lateralization for orientation in split-brain monkeys. Behav. Brain Res 10, 399–403 10.1016/0166-4328(83)90044-X. [DOI] [PubMed] [Google Scholar]
- Han K, Wen H, Shi J, Lu K−H, Zhang Y, Fu D, Liu Z, 2019. Variational autoencoder: an unsupervised model for encoding and decoding fMRI activity in visual cortex. Neuroimage 198, 125–136 10.1016/j.neuroimage.2019.05.039. [DOI] [PMC free article] [PubMed] [Google Scholar]
- Hasson U, Ghazanfar AA, Galantucci B, Garrod S, Keysers C, 2012. Brain-to-brain coupling: a mechanism for creating and sharing a social world. Trends Cogn. Sci 16, 114–121 10.1016/j.tics.2011.12.007. [DOI] [PMC free article] [PubMed] [Google Scholar]
- Hasson U, Nir Y, Levy I, Fuhrmann G, Malach R, 2004. Intersubject synchronization of cortical activity during natural vision. Science 303, 1634–1640 10.1126/science.1089506. [DOI] [PubMed] [Google Scholar]
- Hasson U, Yang E, Vallines I, Heeger DJ, Rubin N, 2008. A hierarchy of temporal receptive windows in human cortex. J. Neurosci. Off. J. Soc. Neurosci 28, 2539–2550 https://doi.org/PMC2556707. [DOI] [PMC free article] [PubMed] [Google Scholar]
- Haxby JV, Gobbini MI, Furey ML, Ishai A, Schouten JL, Pietrini P, 2001. Distributed and overlapping representations of faces and objects in ventral temporal cortex. Science 293, 2425–2430 10.1126/science.1063736. [DOI] [PubMed] [Google Scholar]
- Haxby JV, Guntupalli JS, Connolly AC, Halchenko YO, Conroy BR, Gobbini MI, Hanke M, Ramadge PJ, 2011. A common, high-dimensional model of the representational space in human ventral temporal cortex. Neuron 72, 404–416 10.1016/j.neuron.2011.08.026. [DOI] [PMC free article] [PubMed] [Google Scholar]
- Heffner HE, Heffner RS, 1984. Temporal lobe lesions and perception of species-specific vocalizations by macaques. Science 226, 75–76 10.1126/science.6474192. [DOI] [PubMed] [Google Scholar]
- Hopkins WD, 1995. Hand preferences for a coordinated bimanual task in 110 chimpanzees (Pan troglodytes): cross-sectional analysis. J. Comp. Psychol. Wash. DC 1983 109, 291–297 10.1037/0735-7036.109.3.291. [DOI] [PubMed] [Google Scholar]
- Huang R−S, Sereno MI, 2007. Dodecapus: an MR-compatible system for somatosensory stimulation. Neuroimage 34, 1060–1073 10.1016/j.neuroimage.2006.10.024. [DOI] [PubMed] [Google Scholar]
- Huang T, Chen X, Jiang J, Zhen Z, Liu J, 2019. A probabilistic atlas of the human motion complex built from large-scale functional localizer data. Hum. Brain Mapp 40, 3475–3487 10.1002/hbm.24610. [DOI] [PMC free article] [PubMed] [Google Scholar]
- Hung C−C, Yen CC, Ciuchta JL, Papoti D, Bock NA, Leopold DA, Silva AC, 2015. Functional mapping of face-selective regions in the extrastriate visual cortex of the marmoset. J. Neurosci. Off. J. Soc. Neurosci 35, 1160–1172 10.1523/JNEUROSCI.2659-14.2015. [DOI] [PMC free article] [PubMed] [Google Scholar]
- Huth AG, Nishimoto S, Vu AT, Gallant JL, 2012. A continuous semantic space describes the representation of thousands of object and action categories across the human brain. Neuron 76, 1210–1224 10.1016/j.neuron.2012.10.014. [DOI] [PMC free article] [PubMed] [Google Scholar]
- Im K, Lee J−M, Seo SW, Hyung Kim S, Kim SI, Na DL, 2008. Sulcal morphology changes and their relationship with cortical thickness and gyral white matter volume in mild cognitive impairment and Alzheimer’s disease. Neuroimage 43, 103–113 10.1016/j.neuroimage.2008.07.016. [DOI] [PubMed] [Google Scholar]
- Jääskeläinen IP, Pajula J, Tohka J, Lee H−J, Kuo W−J, Lin F−H, 2016. Brain hemodynamic activity during viewing and re-viewing of comedy movies explained by experienced humor. Sci. Rep 6, 27741 10.1038/srep27741. [DOI] [PMC free article] [PubMed] [Google Scholar]
- Janssens T, Zhu Q, Popivanov ID, Vanduffel W, 2014. Probabilistic and single-subject retinotopic maps reveal the topographic organization of face patches in the macaque cortex. J. Neurosci. Off. J. Soc. Neurosci 34, 10156–10167 10.1523/JNEUROSCI.2914-13.2013. [DOI] [PMC free article] [PubMed] [Google Scholar]
- Jastorff J, Popivanov ID, Vogels R, Vanduffel W, Orban GA, 2012. Integration of shape and motion cues in biological motion processing in the monkey STS. Neuroimage 60, 911–921 10.1016/j.neuroimage.2011.12.087. [DOI] [PubMed] [Google Scholar]
- Jiang X, Long T, Cao W, Li J, Dehaene S, Wang L, 2018. Production of supra-regular spatial sequences by macaque monkeys. Curr. Biol. CB 28, 1851–1859 e4 10.1016/j.cub.2018.04.047. [DOI] [PMC free article] [PubMed] [Google Scholar]
- Joly O, Pallier C, Ramus F, Pressnitzer D, Vanduffel W, Orban GA, 2012a. Processing of vocalizations in humans and monkeys: a comparative fMRI study. Neuroimage 62, 1376–1389 10.1016/j.neuroimage.2012.05.070. [DOI] [PubMed] [Google Scholar]
- Joly O, Ramus F, Pressnitzer D, Vanduffel W, Orban GA, 2012b. Interhemispheric differences in auditory processing revealed by fMRI in awake rhesus monkeys. Cereb. Cortex N. Y. N 1991 22, 838–853 10.1093/cercor/bhr150. [DOI] [PubMed] [Google Scholar]
- Kanwisher N, McDermott J, Chun MM, 1997. The fusiform face area: a module in human extrastriate cortex specialized for face perception. J. Neurosci. Off. J. Soc. Neurosci 17, 4302–4311. [DOI] [PMC free article] [PubMed] [Google Scholar]
- Karolis VR, Corbetta M, Thiebaut de Schotten M, 2019. The architecture of functional lateralisation and its relationship to callosal connectivity in the human brain. Nat. Commun 10, 1417 10.1038/s41467-019-09344-1. [DOI] [PMC free article] [PubMed] [Google Scholar]
- Kaskan PM, Costa VD, Eaton HP, Zemskova JA, Mitz AR, Leopold DA, Ungerleider LG, Murray EA, 2017. Learned value shapes responses to objects in frontal and ventral stream networks in macaque monkeys. Cereb. Cortex N. Y. N 1991 27, 2739–2757 10.1093/cercor/bhw113. [DOI] [PMC free article] [PubMed] [Google Scholar]
- Klink PC, Aubry JF, Ferrera VP, Fox AS, Froudist-Walsh S, Jarraya B, Konofagou EE, Krauzlis RJ, Messinger A, Mitchell AS, Ortiz-Rios M, Oya H, Roberts AC, Roe AW, Rushworth MFS, Sallet J, Schmid MC, Schroeder CE, Tasserie J, Tsao DY, Uhrig L, Vanduffel W, Wilke M, Kagan I, Petkov CI, 2021. Combining brain perturbation and neuroimaging in non-human primates. Neuroimage 235, 118017. doi: 10.1016/j.neuroimage.2021.118017, Epub ahead of print. [DOI] [PMC free article] [PubMed] [Google Scholar]
- Kolster H, Janssens T, Orban GA, Vanduffel W, 2014. The retinotopic organization of macaque occipitotemporal cortex anterior to V4 and caudoventral to the middle temporal (MT) cluster. J. Neurosci. Off. J. Soc. Neurosci 34, 10168–10191 10.1523/JNEUROSCI.3288-13.2014. [DOI] [PMC free article] [PubMed] [Google Scholar]
- Kolster H, Mandeville JB, Arsenault JT, Ekstrom LB, Wald LL, Vanduffel W, 2009. Visual field map clusters in macaque extrastriate visual cortex. J. Neurosci. Off. J. Soc. Neurosci 29, 7031–7039 10.1523/JNEUROSCI.0518-09.2009. [DOI] [PMC free article] [PubMed] [Google Scholar]
- Koyano KW, Jones AP, McMahon DBT, Waidmann EN, Russ BE, Leopold DA, 2021. Dynamic suppression of average facial structure shapes neural tuning in three macaque face patches. Curr. Biol 31 (1), 1–12. doi: 10.1016/j.cub.2020.09.070. 10.1016/j.cub.2020.09.070. [DOI] [PMC free article] [PubMed] [Google Scholar]
- Kriegeskorte N, Simmons WK, Bellgowan PSF, Baker CI, 2009. Circular analysis in systems neuroscience: the dangers of double dipping. Nat. Neurosci 12, 535–540 10.1038/nn.2303. [DOI] [PMC free article] [PubMed] [Google Scholar]
- Ku S−P, Tolias AS, Logothetis NK, Goense J, 2011. fMRI of the face-processing network in the ventral temporal lobe of awake and anesthetized macaques. Neuron 70, 352–362 10.1016/j.neuron.2011.02.048. [DOI] [PubMed] [Google Scholar]
- Kuperman V, Stadthagen-Gonzalez H, Brysbaert M, 2012. Age-of-acquisition ratings for 30,000 English words. Behav. Res. Methods 44, 978–990 10.3758/s13428-012-0210-4. [DOI] [PubMed] [Google Scholar]
- Lafer-Sousa R, Conway BR, 2013. Parallel, multi-stage processing of colors, faces and shapes in macaque inferior temporal cortex. Nat. Neurosci 16, 1870–1878 10.1038/nn.3555. [DOI] [PMC free article] [PubMed] [Google Scholar]
- Leopold DA, Park SH, 2020. Studying the visual brain in its natural rhythm. Neuroimage 216, 116790 10.1016/j.neuroimage.2020.116790. [DOI] [PMC free article] [PubMed] [Google Scholar]
- Lopez-Persem A, Verhagen L, Amiez C, Petrides M, Sallet J, 2019. The human ventromedial prefrontal cortex: sulcal morphology and its influence on functional organization. J. Neurosci. Off. J. Soc. Neurosci 39, 3627–3639 10.1523/JNEUROSCI.2060-18.2019. [DOI] [PMC free article] [PubMed] [Google Scholar]
- Mantini D, Corbetta M, Romani GL, Orban GA, Vanduffel W, 2013. Evolutionarily novel functional networks in the human brain? J. Neurosci 33, 3259–3275 10.1523/JNEUROSCI.4392-12.2013. [DOI] [PMC free article] [PubMed] [Google Scholar]
- Mantini D, Corbetta M, Romani GL, Orban GA, Vanduffel W, 2012a. Data-driven analysis of analogous brain networks in monkeys and humans during natural vision. Neuroimage 63, 1107–1118 10.1016/j.neuroimage.2012.08.042. [DOI] [PMC free article] [PubMed] [Google Scholar]
- Mantini D, Hasson U, Betti V, Perrucci MG, Romani GL, Corbetta M, Orban GA, Vanduffel W, 2012b. Interspecies activity correlations reveal functional correspondence between monkey and human brain areas. Nat. Methods 9, 277–282 10.1038/nmeth.1868. [DOI] [PMC free article] [PubMed] [Google Scholar]
- Mantini D, Gerits A, Nelissen K, Durand JB, Joly O, Simone L, Sawamura H, Wardak C, Orban GA, Buckner RL, Vanduffel W, 2011. Default mode of brain function in monkeys. J Neurosci 31, 12954–12962. [DOI] [PMC free article] [PubMed] [Google Scholar]
- Marciniak K, Atabaki A, Dicke PW, Thier P, 2014. July 14. Disparate substrates for head gaze following and face perception in the monkey superior temporal sulcus. Elife 3, e03222 10.7554/eLife.03222. [DOI] [PMC free article] [PubMed] [Google Scholar]
- McMahon DBT, Russ BE, Elnaiem HD, Kurnikova AI, Leopold DA, 2015. Single-unit activity during natural vision: diversity, consistency, and spatial sensitivity among af face patch neurons. J. Neurosci.: Off. J. Soc. Neurosci 35 (14), 5537–5548 10.1523/JNEUROSCI.3825-14.2015. [DOI] [PMC free article] [PubMed] [Google Scholar]
- Messinger A, Sirmpilatze N, Heuer K, Loh KK, Mars RB, Sein J, Xu T, Glen D, Jung B, Seidlitz J, Taylor P, Toro R, Garza-Villarreal EA, Sponheim C, Wang X, Benn RA, Cagna B, Dadarwal R, Evrard HC, Garcia-Saldivar P, Giavasis S, Hartig R, Lepage C, Liu C, Majka P, Merchant H, Milham MP, Rosa MGP, Tasserie J, Uhrig L, Margulies DS, Klink PC, 2021. A collaborative resource platform for non-human primate neuroimaging. Neuroimage 226, 117519. doi: 10.1016/j.neuroimage.2020.117519, Epub 2020 Nov 20. [DOI] [PMC free article] [PubMed] [Google Scholar]
- Meguerditchian A, Vauclair J, Hopkins WD, 2013. On the origins of human handedness and language: a comparative review of hand preferences for bimanual coordinated actions and gestural communication in nonhuman primates. Dev. Psychobiol 55, 637–650 10.1002/dev.21150. [DOI] [PubMed] [Google Scholar]
- Milham M, 2020. Accelerating the evolution of nonhuman primate neuroimaging. Neuron 105, 600–603 10.1016/j.neuron.2019.12.023. [DOI] [PMC free article] [PubMed] [Google Scholar]
- Milham MP, Ai L, Koo B, Xu T, Amiez C, Balezeau F, Baxter MG, Blezer ELA, Brochier T, Chen A, Croxson PL, Damatac CG, Dehaene S, Everling S, Fair DA, Fleysher L, Freiwald W, Froudist-Walsh S, Griffiths TD, Guedj C, Hadj-Bouziane F, Ben Hamed S, Harel N, Hiba B, Jarraya B, Jung B, Kastner S, Klink PC, Kwok SC, Laland KN, Leopold DA, Lindenfors P, Mars RB, Menon RS, Messinger A, Meunier M, Mok K, Morrison JH, Nacef J, Nagy J, Rios MO, Petkov CI, Pinsk M, Poirier C, Procyk E, Rajimehr R, Reader SM, Roelfsema PR, Rudko DA, Rushworth MFS, Russ BE, Sallet J, Schmid MC, Schwiedrzik CM, Seidlitz J, Sein J, Shmuel A, Sullivan EL, Ungerleider L, Thiele A, Todorov OS, Tsao D, Wang Z, Wilson CRE, Yacoub E, Ye FQ, Zarco W, Zhou Y, Margulies DS, Schroeder CE, 2018. An open resource for non-human primate imaging. Neuron 100, 61–74 e2 10.1016/j.neuron.2018.08.039. [DOI] [PMC free article] [PubMed] [Google Scholar]
- Miyamoto K, Osada T, Setsuie R, Takeda M, Tamura K, Adachi Y, Miyashita Y, 2017. Causal neural network of metamemory for retrospection in primates. Science 355, 188–193 10.1126/science.aal0162. [DOI] [PubMed] [Google Scholar]
- Moerel M, De Martino F, Formisano E, 2014. An anatomical and functional topography of human auditory cortical areas. Front. Neurosci 8, 225 10.3389/fnins.2014.00225. [DOI] [PMC free article] [PubMed] [Google Scholar]
- Moeller S, Freiwald WA, Tsao DY, 2008. Patches with links: a unified system for processing faces in the macaque temporal lobe. Science (New York, NY) 320 (5881), 1355–1359 10.1126/science.1157436. [DOI] [PMC free article] [PubMed] [Google Scholar]
- Moeller S, Nallasamy N, Tsao DY, Freiwald WA, 2009. Functional connectivity of the macaque brain across stimulus and arousal states. J. Neurosci 29 (18), 5897–5909 10.1523/JNEUROSCI.0220-09.2009. [DOI] [PMC free article] [PubMed] [Google Scholar]
- Nelissen K, Vanduffel W, Orban GA, 2006. Charting the lower superior temporal region, a new motion-sensitive region in monkey superior temporal sulcus. J. Neurosci. Off. J. Soc. Neurosci 26, 5929–5947 https://doi.org/26/22/5929. [DOI] [PMC free article] [PubMed] [Google Scholar]
- Nguyen M, Vanderwal T, Hasson U, 2019. Shared understanding of narratives is correlated with shared neural responses. Neuroimage 184, 161–170 10.1016/j.neuroimage.2018.09.010. [DOI] [PMC free article] [PubMed] [Google Scholar]
- Nieto-Castañón A, Fedorenko E, 2012. Subject-specific functional localizers increase sensitivity and functional resolution of multi-subject analyses. Neuroimage 63, 1646–1669 10.1016/j.neuroimage.2012.06.065. [DOI] [PMC free article] [PubMed] [Google Scholar]
- Nishimoto S, Vu AT, Naselaris T, Benjamini Y, Yu B, Gallant JL, 2011. Reconstructing visual experiences from brain activity evoked by natural movies. Curr. Biol 21, 1641–1646 10.1016/j.cub.2011.08.031. [DOI] [PMC free article] [PubMed] [Google Scholar]
- Noonan MP, Kolling N, Walton ME, Rushworth MFS, 2012. Re-evaluating the role of the orbitofrontal cortex in reward and reinforcement. Eur. J. Neurosci 35, 997–1010 10.1111/j.1460-9568.2012.08023.x. [DOI] [PubMed] [Google Scholar]
- Nummenmaa L, Glerean E, Viinikainen M, Jääskeläinen IP, Hari R, Sams M, 2012. Emotions promote social interaction by synchronizing brain activity across individuals. Proc. Natl. Acad. Sci. U. S. A 109, 9599–9604 10.1073/pnas.1206095109. [DOI] [PMC free article] [PubMed] [Google Scholar]
- Orban G, Jastorff J, 2014. Functional Mapping of Motion Regions in Human and Non-Human Primates. The MIT Press, Cambridge, MA, USA. [Google Scholar]
- Orban GA, Van Essen D, Vanduffel W, 2004. Comparative mapping of higher visual areas in monkeys and humans. Trends Cogn Sci 8, 315–324. [DOI] [PubMed] [Google Scholar]
- Park SH, Russ BE, McMahon DBT, Koyano KW, Berman RA, Leopold DA, 2017. Functional subpopulations of neurons in a macaque face patch revealed by single-unit fMRI mapping. Neuron 95, 971–981 e5 10.1016/j.neuron.2017.07.014. [DOI] [PMC free article] [PubMed] [Google Scholar]
- Passingham RE, Stephan KE, Kötter R, 2002. The anatomical basis of functional localization in the cortex. Nat. Rev. Neurosci 3, 606–616 10.1038/nrn893. [DOI] [PubMed] [Google Scholar]
- Peeters R, Simone L, Nelissen K, Fabbri-Destro M, Vanduffel W, Rizzolatti G, Orban GA, 2009. The representation of tool use in humans and monkeys: common and uniquely human features. J. Neurosci. Off. J. Soc. Neurosci 29, 11523–11539 10.1523/JNEUROSCI.2040-09.2009. [DOI] [PMC free article] [PubMed] [Google Scholar]
- Pelekanos V, Mok RM, Joly O, Ainsworth M, Kyriazis D, Kelly MG, Bell AH, Kriegeskorte N, 2020. Rapid event-related, BOLD fMRI, non-human primates (NHP): choose two out of three. Sci. Rep 10, 7485 10.1038/s41598-020-64376-8. [DOI] [PMC free article] [PubMed] [Google Scholar]
- Penttilä J, Paillère-Martinot M−L, Martinot J−L, Ringuenet D, Wessa M, Houenou J, Gallarda T, Bellivier F, Galinowski A, Bruguière P, Pinabel F, Leboyer M, Olié J−P, Duchesnay E, Artiges E, Mangin J−F, Cachia A, 2009. Cortical folding in patients with bipolar disorder or unipolar depression. J. Psychiatry Neurosci. JPN 34, 127–135. [PMC free article] [PubMed] [Google Scholar]
- Pernet CR, McAleer P, Latinus M, Gorgolewski KJ, Charest I, Bestelmeyer PEG, Watson RH, Fleming D, Crabbe F, Valdes-Sosa M, Belin P, 2015. The human voice areas: spatial organization and inter-individual variability in temporal and extra-temporal cortices. Neuroimage 119, 164–174 10.1016/j.neuroimage.2015.06.050. [DOI] [PMC free article] [PubMed] [Google Scholar]
- Perrodin C, Kayser C, Abel TJ, Logothetis NK, Petkov CI, 2015. Who is that? Brain networks and mechanisms for identifying individuals. Trends Cogn. Sci 10.1016/j.tics.2015.09.002. [DOI] [PMC free article] [PubMed] [Google Scholar]
- Petkov CI, Kayser C, Augath M, Logothetis NK, 2006. Functional imaging reveals numerous fields in the monkey auditory cortex. PLoS Biol 4, e215 10.1371/journal.pbio.0040215. [DOI] [PMC free article] [PubMed] [Google Scholar]
- Petkov CI, Kayser C, Steudel T, Whittingstall K, Augath M, Logothetis NK, 2008. A voice region in the monkey brain. Nat. Neurosci 11, 367–374 https://doi.org/nn2043. [DOI] [PubMed] [Google Scholar]
- Pinsk, Arcaro M, Weiner KS, Kalkus JF, Inati SJ, Gross CG, Kastner S, 2009. Neural representations of faces and body parts in macaque and human cortex: a comparative FMRI study. J. Neurophysiol 101, 2581–2600 10.1152/jn.91198.2008. [DOI] [PMC free article] [PubMed] [Google Scholar]
- Pinsk, DeSimone K, Moore T, Gross CG, Kastner S, 2005a. Representations of faces and body parts in macaque temporal cortex: a functional MRI study. Proc. Natl. Acad. Sci. U. S. A 102, 6996–7001 10.1073/pnas.0502605102. [DOI] [PMC free article] [PubMed] [Google Scholar]
- Pinsk, Moore T, Richter MC, Gross CG, Kastner S, 2005b. Methods for functional magnetic resonance imaging in normal and lesioned behaving monkeys. J. Neurosci. Methods 143, 179–195 10.1016/j.jneumeth.2004.10.003. [DOI] [PubMed] [Google Scholar]
- Popivanov ID, Jastorff J, Vanduffel W, Vogels R, 2014. Heterogeneous single-unit selectivity in an fMRI-defined body-selective patch. J. Neurosci 34, 95–111 10.1523/JNEUROSCI.2748-13.2014. [DOI] [PMC free article] [PubMed] [Google Scholar]
- Popivanov ID, Jastorff J, Vanduffel W, Vogels R, 2012. Stimulus representations in body-selective regions of the macaque cortex assessed with event-related fMRI. Neuroimage 63, 723–741 10.1016/j.neuroimage.2012.07.013. [DOI] [PubMed] [Google Scholar]
- Poremba A, Malloy M, Saunders RC, Carson RE, Herscovitch P, Mishkin M, 2004. Species-specific calls evoke asymmetric activity in the monkey’s temporal poles. Nature 427, 448–451 10.1038/nature02268. [DOI] [PubMed] [Google Scholar]
- Premereur E, Janssen P, Vanduffel W, 2018. December 12. Functional MRI in macaque monkeys during task switching. J. Neurosci 38 (50), 10619–10630 10.1523/JNEUROSCI.1539-18.2018 Epub 2018 Oct 24. [DOI] [PMC free article] [PubMed] [Google Scholar]
- Premereur E, Taubert J, Janssen P, Vogels R, Vanduffel W, 2016. Effective connectivity reveals largely independent parallel networks of face and body patches. Curr. Biol. CB 26, 3269–3279 10.1016/j.cub.2016.09.059. [DOI] [PubMed] [Google Scholar]
- Premereur E, Van Dromme IC, Romero MC, Vanduffel W, Janssen P, 2015. Effective connectivity of depth-structure-selective patches in the lateral bank of the macaque intraparietal sulcus. PLoS Biol. 13, e1002072 10.1371/journal.pbio.1002072. [DOI] [PMC free article] [PubMed] [Google Scholar]
- Prescott MJ, Lidster K, 2017. Improving quality of science through better animal welfare: the NC3Rs strategy. Lab Anim 46 (4), 152–156 10.1038/laban.1217. [DOI] [PubMed] [Google Scholar]
- Prescott MJ, Poirier C, 2021. The role of MRI in applying the 3Rs to non-human primate neuroscience. Neuroimage 225, 117521 10.1016/j.neuroimage.2020.117521. [DOI] [PubMed] [Google Scholar]
- Rauschecker JP, 1998. Cortical processing of complex sounds. Curr. Opin. Neurobiol 8, 516–521. [DOI] [PubMed] [Google Scholar]
- Rauschecker JP, Tian B, 2000. Mechanisms and streams for processing of “what ” and “where ” in auditory cortex. Proc. Natl. Acad. Sci. U. S. A 97, 11800–11806 10.1073/pnas.97.22.11800. [DOI] [PMC free article] [PubMed] [Google Scholar]
- Regev M, Honey CJ, Simony E, Hasson U, 2013. Selective and invariant neural responses to spoken and written narratives. J. Neurosci. Off. J. Soc. Neurosci 33, 15978–15988 10.1523/JNEUROSCI.1580-13.2013. [DOI] [PMC free article] [PubMed] [Google Scholar]
- Rezk M, Cattoir S, Battal C, Occelli V, Mattioni S, Collignon O, 2020. Shared representation of visual and auditory motion directions in the human middle-temporal cortex. Curr. Biol. CB 30, 2289–2299 e8 10.1016/j.cub.2020.04.039. [DOI] [PubMed] [Google Scholar]
- Rima S, Cottereau BR, Héjja-Brichard Y, Trotter Y, Durand J−B, 2020. Wide-field retinotopy reveals a new visuotopic cluster in macaque posterior parietal cortex. Brain Struct. Funct 10.1007/s00429-020-02134-2. [DOI] [PMC free article] [PubMed] [Google Scholar]
- Rossion B, Hanseeuw B, Dricot L, 2012. Defining face perception areas in the human brain: a large-scale factorial fMRI face localizer analysis. Brain Cogn 79, 138–157 10.1016/j.bandc.2012.01.001. [DOI] [PubMed] [Google Scholar]
- Russ BE, Kaneko T, Saleem KS, Berman RA, Leopold DA, 2016. Distinct fMRI responses to self-induced versus stimulus motion during free viewing in the macaque. J. Neurosci. Off. J. Soc. Neurosci 36, 9580–9589 10.1523/JNEUROSCI.1152-16.2016. [DOI] [PMC free article] [PubMed] [Google Scholar]
- Russ BE, Leopold DA, 2015. Functional MRI mapping of dynamic visual features during natural viewing in the macaque. Neuroimage 109, 84–94 10.1016/j.neuroimage.2015.01.012. [DOI] [PMC free article] [PubMed] [Google Scholar]
- Saalasti S, Alho J, Bar M, Glerean E, Honkela T, Kauppila M, Sams M, Jääskeläinen IP, 2019. Inferior parietal lobule and early visual areas support elicitation of individualized meanings during narrative listening. Brain Behav 9, e01288 10.1002/brb3.1288. [DOI] [PMC free article] [PubMed] [Google Scholar]
- Saxe R, Brett M, Kanwisher N, 2006. Divide and conquer: a defense of functional localizers. Neuroimage 30, 1088–1096 discussion 1097–1099 10.1016/j.neuroimage.2005.12.062. [DOI] [PubMed] [Google Scholar]
- Schroeder CE, Foxe J, 2005. Multisensory contributions to low-level, “unisensory” processing. Curr. Opin. Neurobiol 15, 454–458 10.1016/j.conb.2005.06.008. [DOI] [PubMed] [Google Scholar]
- Seidlitz J, Sponheim C, Glen D, Ye FQ, Saleem KS, Leopold DA, et al. , 2017. A population MRI brain template and analysis tools for the macaque. Neuroimage 170, 121–131 10.1016/j.neuroimage.2017.04.063. [DOI] [PMC free article] [PubMed] [Google Scholar]
- Sereno ME, Trinath T, Augath M, Logothetis NK, 2002. Three-dimensional shape representation in monkey cortex. Neuron 33, 635–652 https://doi.org/11856536. [DOI] [PubMed] [Google Scholar]
- Sereno MI, Dale AM, Reppas JB, Kwong KK, Belliveau JW, Brady TJ, Rosen BR, Tootell RB, 1995. Borders of multiple visual areas in humans revealed by functional magnetic resonance imaging. Science 268, 889–893 10.1126/science.7754376. [DOI] [PubMed] [Google Scholar]
- Sereno MI, Tootell RB, 2005. From monkeys to humans: what do we now know about brain homologies? Curr Opin Neurobiol 15, 135–144. [DOI] [PubMed] [Google Scholar]
- Shashidhara S, Spronkers FS, Erez Y, 2020. Individual-subject functional localization increases univariate activation but not multivariate pattern discriminability in the “multiple-demand ” frontoparietal network. J. Cogn. Neurosci 32, 1348–1368 10.1162/jocn_a_01554. [DOI] [PMC free article] [PubMed] [Google Scholar]
- Shepherd SV, Steckenfinger SA, Hasson U, Ghazanfar AA, 2010. Human-monkey gaze correlations reveal convergent and divergent patterns of movie viewing. Curr. Biol. CB 20, 649–656 10.1016/j.cub.2010.02.032. [DOI] [PMC free article] [PubMed] [Google Scholar]
- Simony E, Chang C, 2020. Analysis of stimulus-induced brain dynamics during naturalistic paradigms. Neuroimage 216, 116461 10.1016/j.neuroimage.2019.116461. [DOI] [PMC free article] [PubMed] [Google Scholar]
- Sliwa J, Freiwald WA, 2017. A dedicated network for social interaction processing in the primate brain. Science 356, 745–749 10.1126/science.aam6383. [DOI] [PMC free article] [PubMed] [Google Scholar]
- Son J, Ai L, Lim R, Xu T, Colcombe S, Franco AR, Cloud J, LaConte S, Lisinski J, Klein A, Craddock RC, Milham M, 2020. Evaluating fMRI-based estimation of eye gaze during naturalistic viewing. Cereb. Cortex N. Y. N 1991 30, 1171–1184 10.1093/cercor/bhz157. [DOI] [PMC free article] [PubMed] [Google Scholar]
- Srihasam K, Vincent JL, Livingstone MS, 2014. Novel domain formation reveals proto-architecture in inferotemporal cortex. Nat. Neurosci 17, 1776–1783 10.1038/nn.3855. [DOI] [PMC free article] [PubMed] [Google Scholar]
- Stemmann H, Freiwald WA, 2019. Evidence for an attentional priority map in inferotemporal cortex. Proc. Natl. Acad. Sci. U. S. A 116, 23797–23805 10.1073/pnas.1821866116. [DOI] [PMC free article] [PubMed] [Google Scholar]
- Stemmann H, Freiwald WA, 2016. Attentive motion discrimination recruits an area in inferotemporal cortex. J. Neurosci. Off. J. Soc. Neurosci 36, 11918–11928 10.1523/JNEUROSCI.1888-16.2016. [DOI] [PMC free article] [PubMed] [Google Scholar]
- Tannenbaum J, Bennett BT, 2015. Russell and Burch’s 3Rs then and now: the need for clarity in definition and purpose. J. Am. Assoc. Lab. Anim. Sci 54 (2), 120–132. [PMC free article] [PubMed] [Google Scholar]
- Taschereau-Dumouchel V, Cortese A, Chiba T, Knotts JD, Kawato M, Lau H, 2018. Towards an unconscious neural reinforcement intervention for common fears. Proc. Natl. Acad. Sci. U. S. A 115, 3470–3475 10.1073/pnas.1721572115. [DOI] [PMC free article] [PubMed] [Google Scholar]
- Taubert J, Van Belle G, Vanduffel W, Rossion B, Vogels R, 2015. The effect of face inversion for neurons inside and outside fMRI-defined face-selective cortical regions. J. Neurophysiol 113, 1644–1655 10.1152/jn.00700.2014. [DOI] [PMC free article] [PubMed] [Google Scholar]
- Tei S, Kauppi J−P, Fujino J, Jankowski KF, Kawada R, Murai T, Takahashi H, 2019. Inter-subject correlation of temporoparietal junction activity is associated with conflict patterns during flexible decision-making. Neurosci. Res 144, 67–70 10.1016/j.neures.2018.07.006. [DOI] [PubMed] [Google Scholar]
- Tootell RB, Tsao D, Vanduffel W, 2003. Neuroimaging weighs in: humans meet macaques in “primate” visual cortex. J Neurosci 23, 3981–3989. [DOI] [PMC free article] [PubMed] [Google Scholar]
- Tsao DY, Freiwald WA, Knutsen TA, Mandeville JB, Tootell RBH, 2003a. Faces and objects in macaque cerebral cortex. Nat Neurosci 6, 989–995 10.1038/nn1111. [DOI] [PMC free article] [PubMed] [Google Scholar]
- Tsao DY, Freiwald WA, Tootell RBH, Livingstone MS, 2006. A cortical region consisting entirely of face-selective cells. Science 311, 670–674 10.1126/science.1119983. [DOI] [PMC free article] [PubMed] [Google Scholar]
- Tsao DY, Moeller S, Freiwald WA, 2008a. Comparing face patch systems in macaques and humans. Proc. Natl. Acad. Sci. U. S. A 105, 19514–19519 10.1073/pnas.0809662105. [DOI] [PMC free article] [PubMed] [Google Scholar]
- Tsao DY, Schweers N, Moeller S, Freiwald WA, 2008b. Patches of face-selective cortex in the macaque frontal lobe. Nat. Neurosci 11, 877–879 https://doi.org/nn.2158. [DOI] [PMC free article] [PubMed] [Google Scholar]
- Tsao DY, Vanduffel W, Sasaki Y, Fize D, Knutsen TA, Mandeville JB, Wald LL, Dale AM, Rosen BR, Van Essen DC, Livingstone MS, Orban GA, Tootell RBH, 2003b. Stereopsis activates V3A and caudal intraparietal areas in macaques and humans. Neuron 39, 555–568 https://doi.org/12895427. [DOI] [PubMed] [Google Scholar]
- Uhrig L, Dehaene S, Jarraya B, 2014. A hierarchy of responses to auditory regularities in the macaque brain. J. Neurosci 34, 1127–1132 10.1523/JNEUROSCI.3165-13.2014. [DOI] [PMC free article] [PubMed] [Google Scholar]
- Uhrig L, Sitt JD, Jacob A, Tasserie J, Barttfeld P, Dupont M, Dehaene S, Jarraya B, 2018. Resting-state dynamics as a cortical signature of anesthesia in monkeys. Anesthesiology 129, 942–958 10.1097/ALN.0000000000002336. [DOI] [PubMed] [Google Scholar]
- Valdés-Sosa M, Ontivero-Ortega M, Iglesias-Fuster J, Lage-Castellanos A, Gong J, Luo C, Castro-Laguardia AM, Bobes MA, Marinazzo D, Yao D, 2020. Objects seen as scenes: neural circuitry for attending whole or parts. Neuroimage 210, 116526 10.1016/j.neuroimage.2020.116526. [DOI] [PubMed] [Google Scholar]
- van Baar JM, Chang LJ, Sanfey AG, 2019. The computational and neural substrates of moral strategies in social decision-making. Nat. Commun 10, 1483 10.1038/s41467-019-09161-6. [DOI] [PMC free article] [PubMed] [Google Scholar]
- Van Dromme IC, Premereur E, Verhoef B−E, Vanduffel W, Janssen P, 2016. Posterior parietal cortex drives inferotemporal activations during three-dimensional object vision. PLOS Biol. 14, e1002445 10.1371/journal.pbio.1002445. [DOI] [PMC free article] [PubMed] [Google Scholar]
- Van Dromme ICL, Vanduffel W, Janssen P, 2015. The relation between functional magnetic resonance imaging activations and single-cell selectivity in the macaque intraparietal sulcus. Neuroimage 113, 86–100 10.1016/j.neuroimage.2015.03.023. [DOI] [PubMed] [Google Scholar]
- Van Essen DC, 1997. A tension-based theory of morphogenesis and compact wiring in the central nervous system. Nature 385, 313–318 10.1038/385313a0. [DOI] [PubMed] [Google Scholar]
- Van Essen DC, Donahue C, Dierker DL, Glasser MF, 2016. Parcellations and connectivity patterns in human and macaque cerebral cortex. In: Kennedy H, Van Essen DC, Christen Y (Eds.), Micro-, Meso- and Macro-Connectomics of the Brain (Eds.). Springer, Cham (CH). [PubMed] [Google Scholar]
- Van Essen DC, Donahue CJ, Coalson TS, Kennedy H, Hayashi T, Glasser MF, 2019. Cerebral cortical folding, parcellation, and connectivity in humans, nonhuman primates, and mice. Proc. Natl. Acad. Sci. U. S. A 10.1073/pnas.1902299116. [DOI] [PMC free article] [PubMed] [Google Scholar]
- Van Essen DC, Glasser MF, 2018. Parcellating cerebral cortex: how invasive animal studies inform noninvasive mapmaking in humans. Neuron 99, 640–663 10.1016/j.neuron.2018.07.002. [DOI] [PMC free article] [PubMed] [Google Scholar]
- Vanduffel W, Fize D, Mandeville JB, Nelissen K, Van Hecke P, Rosen BR, Tootell RB, Orban GA, 2001. Visual motion processing investigated using contrast agent-enhanced fMRI in awake behaving monkeys. Neuron 32, 565–577 https://doi.org/11719199. [DOI] [PubMed] [Google Scholar]
- Vanduffel W, Fize D, Peuskens H, Denys K, Sunaert S, Todd JT, Orban GA, 2002. Extracting 3D from motion: differences in human and monkey intraparietal cortex. Science 298, 413–415 https://doi.org/12376701. [DOI] [PubMed] [Google Scholar]
- Vanduffel W, Zhu Q, Orban GA, 2014. Monkey cortex through fMRI glasses. Neuron 83, 533–550 10.1016/j.neuron.2014.07.015. [DOI] [PMC free article] [PubMed] [Google Scholar]
- Vogels R, Saunders RC, Orban GA, 1994. Hemispheric lateralization in rhesus monkeys can be task-dependent. Neuropsychologia 32, 425–438 10.1016/0028-3932(94)90088-4. [DOI] [PubMed] [Google Scholar]
- Wang L, Uhrig L, Jarraya B, Dehaene S, 2015. Representation of numerical and sequential patterns in macaque and human brains. Curr. Biol 0 10.1016/j.cub.2015.06.035. [DOI] [PubMed] [Google Scholar]
- Wang L, Zuo S, Cai Y, Zhang B, Wang H, Zhou Y, Kwok SC, 2020. Fallacious reversal of event-order during recall reveals memory reconstruction in rhesus monkeys. Behav. Brain Res 394, 112830 10.1016/j.bbr.2020.112830. [DOI] [PubMed] [Google Scholar]
- Wang Y, Celebrini S, Trotter Y, Barone P, 2008. Visuo-auditory interactions in the primary visual cortex of the behaving monkey: electrophysiological evidence. BMC Neurosci 9, 79 10.1186/1471-2202-9-79. [DOI] [PMC free article] [PubMed] [Google Scholar]
- Wardak C, Guipponi O, Pinède S, Ben Hamed S, 2016. Tactile representation of the head and shoulders assessed by fMRI in the nonhuman primate. J. Neurophysiol 115, 80–91 10.1152/jn.00633.2015. [DOI] [PMC free article] [PubMed] [Google Scholar]
- Wardak C, Vanduffel W, Orban GA, 2010. Searching for a salient target involves frontal regions. Cereb. Cortex N. Y. N 1991 20, 2464–2477 10.1093/cercor/bhp315. [DOI] [PubMed] [Google Scholar]
- Warriner AB, Kuperman V, Brysbaert M, 2013. Norms of valence, arousal, and dominance for 13,915 English lemmas. Behav. Res. Methods 45, 1191–1207 10.3758/s13428-012-0314-x. [DOI] [PubMed] [Google Scholar]
- Wen H, Shi J, Zhang Y, Lu K−H, Cao J, Liu Z, 2018. Neural encoding and decoding with deep learning for dynamic natural vision. Cereb Cortex 28 (12), 4136–4160 10.1093/cercor/bhx268. [DOI] [PMC free article] [PubMed] [Google Scholar]
- Wittmann MK, Fouragnan E, Folloni D, Klein-Flügge MC, Chau BKH, Khamassi M, Rushworth MFS, 2020. Global reward state affects learning and activity in raphe nucleus and anterior insula in monkeys. Nat. Commun 11, 3771 10.1038/s41467-020-17343-w. [DOI] [PMC free article] [PubMed] [Google Scholar]
- Xu T, Falchier A, Sullivan EL, Linn G, Ramirez JSB, Ross D, Feczko E, Opitz A, Bagley J, Sturgeon D, Earl E, Miranda-Domínguez O, Perrone A, Craddock RC, Schroeder CE, Colcombe S, Fair DA, Milham MP, 2018. Delineating the macroscale areal organization of the macaque cortex in vivo. Cell Rep. 23, 429–441 10.1016/j.celrep.2018.03.049. [DOI] [PMC free article] [PubMed] [Google Scholar]
- Yang P−F, Wu R, Wu T−L, Shi Z, Chen LM, 2018. Discrete modules and mesoscale functional circuits for thermal nociception within primate S1 cortex. J. Neurosci. Off. J. Soc. Neurosci 38, 1774–1787 10.1523/JNEUROSCI.2795-17.2017. [DOI] [PMC free article] [PubMed] [Google Scholar]
- Zhu Q, Nelissen K, Van den Stock J, De Winter F−L, Pauwels K, de Gelder B, Vanduffel W, Vandenbulcke M, 2013. Dissimilar processing of emotional facial expressions in human and monkey temporal cortex. Neuroimage 66, 402–411 10.1016/j.neuroimage.2012.10.083. [DOI] [PMC free article] [PubMed] [Google Scholar]
- Zhu Q, Spronk M, Vanduffel W, 2015. Functional correspondence between human and monkey face-selective regions in processing face configuration. Present. Soc. Neurosci 2015 Chic. USA. [Google Scholar]
- Zhu Q, Vanduffel W, 2019. Submillimeter fMRI reveals a layout of dorsal visual cortex in macaques, remarkably similar to New World monkeys. Proc. Natl. Acad. Sci. U. S 116, 2306–2311 10.1073/pnas.1805561116. [DOI] [PMC free article] [PubMed] [Google Scholar]
- Zuo S, Wang L, Shin JH, Cai Y, Zhang B, Lee SW, Appiah K, Zhou Y, Kwok SC, 2020. Behavioral evidence for memory replay of video episodes in the macaque. Elife 9 10.7554/eLife.54519. [DOI] [PMC free article] [PubMed] [Google Scholar]
Associated Data
This section collects any data citations, data availability statements, or supplementary materials included in this article.