Abstract
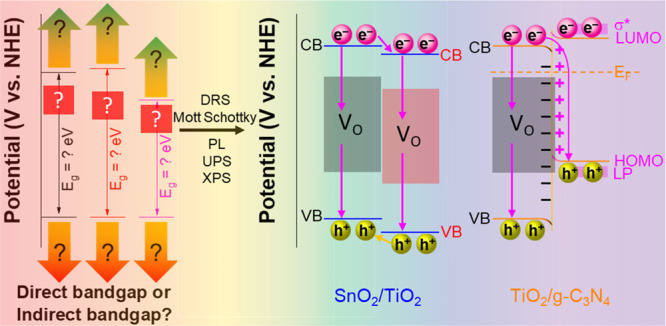
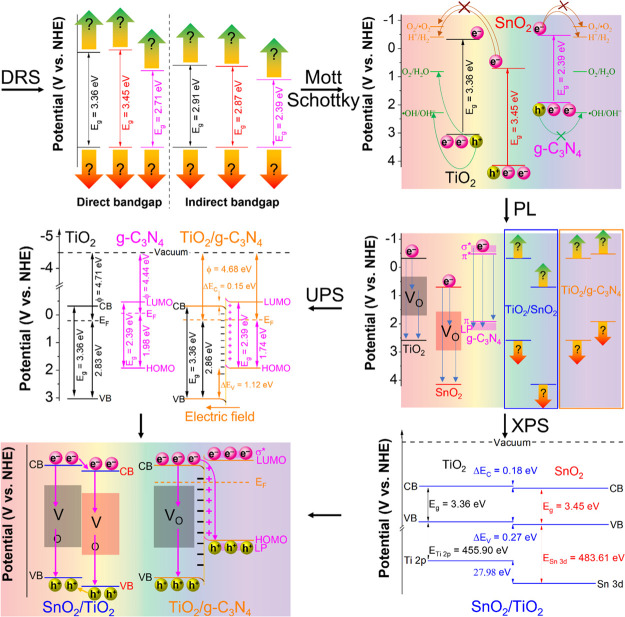
Photocatalysis has been studied and considered as a green and practical approach in addressing environmental pollution. However, factors that affect photocatalytic performance have not been systematically studied. In this work, we have presented a comprehensive roadmap for characterizing, interpreting, and reporting semiconductors’ electrical and optical properties through routinely used techniques such as diffuse reflectance spectroscopy, electrochemical techniques (Mott–Schottky plots), photoluminescence, X-ray photoelectron spectroscopy, and ultraviolet photoelectron spectroscopy in the context of photocatalysis. Having precisely studied the band structure of three representative photocatalysts, we have presented and highlighted the essential information and details, which are critical and beneficial for studies of (1) band alignments, (2) redox potentials, and (3) defects. Further works with a comprehensive understanding of the band structure are desirable and hold great promise.
1. Introduction
Global warming has been becoming increasingly severe and has triggered extreme concerns across the globe. It comes from environmental pollution, including air, soil, and water pollution.1 In the scientific domain, environmental pollution alters the environment’s chemical, physical, and biological nature; it is the reason for an estimated 12.6 million deaths each year.2,3 Thus, finding new technologies and methods to address environmental pollution is critical. Various methods are performed to address pollutants, including ion exchange, flotation, media filtration, centrifugation, and adsorption approaches. However, there are limitations due to high operating costs, low efficiency, poor recyclability, and toxic by-products.4,5
Photocatalysis has been studied and considered a green and effective approach in addressing environmental pollution.5−7 Photocatalysis has attracted attention for its versatility in the environment and energy sectors. In the environmental field, photocatalysts can be used to remove pollutants in the air and water. The photocatalytic process can eliminate the total toxicity with products of CO2, water, and other fewer substances.6,8−10 In the energy field, photocatalysts can generate alternative fuels such as H2, O2, and bioethanol via water splitting or reducing CO2.11−14 In the photocatalytic process, photocatalysts are activated by a suitable light source to induce photocatalytic reactions. The use of light gives photocatalytic technology a significant advantage compared to other waste treatment methods such as adsorption or filtration. However, the catalysts’ optical and electrical properties and photocatalytic mechanisms are not paid the needed attention compared to the sole efficiency.15 This causes difficulties in understanding the mechanism of decomposition of pollutants and future photocatalytic applications.
This work highlights key techniques to study the optical and electrical properties in reporting photocatalysis. In addition, the current mistakes and inconsistencies in interpreting these properties are presented and revised, such as incorrect usage of Kubelka–Munk/Tauc equations, incorrect transformation of wavelength to energy, and incorrect evaluation of band gap of materials. Here, TiO2, g-C3N4, and SnO2 are used as examples because TiO2 is the most studied photocatalyst (accounting for 52.5% of studies in this field, Web of Science, March 2021), g-C3N4 is an emerging nonmetallic photocatalyst (7.8%), and SnO2 is an emerging photocatalyst (1.6%). The attraction toward them is increased by recent works focusing on combining them with molybdenum disulfide,16 nanodiamond,17 and graphene oxide18 for applying in the environmental field. The band gaps of TiO2, SnO2, and g-C3N4 are determined by diffuse reflectance spectroscopy (DRS), and hence choosing the compatible light source becomes more straightforward. The conduction band (CB) positions and the valence band (VB) positions, which determine the redox abilities, are obtained by the Mott–Schottky technique. The supporting states in the band gap of the materials are investigated by photoluminescence (PL). The band structure of their composites is studied by X-ray photoelectron spectroscopy (XPS) and ultraviolet photoelectron spectroscopy (UPS). The understanding of optical and electrical features of photocatalysts not only supports research expansion into new materials/composites but also enables researchers to design wastewater or air pollution treatment systems with the suitable operation time, area, light source, and conditions, which helps to optimize the photocatalytic activity of photocatalysts and systems.
2. Results and Discussion
2.1. DRS Analysis
It is essential to know the band gap energy to determine the right light source for activating photocatalysis. The photon energy should be higher than the band gap energy of the photocatalyst to generate electron–hole pairs. The DRS is often used to determine the band gap energy of photocatalysts. DRS results are plotted with reflectance or absorbance as the vertical axis versus wavelength as the horizontal axis. To determine the band gap, eq 1 is used to transform wavelength into energy as a new horizontal axis. The Tauc equation (eq 2) and Kubelka Munk equation (eq 3) transform the absorbance and reflectance into a new vertical axis, respectively.19−21 The parameters of these equations are calculated as eqs 4–8. The band gap energy is determined by the tangent of the plot with the horizontal axis. It is helpful for single-component photocatalysts and heterojunctions.22−24 However, the absorbance should not be converted into reflectance or vice versa by eq 9 or 10 due to the significant change of band gap energy. Also, photocatalysts with similar band gap energies could behave differently. This shows that the photocatalytic behaviors depend not only on the band gap value but also on the positions of the CB and VB of materials in the redox potential scale, which DRS cannot determine. The following sections will explain these phenomena and discuss the band structure of photocatalysts.
| 1 |
| 2 |
| 3 |
| 4 |
| 5 |
| 6 |
| 7 |
| 8 |
| 9 |
| 10 |
where E is the photon energy (eV), h is Planck’s constant (4.132 × 10⁻¹⁵ eV·s), ν is the frequency (s–1), c is the photon velocity (nm), λ is the wavelength (nm), α is the absorption coefficient from the absorption mode, B is constant, and Eg is the band gap (eV), A is the absorbance value, l is the sample width (cm), R is the reflectance value, K is the absorption coefficient from the reflectance mode, and S is the scattering coefficient from the reflectance mode. For direct and indirect band gaps, r is equal to 2 and 1/2, respectively.
Figure 1a shows the absorbance of TiO2, SnO2, and g-C3N4. Determining the band gap by absorbance plots is insufficient because it cannot determine whether the band gap is direct or indirect. Moreover, the determined band gap is inconsistent with the theoretical results. So, the Tauc eq 2 should be used to determine the direct band gaps and indirect band gaps via the tangent of Tauc plots of (αhν)2 versus energy (Figure 1b) and (αhν)1/2 versus energy (Figure 1c). The direct band gaps are higher than the indirect band gaps for all materials. Figure 1d shows the band gaps of TiO2 (3.36 eV for direct band gap and 2.91 eV for indirect band gap), SnO2 (3.45 and 2.87 eV), and g-C3N4 (2.71 and 2.39 eV). Although it is not yet possible to choose between direct or indirect band gaps, knowing in advance the maximum possible band gap also helps choose the light source. Choosing the right band gaps and determining the band gap positions that affect the photocatalysts’ redox abilities are discussed in the next section.
Figure 1.
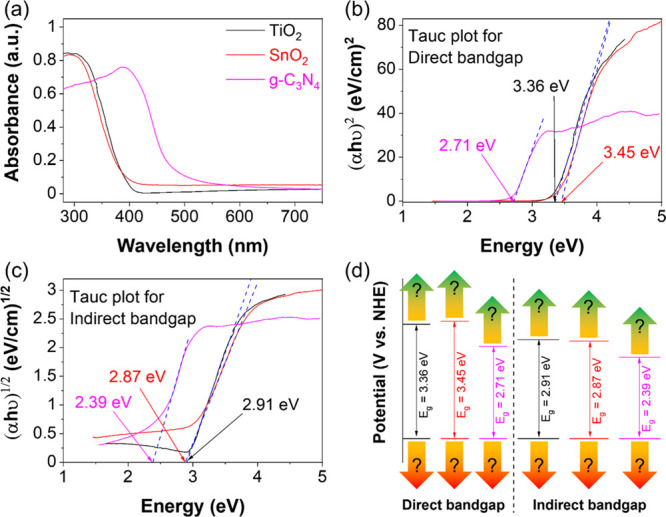
DRS spectra (a). Tauc plots of (αhν)2 vs energy (b) and (αhν)1/2 vs energy (c) of TiO2, SnO2, and g-C3N4. Direct and indirect band gaps of materials (d). DRS spectra cannot determine the positions of the CB and VB of materials.
2.2. Mott–Schottky Plot Techniques
Photocatalysts having the same band gap behave
differently because
the position in the redox potential scale of the CB minimum (CBM)
and VB maximum (VBM) determines their redox ability. In previous reports,
the Mott–Schottky technique is used to determine the CB position
in the redox potential scale. For the Mott–Schottky technique,
the apparent capacitance is measured as a function of potential and
by eq 11.25,26 The CBM can be determined by extrapolation of C = 0. The obtained CBM value is versus the reference electrode and
conductive media. The most populated reference electrodes are the
calomel electrode (Hg2Cl2/Hg, Cl–), normal hydrogen electrode (NHE) (H+/H2),
and silver–silver chloride electrode (Ag/AgCl). The conductive
media is often KCl with a concentration of 0.1, 1, 3.5 M, or saturation.
However, the reports should obtain a CBM level versus NHE via converting
CBM level versus different electrode and media systems by eq 12 to reach consistency
in studies. Combining this result with the band gap energy from DRS,
the VBM versus NHE can be determined. These understandings could help
investigate and choose the right applications for photocatalysts because
excited electrons must move from the CB to lower redox potentials,
and holes must move from the VB to higher redox potentials. The redox
potentials for various species and their change to pH via the Nernst
equation (eq 13) were
thoroughly reviewed by Li et al. in 2016.27 For water splitting, photocatalysts with CBM lower than −0.41
V versus NHE ( , pH
= 7) are facilitated to reduce H2O into H2,
while photocatalysts with VBM higher
than 0.82 V versus NHE (
 , pH = 7) are facilitated to oxidize H2O into O2. For environmental application, photocatalysts
with CBM lower than −0.78 V versus NHE (•OH/OH– pH = 7) and VBM higher than 2.28 V versus
NHE (
 , pH = 7) are favored because they
can produce •O2 and •OH radicals to
degrade pollutants. In addition, with the simplest approach, the CB
and VB of photocatalysts are considered shifting at the same magnitude
but in opposite directions in heterojunctions.
| 11 |
| 12 |
| 13 |
where CSC is the space charge capacitance, e is the electron charge (F·cm–2), ε is the dielectric constant of reaction, ε0 is the vacuum permittivity, N is the number of donors, k is Boltzmann constant, T is the experiment temperature (K), and A is the surface area of the electrode in contact with the electrolyte (cm). E is the applied potential (V). EFB is estimated by extrapolating a linear fit of the MS plot to obtain the x-intercept (V). c values are shown in Table 1. kT/e is about 0.0257 V at 25 °C.
Table 1. c Values for Conversion of the Applied Potential Versus Different Electrodes to Versus NHE.
| electrode | c (V) | references |
|---|---|---|
| Hg/Hg2Cl2, KCl 0.1 M | 0.334 | (28) |
| Hg/Hg2Cl2, KCl 1 M | 0.280 | (28) |
| Hg/Hg2Cl2, KCl 3.5 M | 0.250 | (29) |
| Hg/Hg2Cl2, KCl saturated | 0.241 | (28) |
| Hg/Hg2Cl2, NaCl saturated | 0.236 | (30) |
| Ag/AgCl, KCl 0.1 M | 0.288 | (28) |
| Ag/AgCl, KCl 3 M | 0.210 | (31) |
| Ag/AgCl, KCl 3.5 M | 0.205 | (32, 33) |
| Ag/AgCl, KCl saturated | 0.199 | (32) |
| Ag/AgCl, NaCl 3 M | 0.209 | (28) |
| Ag/AgCl, NaCl saturated | 0.197 | (28) |
Figure 2a displays the Mott–Schottky plots of TiO2, SnO2, and g-C3N4. The linear potential parts of Mott–Schottky plots are used to determine the CBM position of TiO2, SnO2, and g-C3N4, which are calculated as −0.55, 0.51, and −0.51 eV versus Ag/AgCl electrode, respectively. As shown in Figure 2b, the typical values for the CBM position of materials are converted from unit V versus Ag/AgCl to V versus NHE (eq 12) for easy comparison of the future. Combining with DRS results and previous studies on the band gap types of TiO2, SnO2, and g-C3N4, the band alignment is illustrated in Figure 2c. When receiving enough excitation energy, the photogenerated electrons move from the VB to CB and reduce absorbed oxygen (or H+) on the surface to •O2 radicals (or H2). Although the CB and VB positions have a lower potential than the potential of O2/•O2 and •OH/OH–, previous reports also recorded reactions caused by these free radicals. It could be due to the states in the band gap, which are discussed in the next section.
Figure 2.
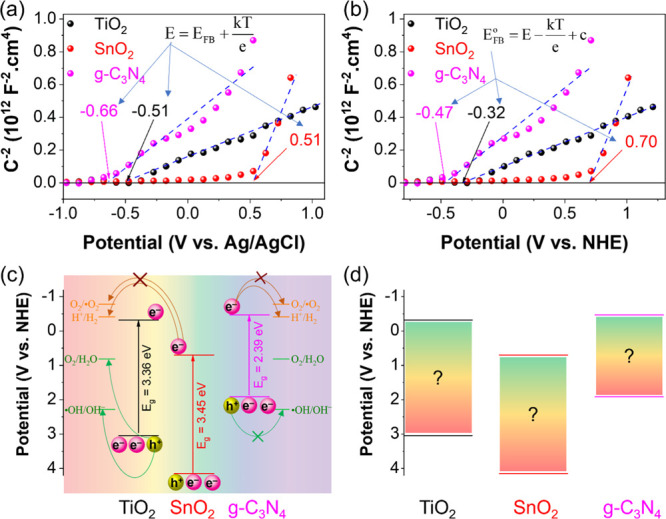
Mott–Schottky plots vs Ag/AgCl reference electrode (a) and vs normal hydrogen electrode (b) of TiO2, SnO2, and g-C3N4. Band positions of materials (c). The combination of DRS spectra and Mott–Schottky cannot determine the supporting states in the band gap of materials (d).
2.3. PL Spectroscopy
Defects in the photocatalysts are among the factors contributing to photocatalytic performance, and they prolong the lifetime of electron–hole pairs via adding trapping states in the band structure. PL spectroscopy is a solid technique to study these phenomena. The PL results record the emission spectra of electrons from high potentials jumping to low potentials.34 A higher PL intensity might reflect high recombination of electron–hole pairs resulting in inadequate photocatalytic performance. In addition, the evaluations from theoretical and experimental results have to be used to find the exact states in the band gap.35 However, the representation of PL results is often incorrect leading to incorrect comparisons. In 2013, Mooney and Kambhampati reviewed the proper Jacobian transformations for the quantitative analysis of emission spectra.36 To analyze PL results, first, the wavelength should be transformed into energy by eq 1. Second, this conversion of wavelength to energy should preserve the emission spectra area as eq 15 because the intensity versus energy system (IE) is higher at lower energy and vice versa. In other words, the intensity versus wavelength system (Iλ) should transform into IE as eqs 16 and 17. Third, IE could be calculated as eq 18 or 19 because the minus sign could be ignored without changing the properties of the spectra. Finally, further evaluation of PL results could be conducted by fitting peaks with the Gaussian peak function.
| 14 |
| 15 |
| 16 |
| 17 |
| 18 |
where IE is the signal per energy unit and Iλ is the signal per wavelength unit.
Figure 3 indicates the PL spectra of TiO2, SnO2, and g-C3N4; the spectra undergo Gaussian peak fitting to find component peaks. Figure 3a indicates that TiO2 has three3 peaks at 1.82, 2.26, and 2.91 eV accounting for 20.4, 71.8, and 7.8%, respectively, while the PL peak fitting of SnO2 (Figure 3b) has three peaks at 1.79, 2.03, and 2.86 eV accounting for 41.2, 55.9, and 2.9%, respectively. According to previous studies, these peaks of both TiO2 and SnO2 correspond to their instinct oxygen vacancies, which impact the charge carrier’s separation resulting in a better photocatalytic performance.37 For g-C3N4, its PL peak fitting (Figure 3c) shows three peaks at 2.48, 2.69, and 2.84 eV corresponding to the transition of electrons from π* to π, from π* to lone pairs (LP), and from σ to LP, respectively. The position and role of these transitions are illustrated in Figure 3d. Obviously, with the DRS, Mott–Schottky plots, and PL, the basic properties of the pure TiO2, SnO2, and g-C3N4 are being clarified. The next sections describe the changes of band alignment for the composites between them.
Figure 3.
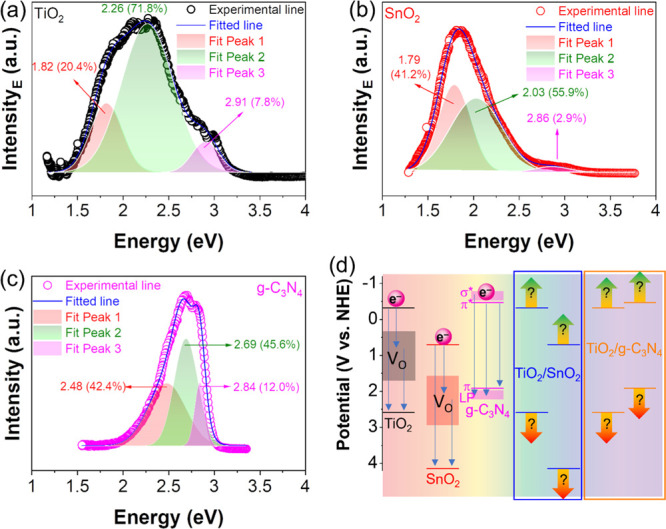
PL peak fitting of TiO2 (a), SnO2 (b), and g-C3N4 (c). Band gap states of TiO2, SnO2, and g-C3N4 (d). The combination of DRS spectra, Mott–Schottky, and PL cannot determine the changes in the band structure when materials are combined.
2.4. XPS
For determining the composition of the photocatalysts, XPS is well known as a powerful tool, but another application of XPS that should be considered is to determine the band offset of heterojunctions.38−43 Compared to the mentioned approach of Mott–Schottky, evaluating band shifting with XPS is more accurate because XPS records the elements’ core levels, which are more stable than the surface value. In other words, the VB offset could be accurately determined when the deviation of the core levels before and after contact is measured. The VB offset is calculated as eq 20 or 21, so the CB is calculated as eq 22.41 The exact position of the band structure versus NHE is useful in studying and applying for suitable applications, as mentioned above.
| 19 |
| 20 |
| 21 |
when ΔEV is the VB offset (eV) and ΔEC is the CB offset (eV).
Figure 4a,b shows the XPS results and band alignment of SnO2/TiO2. The VB edges of pure TiO2 and SnO2 are 2.70 and 3.21, as shown in Figure 4c,d, respectively. When SnO2 and TiO2 are combined, there are shifts in core levels of Ti 2p and Sn 3d. If only DRS and Mott–Schottky are deployed, these shifts cannot be determined (Figure 4e). These shifts in core levels could be used to determine the VB offset and CB offset (eqs 20–22) (Figure 4f). Comparing before and after contact, the VB and CB offsets decrease when SnO2 and TiO2 are in contact. These results could be due to the transfer of electrons from TiO2 (band structure goes down) to SnO2 (band structure goes up). The following section will explain this transfer.
Figure 4.
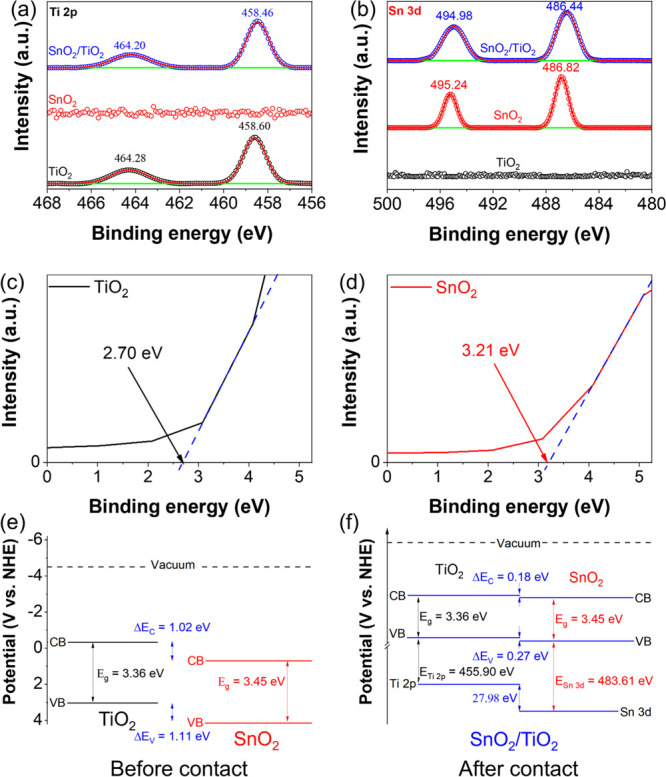
HR-XPS of Ti 2p (a) and Sn 3d (b) components of TiO2, SnO2, and SnO2/TiO2. VB edge spectra of TiO2 (c) and SnO2 (d). Band alignment of materials before contact (e) and after contact (f). Adapted with permission from ref (44). Copyright 2019, with permission from Elsevier.
2.5. UPS
Fermi energy level (EF) is an important part of the band structure; it helps determine the semiconductor type of photocatalysts and predicts the transport of electrons in heterojunctions. UPS is the technique of recording the VB and EF of photocatalysts. For UPS results, the EF is located at 0 eV, and the intersection of horizontal axis and spectra tangent is the relative VB position. Combining with the above techniques, the band structure of photocatalyst with CB, VB, EF, and trapping states versus NHE can be revealed. In addition, the work function (φ) can be directly determined by eq 23.45 The work function equals the difference between vacuum energy (Evacuum, at 4.5 V vs NHE) and EF (eq 23). Thus, UPS can be used to confirm consistency between the results. In addition, when photocatalysts are combined to fabricate heterojunction photocatalysts, there is transport of electrons from photocatalysts with lower work function to photocatalysts with higher work function. This transport can induce internal electric fields to support or prevent further transport of excited electrons of heterojunction photocatalysts under light irradiation. This is the explanation for the existence of type-II, Z-scheme, and S-scheme photocatalysts.23
| 22 |
| 23 |
The UPS results of TiO2, g-C3N4, and TiO2/g-C3N4 in Figure 5a reveal the relative positions of highest occupied molecular orbital and VB to EF of them. Combining with DRS and Mott–Schottky results, the work function of these materials can be calculated by the difference between the vacuum level and EF. The electrons will transfer from the material having the lower work function (g-C3N4) to the material having the higher work function (TiO2) to balance the EF. This is consistent with the work function of TiO2/g-C3N4 in Figure 5a. The band alignment of materials before and after contact is shown in Figure 5b. Due to the transfer of electrons from g-C3N4 to TiO2, the band is bending, and an electric field is formed at the interface of TiO2/g-C3N4. This is a direct method for confirming the latest type of photocatalysts, known as Z-Scheme and S-Scheme.
Figure 5.
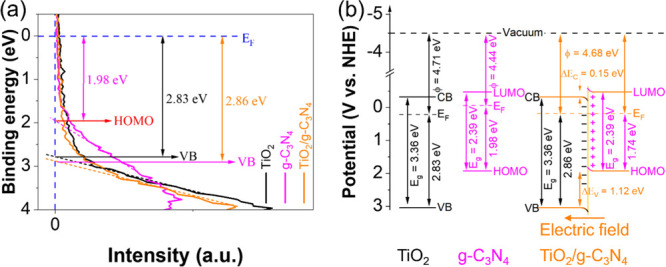
UPS of TiO2, g-C3N4, and TiO2/g-C3N4 (a). Reprinted from ref (46) Copyright 2019, with permission from IOP Publisher, UK. Band alignment of materials before contact and after contact (b).
From the above analyses, the procedure for determining the band structure of semiconductors is illustrated in Figure 6. Therein, the DRS and PL measurements should be first conducted to estimate the band gap of semiconductors. After that, the Mott–Schottky plots and UPS measurements are used to determine the CBM and VBM of semiconductors, respectively. The change of the band structure and charge transfer pathways of semiconductors after contacting, for instance, SnO2/TiO2, is also indicated as in Figure 6. By this approach, the photocatalytic mechanism of semiconductors is easily determined for the detailed cases.
Figure 6.
Procedure illustration for determining the band structure of semiconductors via DRS, Mott–Schottky, PL, XPS, and UPS analyses.
3. Conclusions
Semiconductor photocatalysts are being extensively studied for energy and environmental settings because of their high efficiency and sustainability. Despite their remarkable progress, most current photocatalysts are inherently shortcoming to become the cornerstone and convincingly lead the field forward. Previous studies solely focus on photocatalysts’ efficiency, which fails to consider the fundamental properties that greatly influence the reported photocatalytic performance. Such properties concern the structure and arrangement of the photocatalysts’ band gap, which establishes the redox ability, the lifespan of the free radicals, the activation energy, and the applications. The highlights and perspectives for future work are described as follows:
-
(1)
Band gap energies determine the light source for activating photocatalysts. The DRS should be used to determine the band gap energy of photocatalysts.
-
(2)
Positions of CBM and VBM determine the redox ability. The Mott–Schottky technique is used to determine the CB position. Combining with the band gap from DRS, the VB position is also determined.
-
(3)
Defects in the photocatalysts contribute to photocatalytic performance; they prolong the lifetime of electron–hole pairs via adding trapping states in the band structure. The PL results record the emission spectra of electrons from high potentials jumping to low potentials (trapping states). Combining with the VB and CB positions from Mott–Schottky, the trapping positions are determined.
-
(4)
Compared to the mentioned approach of Mott–Schottky, evaluating band shifting with XPS is more accurate because XPS records the elements’ core levels, which are more stable than the surface value. XPS should be considered to determine the band offset of heterojunctions.
-
(5)
Fermi energy level (EF) may determine the semiconductor type of photocatalysts and predict the transport of electrons in heterojunctions. UPS is the technique of recording the VB and EF of photocatalysts.
4. Experimental Section
4.1. Preparation of Materials
TiO2 nanotubes were synthesized by a hydrothermal method from commercial TiO2 powder and NaOH in an autoclave at 135 °C for 24 h, according to our previous study.37 SnO2 nanoparticles were synthesized by a hydrothermal method from the SnCl4·5H2O precursor and hydrazine hydrate (N2H4·H2O) in pH 12 medium in an autoclave at 135 °C for 24 h, according to our previous study.47 For the synthesis of g-C3N4, we annealed melamine (C3H6N6) in the muffle furnace with the ramping rate of 2 °C/min at 550 °C for 4 h. SnO2/TiO2 was synthesized via mixing precursors for 15 wt % SnO2 nanoparticles into precursors for TiO2 nanotubes in one autoclave before undergoing the hydrothermal method at 135 °C for 24 h. TiO2/g-C3N4 was synthesized via mixing 2 wt % of TiO2 nanotubes into melamine for 6 h before annealing at 550 °C for 2 h with the ramp rate of 2 °C per min.
4.2. Characterization of Materials
The formation of materials (TiO2, SnO2, and g-C3N4) was confirmed by wide typical analyses such as X-ray diffraction pattern, Fourier transform infrared spectra, transmission electron microscopy, and scanning electron microscopy. All characterizations were reported in refs (44, 46, 48−50). Besides, other characterizations include the following: the DRS spectra were recorded using a Jasco V-670 spectrometer using an integrated sphere method; Mott–Schottky plots were conducted for the semiconductor films and recorded with an electrochemical workstation (BioLogic SP-240). Therein, the semiconductor film is a working electrode and two electrodes include a Pt wire counter electrode and an Ag/AgCl reference electrode (3 M KCl, 0.21 V vs NHE); PL spectra were recorded at room temperature by a Horiba Jobin-Yvon Nanolog spectrophotometer equipped with a Xe lamp as the excitation source wavelength of 325 nm; XPS with an Al Kα monochromatic beam (1486.6 eV, a step size of 0.4 eV, the error of 0.05 eV, Escalab250, Theta Probe XPS system) and UPS characterization with a He (I) beam source (21.21 eV) were performed to investigate the oxidation states and VBM of the materials, respectively.
Acknowledgments
The authors acknowledge the support of Prof. Sheng-Jie You, Prof. Ya-Fen Wang, and Prof. Yong Soo Kim for the XPS and UPS measurements.
The authors declare no competing financial interest.
References
- UN Strategy for Sustainability Management in the UN System 2020–2030, 2019.
- WHO . An Estimated 12.6 Million Deaths Each Year are Attributable to Unhealthy Environments, 2016.
- Poyatos J. M.; Muñio M.; Almecija M.; Torres J.; Hontoria E.; Osorio F. Advanced Oxidation Processes for Wastewater Treatment: State of the Art. Water, Air, Soil Pollut. 2010, 205, 187. 10.1007/s11270-009-0065-1. [DOI] [Google Scholar]
- Zhang X.; Han Y.; Gao P.; Li Y. Effects of Grinding Media on Grinding Products and Flotation Performance of Chalcopyrite. Miner. Eng. 2020, 145, 106070. 10.1016/j.mineng.2019.106070. [DOI] [Google Scholar]
- Anantha M. S.; Olivera S.; Hu C.; Jayanna B. K.; Reddy N.; Venkatesh K.; Muralidhara H. B.; Naidu R. Comparison of The Photocatalytic, Adsorption and Electrochemical Methods for The Removal of Cationic Dyes from Aqueous Solutions. Environ. Technol. Innovation 2020, 17, 100612. 10.1016/j.eti.2020.100612. [DOI] [Google Scholar]
- Byrne C.; Subramanian G.; Pillai S. C. Recent Advances in Photocatalysis for Environmental Applications. J. Environ. Chem. Eng. 2018, 6, 3531–3555. 10.1016/j.jece.2017.07.080. [DOI] [Google Scholar]
- Al-Rasheed R. A.Water Treatment by Heterogeneous Photocatalysis An Overview. 4th SWCC acquired Experience Symposium held in Jeddah, 2005; pp 1–14.
- Van Viet P.; Nguyen T.-D.; Bui D.-P.; Thi C. M.. Combining SnO2-x and g-C3N4 Nanosheets Toward S-Scheme Heterojunction for High Selectivity into Green Products of NO Degradation Reaction under Visible Light. J. Materiomics 2021. 51. 10.1016/j.jmat.2021.06.006 [DOI] [Google Scholar]
- Truong T. K.; Nguyen T. Q.; Phuong La H. P.; Le H. V.; Van Man T.; Cao T. M.; Van Pham V. Insight into The Degradation of p-nitrophenol by Visible-Light-Induced Activation of Peroxymonosulfate over Ag/ZnO Heterojunction. Chemosphere 2021, 268, 129291. 10.1016/j.chemosphere.2020.129291. [DOI] [PubMed] [Google Scholar]
- Huang H.; Pradhan B.; Hofkens J.; Roeffaers M. B. J.; Steele J. A. Solar-Driven Metal Halide Perovskite Photocatalysis: Design, Stability, and Performance. ACS Energy Lett. 2020, 5, 1107–1123. 10.1021/acsenergylett.0c00058. [DOI] [Google Scholar]
- Jiang L.; Wang Y.; Feng C. Application of Photocatalytic Technology in Environmental Safety. Procedia Eng. 2012, 45, 993–997. 10.1016/j.proeng.2012.08.271. [DOI] [Google Scholar]
- He F.; Zhu B.; Cheng B.; Yu J.; Ho W.; Macyk W. 2D/2D/0D TiO2/C3N4/Ti3C2 MXene Composite S-Scheme Photocatalyst with Enhanced CO2 Reduction Activity. Appl. Catal., B 2020, 272, 119006. 10.1016/j.apcatb.2020.119006. [DOI] [Google Scholar]
- Chen Y.; Su F.; Xie H.; Wang R.; Ding C.; Huang J.; Xu Y.; Ye L. One-step Construction of S-scheme Heterojunctions of N-doped MoS2 and S-doped g-C3N4 for Enhanced Photocatalytic Hydrogen Evolution. Chem. Eng. J. 2021, 404, 126498. 10.1016/j.cej.2020.126498. [DOI] [Google Scholar]
- Shi J.; Zheng B.; Mao L.; Cheng C.; Hu Y.; Wang H.; Li G.; Jing D.; Liang X. MoO3/g-C3N4 Z-scheme (S-scheme) System Derived from MoS2/Melamine Dual Precursors for Enhanced Photocatalytic H2 Evolution Driven by Visible Light. Int. J. Hydrogen Energy 2021, 46, 2927. 10.1016/j.ijhydene.2020.04.216. [DOI] [Google Scholar]
- Liu Y.; Wang H.; Yuan X.; Wu Y.; Wang H.; Tan Y. Z.; Chew J. W. Roles of Sulfur-Edge Sites, Metal-Edge Sites, Terrace Sites, and Defects in Metal Sulfides for Photocatalysis. Chem. Catal. 2021, 1, 44. 10.1016/j.checat.2021.01.002. [DOI] [Google Scholar]
- Hunge Y. M.; Yadav A. A.; Kang S. W.; Kim H. Photocatalytic Degradation of Tetracycline Antibiotics Using Hydrothermally Synthesized Two-Dimensional Molybdenum Disulfide/Titanium Dioxide Composites. J. Colloid Interface Sci. 2022, 606, 454–463. 10.1016/j.jcis.2021.07.151. [DOI] [PubMed] [Google Scholar]
- Hunge Y. M.; Yadav A. A.; Khan S.; Takagi K.; Suzuki N.; Teshima K.; Terashima C.; Fujishima A. Photocatalytic Degradation of Bisphenol A Using Titanium Dioxide@Nanodiamond Composites under UV Light Illumination. J. Colloid Interface Sci. 2021, 582, 1058–1066. 10.1016/j.jcis.2020.08.102. [DOI] [PubMed] [Google Scholar]
- Hunge Y. M.; Yadav A. A.; Dhodamani A. G.; Suzuki N.; Terashima C.; Fujishima A.; Mathe V. L. Enhanced Photocatalytic Performance of Ultrasound Treated GO/TiO2 Composite for Photocatalytic Degradation of Salicylic Acid under Sunlight Illumination. Ultrason. Sonochem. 2020, 61, 104849. 10.1016/j.ultsonch.2019.104849. [DOI] [PubMed] [Google Scholar]
- Tauc J. Optical Properties and Electronic Structure of Amorphous Ge and Si. Mater. Res. Bull. 1968, 3, 37–46. 10.1016/0025-5408(68)90023-8. [DOI] [Google Scholar]
- Johannes A. Z.; Pingak R. K.; Bukit M.. Tauc Plot Software: Calculating Energy Gap Values of Organic Materials Based on Ultraviolet-Visible Absorbance Spectrum. IOP Conference Series: Materials Science and Engineering, 2020; Vol. 823.
- Makuła P.; Pacia M.; Macyk W. How To Correctly Determine the Band Gap Energy of Modified Semiconductor Photocatalysts Based on UV-Vis Spectra. J. Phys. Chem. Lett. 2018, 9, 6814–6817. 10.1021/acs.jpclett.8b02892. [DOI] [PubMed] [Google Scholar]
- Iani I. M.; Teodoro V.; Marana N. L.; Coleto U.; Sambrano J. R.; Simões A. Z.; Teodoro M. D.; Longo E.; Perazolli L. A.; Amoresi A. C.; Aparecida Zaghete M. Cation-Exchange Mediated Synthesis of Hydrogen and Sodium Titanates Heterojunction: Theoretical and Experimental Insights Toward Photocatalyic Mechanism. Appl. Surf. Sci. 2021, 538, 148137. 10.1016/j.apsusc.2020.148137. [DOI] [Google Scholar]
- Xu Q.; Zhang L.; Cheng B.; Fan J.; Yu J. S-Scheme Heterojunction Photocatalyst. Chem 2020, 6, 1543–1559. 10.1016/j.chempr.2020.06.010. [DOI] [Google Scholar]
- Sharma S.; Dutta V.; Raizada P.; Hosseini-Bandegharaei A.; Thakur V. K.; Kalia S.; Nguyen V.-H.; Singh P. Recent Advances in Silver Bromide-Based Z-scheme Photocatalytic Systems for Environmental and Energy Applications: A review. J. Environ. Chem. Eng. 2021, 9, 105157. 10.1016/j.jece.2021.105157. [DOI] [Google Scholar]
- Gelderman K.; Lee L.; Donne S. W. Flat-Band Potential of A Semiconductor: Using the Mott–Schottky Equation. J. Chem. Educ. 2007, 84, 685. 10.1021/ed084p685. [DOI] [Google Scholar]
- Mounkachi O.; Salmani E.; Lakhal M.; Ez-Zahraouy H.; Hamedoun M.; Benaissa M.; Kara A.; Ennaoui A.; Benyoussef A. Band-gap Engineering of SnO. Sol. Energy Mater. Sol. Cells 2016, 148, 34–38. 10.1016/j.solmat.2015.09.062. [DOI] [Google Scholar]
- Li X.; Yu J.; Jaroniec M. Hierarchical Photocatalysts. Chem. Soc. Rev. 2016, 45, 2603–2636. 10.1039/c5cs00838g. [DOI] [PubMed] [Google Scholar]
- Meites L. Handbook of Analytical Chemistry. Soil Sci. 1963, 96, 358. 10.1097/00010694-196311000-00019. [DOI] [Google Scholar]
- Zoski C. G.Handbook of Electrochemistry; Elsevier, 2006. [Google Scholar]
- Bard A. J.; Faulkner L. R.. Fundamentals and Applications. Electrochemical Methods; Wiley, 2001; Vol. 2( (482), ), pp 580–632. [Google Scholar]
- Friis E. P.; Andersen J. E. T.; Madsen L. L.; Bonander N.; Møller P.; Ulstrup J. Dynamics of Pseudomonas Aeruginosa Azurin and Its Cys3Ser Mutant at Single-Crystal Gold Surfaces Investigated by Cyclic Voltammetry and Atomic Force Microscopy. Electrochim. Acta 1998, 43, 1114–1122. 10.1016/s0013-4686(98)99006-5. [DOI] [Google Scholar]
- Sawyer D. T.; Sobkowiak A.; Roberts J. L.. Electrochemistry for Chemists; Wiley, 1995. [Google Scholar]
- Yu J.; Zhong Y.; Wu X.; Sunarso J.; Ni M.; Zhou W.; Shao Z. Bifunctionality from Synergy: CoP Nanoparticles Embedded in Amorphous CoOx Nanoplates with Heterostructures for Highly Efficient Water Electrolysis. Adv. Sci. 2018, 5, 1800514. 10.1002/advs.201800514. [DOI] [PMC free article] [PubMed] [Google Scholar]
- Jorio A.Carbon Nanotubes. In Topics in Applied Physics; Jorio A., Dresselhaus G., Dresselhaus M. S., Eds.; Springer, 2008. [Google Scholar]
- Pham M.-T.; Tran H.-H.; Nguyen T.-M. T.; Bui D.-P.; Huang Y.; Cao J.; You S.-J.; Pham V. V.; Vu H. N.; Wang Y.-F. Revealing DeNOx and DeVOC Reactions via the Study of the Surface and Bandstructure of ZnSn(OH)6 Photocatalysts. Acta Mater. 2021, 215, 117068. 10.1016/j.actamat.2021.117068. [DOI] [Google Scholar]
- Mooney J.; Kambhampati P. Get the Basics Right: Jacobian Conversion of Wavelength and Energy Scales for Quantitative Analysis of Emission Spectra. J. Phys. Chem. Lett. 2013, 4, 3316–3318. 10.1021/jz401508t. [DOI] [PubMed] [Google Scholar]
- Van Viet P.; Tran H.-H.; Sang N. X.; Cao M. T.; Le V. H. One-Step Hydrothermal Synthesis and Characterisation of SnO2 Nanoparticle-Loaded TiO2 Nanotubes with High Photocatalytic Performance under Sunlight. J. Mater. Sci. 2018, 53, 3364–3374. 10.1007/s10853-017-1762-6. [DOI] [Google Scholar]
- Bersch E.; Rangan S.; Bartynski R. A.; Garfunkel E.; Vescovo E. Band Offsets of Ultrathin High-κoxide Films with Si. Phys. Rev. B: Condens. Matter Mater. Phys. 2008, 78, 085114. 10.1103/physrevb.78.085114. [DOI] [Google Scholar]
- Wang S. J.; Huan A. C. H.; Foo Y. L.; Chai J. W.; Pan J. S.; Li Q.; Dong Y. F.; Feng Y. P.; Ong C. K. Energy-band alignments at ZrO2/Si, SiGe, and Ge interfaces. Appl. Phys. Lett. 2004, 85, 4418. 10.1063/1.1819988. [DOI] [Google Scholar]
- Lischner J.; Nemšák S.; Conti G.; Gloskovskii A.; Pálsson G. K.; Schneider C. M.; Drube W.; Louie S. G.; Fadley C. Accurate Determination of The Valence Band Edge in Hard X-Ray Photoemission Spectra Using GW Theory. J. Appl. Phys. 2016, 119, 165703. 10.1063/1.4947594. [DOI] [Google Scholar]
- Chen S.; Pan X.; Xu C.; Huang J.; Ye Z. X-ray Photoelectron Spectroscopy Study of Energy-Band Alignments of ZnO on Buffer Layer Lu2O3. Phys. Lett. A 2016, 380, 970–972. 10.1016/j.physleta.2015.12.038. [DOI] [Google Scholar]
- Berg U.; Chassé T.; Brümmer O. Investigation of the XPS Valence Band Structure from Sn Chalcogenides. Phys. Status Solidi B 1981, 108, 507–510. 10.1002/pssb.2221080227. [DOI] [Google Scholar]
- McKee R. A.; Walker F. J.; Nardelli M. B.; Shelton W. A.; Stocks G. M. The Interface Phase and The Schottky Barrier for A Crystalline Dielectric on Silicon. Science 2003, 300, 1726–1730. 10.1126/science.1083894. [DOI] [PubMed] [Google Scholar]
- Huy T. H.; Bui D. P.; Kang F.; Wang Y.-F.; Liu S.-H.; Thi C. M.; You S.-J.; Chang G.-M.; Pham V. V. SnO2/TiO2 Nanotube Heterojunction: The First Investigation of NO Degradation by Visible Light-Driven Photocatalysis. Chemosphere 2019, 215, 323–332. 10.1016/j.chemosphere.2018.10.033. [DOI] [PubMed] [Google Scholar]
- Maheu C.; Cardenas L.; Puzenat E.; Afanasiev P.; Geantet C. UPS and UV Spectroscopies Combined to Position the Energy Levels of TiO2 Anatase and Rutile Nanopowders. Phys. Chem. Chem. Phys. 2018, 20, 25629–25637. 10.1039/c8cp04614j. [DOI] [PubMed] [Google Scholar]
- Duong D. P. T.; Doan V. T.; Bui D.-P.; Nguyen T. T. N.; Nguyen T. N. U.; Cao M. T.; Nguyen T. K.; Kim Y.-S.; Pham V. V. Excellent Visible Light-Driven Photocatalytic Performance and Band Alignment of g-C3N4/TiO2 Nanotube Heterostructures. Mater. Res. Express 2019, 6, 085061. 10.1088/2053-1591/ab2021. [DOI] [Google Scholar]
- Van Viet P.; Cao Minh T.; Le V. H. The High Photocatalytic Activity of SnO2 Nanoparticles Synthesized by Hydrothermal Method. J. Nanomater. 2016, 2016, 1–8. 10.1155/2016/4231046. [DOI] [Google Scholar]
- Bui D.-P.; Pham H.; Cao M. T.; Pham V. V. Preparation of Conjugated Polyvinyl Chloride/TiO2 Nanotubes for Rhodamine B Photocatalytic Degradation under Visible Light. J. Chem. Technol. Biotechnol. 2020, 7, 2707. 10.1002/jctb.6466. [DOI] [Google Scholar]
- Vinh T. H. T.; Cao M. T.; Pham V. V. Enhancing Photocatalysis of NO Gas Degradation over g-C3N4 Modified α-Bi2O3 Microrods Composites under Visible Light. Mater. Lett. 2020, 281, 128637. 10.1016/j.matlet.2020.128637. [DOI] [Google Scholar]
- Fenelon E.; Bui D.-P.; Tran H. H.; You S.-J.; Wang Y.-F.; Cao T. M.; Van Pham V. Straightforward Synthesis of SnO2/Bi2S3/BiOCl-Bi24O31Cl10 Composites for Drastically Enhancing Rhodamine B Photocatalytic Degradation under Visible Light. ACS Omega 2020, 5, 20438–20449. 10.1021/acsomega.0c02461. [DOI] [PMC free article] [PubMed] [Google Scholar]


