

Abstract
Purpose:
Few studies have delineated body mass index (BMI) trajectories that associate with premature mortality, which is defined as death occurring before age 75 years.
Methods:
We used generalized additive mixed model to identify BMI trajectories of individuals dying before or after age 75 years among 14,172 U.S. men. We used logistic regression to validate whether the BMI trajectory developed predicted mortality in an independent cohort of 7000 participants.
Results:
Comparing to participants with age at death less than 75 years, the BMI among participants with age at death 75 years or more was lower throughout adulthood, and the mean BMI was 23.98, 24.63, 25.33, and 25.29 kg/m2 at age 40, 50, 60, and 70 years. In the validation cohort, participants following the BMI trajectory with age at death less than 75 years had higher risks of total mortality (odds ratio: 1.35; 95% confidence interval: 1.01–1.78) and cardiovascular disease mortality (1.92; 1.10–3.35) compared to participants following the trajectory with age at death 75 years or more. Participants whose BMI trajectories diverged the most from the trajectory with age at death 75 years or more had highest risks of total mortality (1.72; 1.23–2.40) and cardiovascular disease mortality (3.06; 1.49–6.30).
Conclusions:
Individual is suggested to maintain a normal BMI throughout adulthood to have greater longevity.
Keywords: Body mass index, Mortality, Generalized additive mixed model
Introduction
The association of body mass index (BMI) with risk of mortality has been extensively investigated. Earliest studies showed a U-shaped association between baseline BMI and risk of mortality [1,2]. When restricted to initially healthy participants, a direct positive linear association was observed [3,4]. Thereafter, studies consistently showed that comparing to normal weight, overweight and obesity at middle age were associated with a higher risk of mortality among white [4], black [5], and Asian populations [6].
Interestingly, when examining the association of BMI with risk of mortality, the main exposure was BMI measured at a single time point or the average and/or change of BMI between two time intervals [7,8] in most studies. The multiple repeated measures of BMI are not taken advantage of. In recent 2 years, semiparametric group-based analysis and/or latent class modeling has been used to examine the association of BMI trajectory with risk of mortality [9,10]. However, semiparametric group-based analysis categorizes individual trajectories into groups using maximum likelihood estimation [11,12]. The groups of trajectories and the order of the polynomial used to model each group’s trajectory need to be predefined, resulting in limited modeling flexibility. Moreover, the within-individual correlation of the repeated measures is not accounted for.
Developed in the 1990s, generalized additive mixed model (GAMM) is another method that could be used for trajectory analysis. It allows flexible modeling of a trajectory by using nonparametric regression and accounts for within-individual correlation by using random effects [13]. Therefore, we applied this method to delineate BMI trajectories with premature mortality, which is defined as death occurring before age 75 years, using the Physicians’ Health Study (PHS) I. We further validated whether adhering to the BMI trajectory with age at death more than 75 years developed in the PHS I predicted the lowest risk of mortality in an independent cohort: the PHS II.
Methods
Study population
Established in 1982, the PHS was a randomized, double-blind, placebo-controlled 2 × 2 factorial trial of low-dose aspirin and beta carotene on the primary prevention of cardiovascular disease and cancer. The trial recruited 22,071 male physicians aged 40–84 years at baseline. In addition to original participants enrolled in 1982, 7000 new participants were also randomized into the PHS II starting in 1997. The two cohorts consisted of approximately 95% Caucasians. The study protocol was approved by the Institutional Review Boards of Brigham and Women’s Hospital and Harvard T.H. Chan School of Public Health.
Given the large sample size of PHS I, PHS I was used for developing models relating BMI with mortality, and the PHS II was used for validating models developed in the PHS I. In the PHS I, we restricted to participants who were free of cardiovascular disease (CVD) and cancer at baseline for model development to minimize reverse causation. We further excluded 5021 participants who remained alive with age less than 75 years at the end of follow-up in the PHS I, as the age at death of those participants was not known. In total, 14,172 participants in the PHS I were included in our study.
Exposure assessment
In the PHS I, participants reported height and weight at baseline and updated weight information yearly between years 8 and 13 of follow-up. In the PHS II, participants reported height and weight at baseline, and updated weight yearly for 7 years. BMI was calculated as the ratio of weight (kg) to height (m) squared. In one validation study, self-reported and measured weight showed a correlation as high as 0.97 in both women and men [14].
Outcome assessment
Our primary end point was death from any cause. In PHS I and II, we have performed regular searches of state vital records and of the National Death Index. This search was supplemented by reports from family members and postal authorities. Using these methods, we were able to ascertain more than 98% of the deaths in each cohort [15]. A physician reviewed death certificates and medical records to classify the cause of death according to the eighth and ninth revisions of the International Classification of Diseases. Death status of the participants was updated until December 31, 2012.
Covariate assessment
Smoking status, age, prevalence of hypertension, hypercholesterolemia, diabetes, race, smoking status, physical activity, red meat, fruit and vegetable intakes, and total energy intake were collected by questionnaire at the start of follow-up in the PHS I and II. In annual follow-up questionnaires in the PHS I and II, updated information was collected on self-reported diagnosis of diseases including angina, myocardial infarction, stroke, and cancer. Following a disease report, medical reports were requested to confirm the diagnosis and the date of diagnosis. Disease status was updated until December 31, 2012.
Statistical analysis
In the PHS I, we divided participants into two groups by premature mortality (age of death <75 years and ≥75 years) for trajectory development. We examined the association between age and BMI using the GAMM with a smoothing function of age. The GAMM adjusted for race, smoking status, physical activity, red meat intake, fruit and vegetable intakes, and total energy intake. The parameters of the smoothing curve were estimated by penalized least squares. The within-individual correlation was accounted for by assuming random effects between individuals. To avoid reverse causation, we censored the participant’s BMI after the development of CVD and cancer and two years before death in the PHS I.
We examined whether the BMI trajectory with age at death 75 years or more developed in the PHS I predicted the lowest risk of mortality in the PHS II. First, we compared the odds ratio (OR) of mortality followed up to 15 years among participants who followed the BMI trajectory with age at death 75 years or more to participants who followed the BMI trajectory with age at death less than 75 years using logistic regression adjusting for baseline age, cardiovascular incidence, race, smoking status, physical activity, red meat, fruit and vegetable intakes, and total energy intake (kcal/day). To define which trajectory participants in the PHS II was assigned to, we calculated two variances for each participant shown as in the following and assigned the participant to the group with the smaller variance.
where BMIi was the participant’s BMI at age i (45 ≤ i ≤ 70); pBMIji was the predicted BMI at age i based on trajectory j developed in the PHS I; n was the total number of BMI observations of each participant; varj measured the similarity of the participant’s trajectory to trajectory j.
Second, we compared the OR of mortality followed up to 15 years among participants who diverged the most from the BMI trajectory with age at death 75 years or more to participants with the least divergence using logistic regression. To define participants with most, middle, and least divergence, we calculated variance for each participant in the PHS II shown as in the following and divided participants into tertiles according to the variance value. We further plotted and compared the survival curve according to the most, middle, and least divergence from the optimal BMI trajectory.
where BMIi was the participant’s BMI at the age of i (45 ≤ i ≤ 70); pBMIi was the predicted BMI at the age of i based on the BMI trajectory with life expectancy 75 years or more developed in the PHS; n was the total number of BMI observations of each participant.
The analyses were conducted using R 3.0.2 (R Development Core Team (2008): R: a language and environment for statistical computing, Vienna, Austria) on the Odyssey cluster supported by the FAS Division of Science, Research Computing Group at Harvard University. The command “GAMM” from the mgcv package was used for the GAMM and the trajectory was plotted using the command “plot.”
Results
In the PHS I, of 14,172 participants enrolled, 1114 died before 75 years old, and 13,058 participants died no less than 75 years. Baseline BMI of participants with age at death 75 years or more was lower comparing to participants with age at death less than 75 years. Participants with age at death 75 years or more smoked less, took higher amount of physical activity, and consumed more fruit and vegetables and less red meat. The population characteristics of the PHS I and II were comparable to each other (Table 1).
Table 1.
Baseline characteristics among participants in the PHS I and II
| PHS I (1982) | PHS I (1982) | PHS II (1997) | ||
|---|---|---|---|---|
| Age at death <75 years | Age at death ≥75 years | Whole population | Whole population | |
| Number of participants | 1114 | 13,058 | 14,172 | 7000 |
| Age (y) | 48.4 | 55.7 | 55.1 | 60.7 |
| BMI (kg/m2) | 25.6 | 24.8 | 24.9 | 26.2 |
| Smokers, % | 58 | 51 | 51 | 62.4 |
| Caucasian, % | 88 | 92 | 92 | 87.6 |
| Cardiovascular incidence, % | 0 | 0 | 0 | 7.5 |
| Hypertension, % | 25.2 | 24.1 | 24.2 | 34.8 |
| Hypercholesterolemia, % | 12.2 | 13.4 | 13.3 | 6.7 |
| Diabetes, % | 4.1 | 1.9 | 2.0 | 6.4 |
| Exercise (frequency/day) | 0.3 | 0.3 | 0.3 | 0.3 |
| Red meat (serving/day) | 0.8 | 0.7 | 0.7 | 0.7 |
| Fruit and vegetables (serving/day) | 5.0 | 5.2 | 5.2 | 4.6 |
| Total energy intake (kcal/day) | 1690 | 1711 | 1710 | 1664 |
Mean value was presented for continuous variables.
The BMI trajectories of individuals with age at death less than 75 years and 75 years or more in the PHS I are shown in Figure 1. Individuals dying at age 75 years or older had a consistently lower BMI throughout their adult lives than individuals who died earlier in both cohorts. The mean BMI of individuals dying at age 75 years or older was 23.98, 24.63, 25.33, and 25.29 kg/m2 at age 40, 50, 60, and 70 years among participants with age at death 75 years or more. The corresponding mean BMI among individuals dying before 75 years was 24.75, 25.50, 26.08, and 26.27 kg/m2 at the age of 40, 50, 60, and 70 years (Table 2).
Fig. 1.
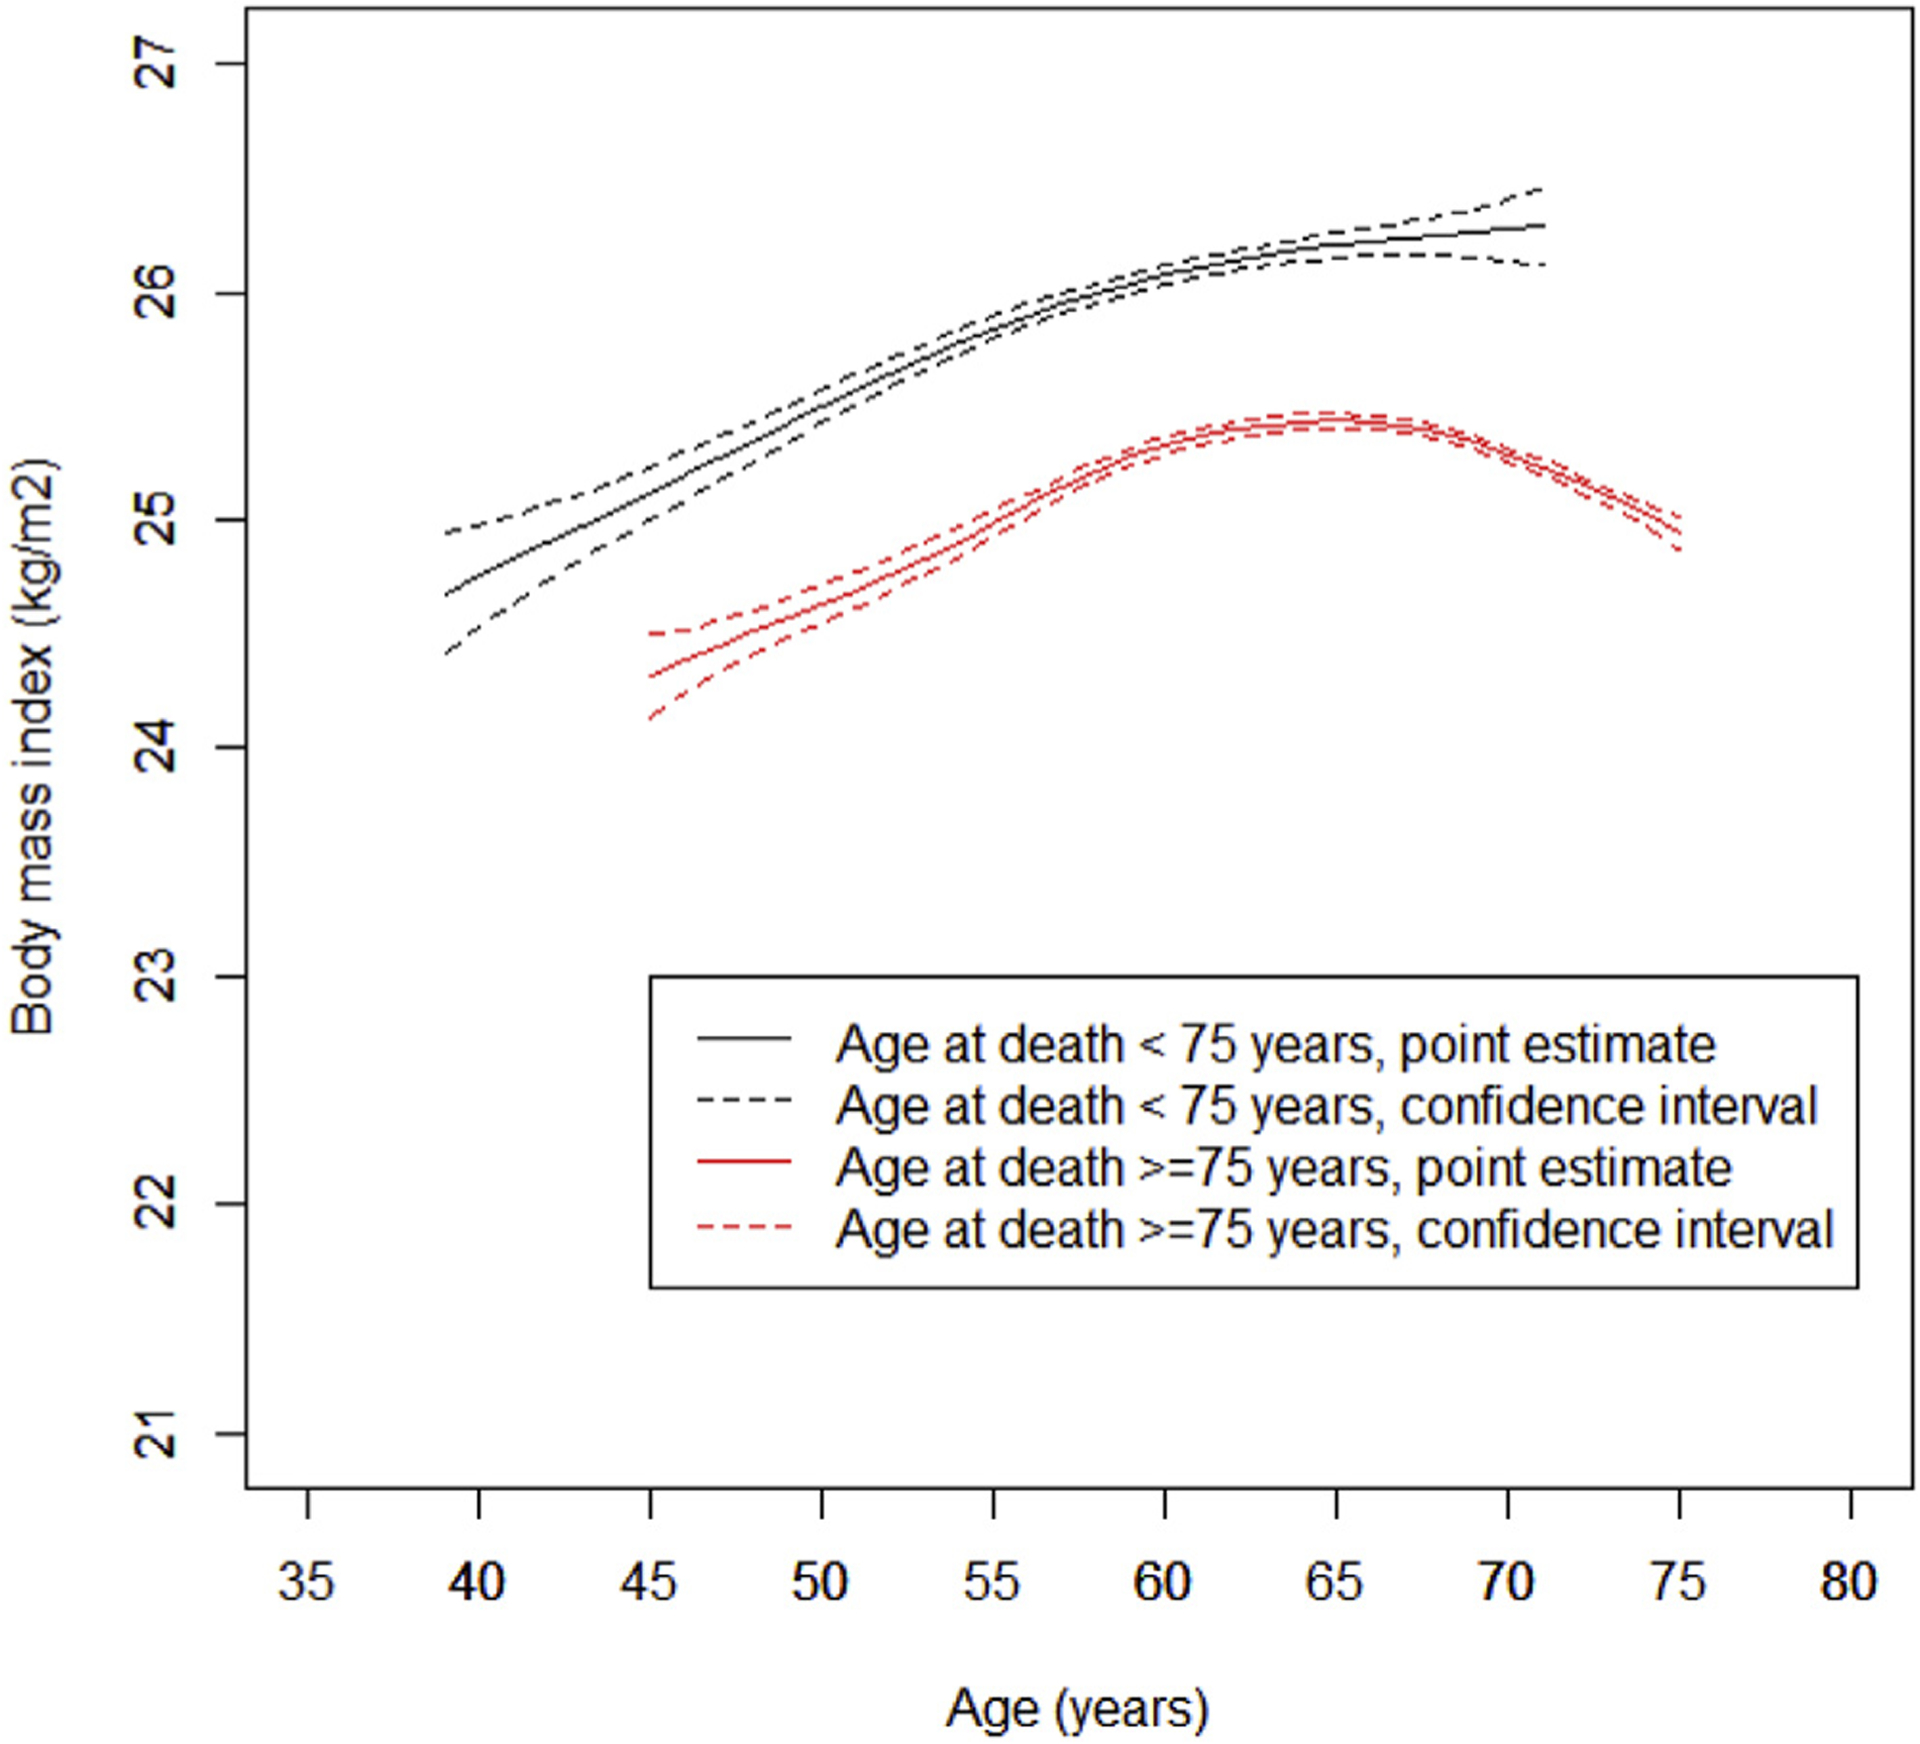
BMI trajectories through adulthood with age at death less than 75 years and 75 years or more in the PHS I. Generalized additive mixed model was used with smoothing function of age and adjusted for covariates including hypertension (yes vs. no), hypercholesterolemia (yes vs. no), diabetes (yes vs. no), race (Caucasian vs. other races), smoking status (current, past vs. never smoker), physical activity (frequency/day), red meat intake (serving/day), fruit and vegetable intakes (serving/day), and total energy intake (kcal/day). The within-individual correlation was accounted for by assuming random effects between individuals. The trajectories were estimated using mean value of all covariates summarized in Table 1.
Table 2.
The estimated BMI through adulthood among participants with age at death less than 75 years and 75 years or more in the PHS I
| Age (y) | BMI (kg/m2) (95% CI) | |
|---|---|---|
| Age at death <75 y | Age at death ≥75 y | |
| 40 | 24.8 (24.6–24.9) | 24.0 (23.8–24.2) |
| 43 | 25.0 (24.9–25.1) | 24.2 (24.0–24.3) |
| 45 | 25.1 (25.1–25.2) | 24.3 (24.2–24.4) |
| 48 | 25.3 (25.3–25.4) | 24.5 (24.5–24.6) |
| 50 | 25.5 (25.5–25.5) | 24.6 (24.6–24.7) |
| 53 | 25.7 (25.7–25.7) | 24.8 (24.8–24.9) |
| 55 | 25.8 (25.8–25.9) | 25.0 (25.0–25.0) |
| 58 | 26.0 (26.0–26.0) | 25.2 (25.2–25.2) |
| 60 | 26.1 (26.1–26.1) | 25.3 (25.3–25.4) |
| 63 | 26.2 (26.1–26.2) | 25.4 (25.4–25.4) |
| 65 | 26.2 (26.2–26.2) | 25.4 (25.4–25.5) |
| 68 | 26.3 (26.2–26.3) | 25.4 (25.4–25.4) |
| 70 | 26.3 (26.2–26.3) | 25.3 (25.3–25.3) |
Generalized additive mixed model was used with smoothing function of age and adjusted for covariates including hypertension (yes vs. no), hypercholesterolemia (yes vs. no), diabetes (yes vs. no), race (Caucasian vs. other races), smoking status (current, past vs. never smoker), physical activity (frequency/day), red meat intake (serving/day), fruit and vegetable intakes (serving/day), and total energy intake (kcal/day). The within-individual correlation was accounted for by assuming random effects between individuals.
The trajectories were estimated using mean value of all covariates summarized in Table 1.
We then examined whether the BMI trajectory with age at death 75 years or more developed in the PHS I independently predicted the lowest risk of mortality in the PHS II. Participants following the BMI trajectory with age at death less than 75 years were associated with higher risks of total mortality (OR: 1.35; 95% confidence interval [CI]: 1.01–1.78) and mortality due to CVD (OR: 1.92; 95% CI: 1.10–3.35) but not mortality due to cancer (OR: 1.08; 95% CI: 0.72–1.63) comparing to participants following the BMI trajectory with age at death 75 years or more (Table 3). Participants whose trajectories diverged most from the BMI trajectory with age at death 75 years or more were associated with higher risks of total mortality (OR: 1.72; 95% CI: 1.23–2.40) and mortality due to CVD (OR: 3.06; 95% CI: 1.49–6.30) but not mortality due to cancer (OR: 0.87; 95% CI: 0.54–1.40) comparing to participants with least divergence (Table 4).
Table 3.
The odds ratio of mortality in the PHS II comparing participants following the BMI trajectory with age at death 75 years or more developed in the PHS I to participants following the BMI trajectory with age at death less than 75 years
| BMI trajectory with age at death ≥75 years (red curve in Fig. 1) | BMI trajectory with age at death <75 years (black curve in Fig. 1) | |
|---|---|---|
| Number of death/participants | 111/2512 | 183/3220 |
| All-cause mortality | 1.00 | 1.35 (1.01–1.78) |
| Mortality due to cancer | 1.00 | 1.08 (0.72–1.63) |
| Mortality due to CVD | 1.00 | 1.92 (1.10–3.35) |
| Mortality due to other causes | 1.00 | 1.01 (0.62–1.64) |
Logistic regression models adjusted for baseline age (year), hypertension (yes vs. no), hypercholesterolemia (yes vs. no), diabetes (yes vs. no), cardiovascular incidence (yes vs. no), race (Caucasian vs. other races), smoking status (current, past, vs. never smoker), physical activity (frequency/day), red meat intake (serving/day), fruit and vegetable intakes (serving/day), and total energy intake (kcal/day).
Table 4.
The odds ratio of mortality in the PHS II comparing participants with the most divergence from the BMI trajectory with age at death 75 years or more developed in the PHS I to participants with the least divergence
| Tertiles of divergence from the BMI trajectory with age at death ≥75 years (red curve in Fig. 1) | |||
|---|---|---|---|
| Least | Middle | Most | |
| Number of death/participants | 72/1910 | 95/1911 | 127/1911 |
| All-cause mortality | 1.00 | 1.33 (0.94–1.89) | 1.72 (1.23–2.40) |
| Mortality due to cancer | 1.00 | 0.95 (0.59–1.53) | 0.87 (0.54–1.40) |
| Mortality due to CVD | 1.00 | 2.41 (1.14–5.09) | 3.06 (1.49–6.30) |
| Mortality due to other causes | 1.00 | 1.48 (0.74–2.96) | 2.76 (1.48–5.15) |
Logistic regression models adjusted for baseline age (year), hypertension (yes vs. no), hypercholesterolemia (yes vs. no), diabetes (yes vs. no), cardiovascular incidence (yes vs. no), race (Caucasian vs. other races), smoking status (current, past, vs. never smoker), physical activity (frequency/day), red meat intake (serving/day), fruit and vegetable intakes (serving/day), and total energy intake (kcal/day).
To identify lifestyle factors that might be associated with BMI trajectory with age at death 75 years or more, we delineated BMI trajectory stratified by smoking status, physical activity, and red meat intake. The trajectory with the lowest BMI across adulthood was among participants who were never smokers, took higher amount of physical activity, and consumed lower red meat (Fig. 2).
Fig. 2.
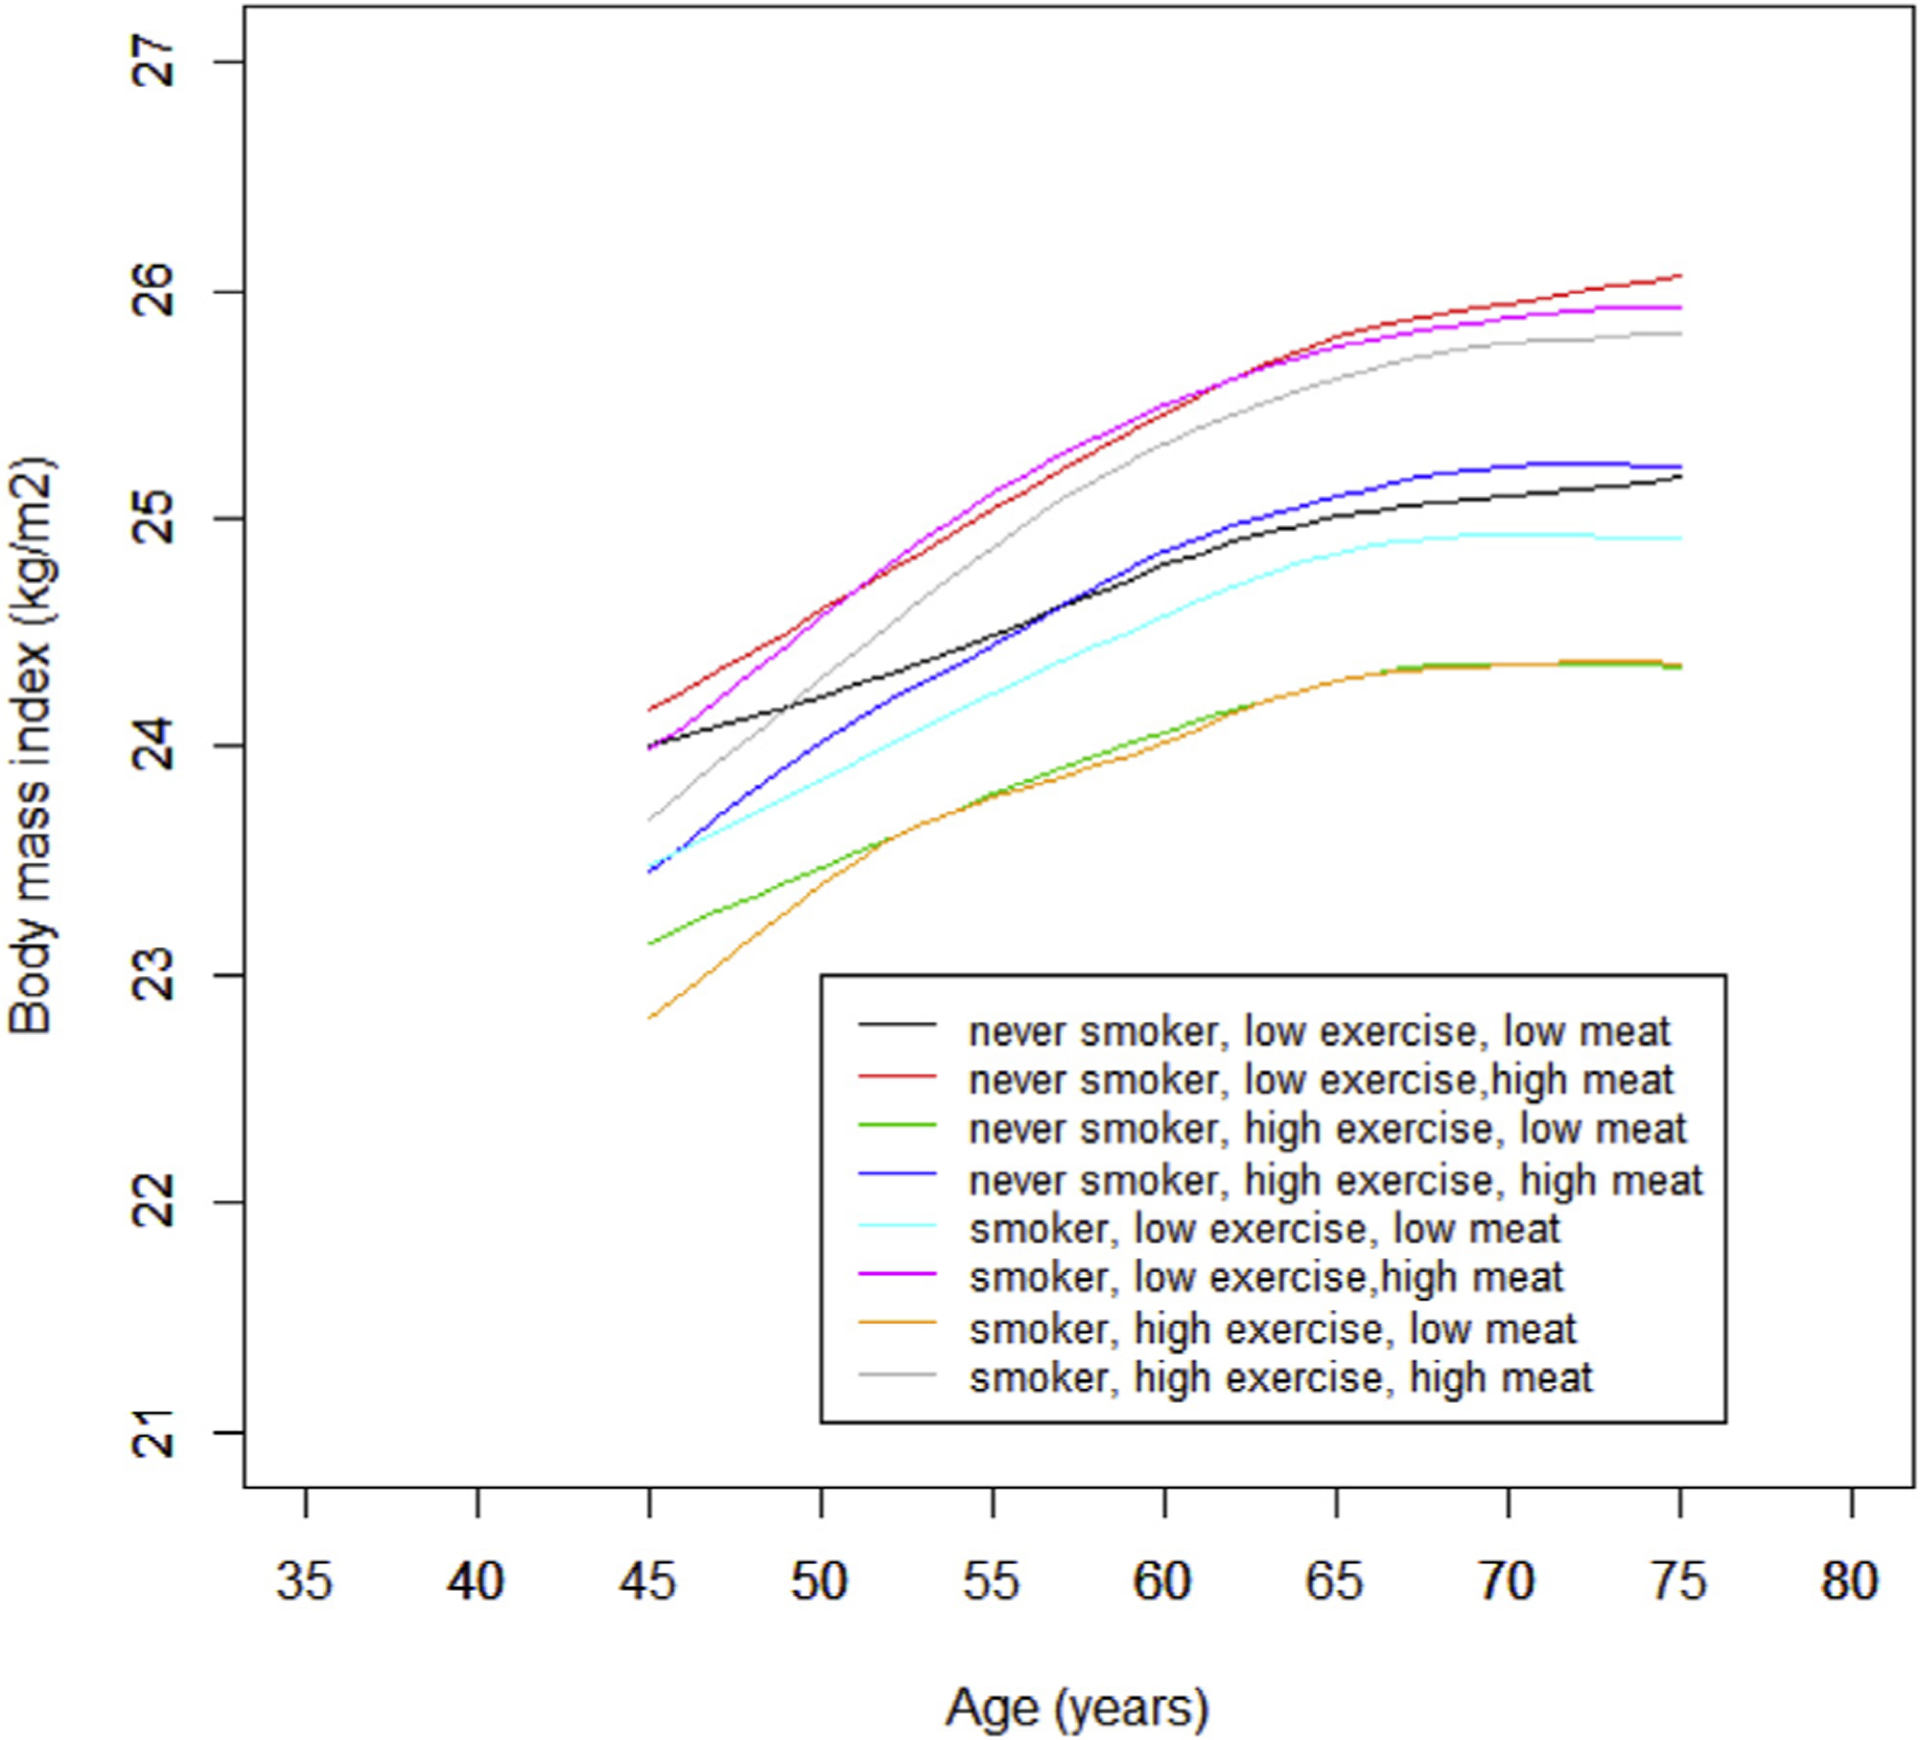
BMI trajectories with age at death 75 years or more stratified by smoking status (never vs. ever smoker), exercise (low vs. high) and red meat intake (low vs. high) in the PHS I. Generalized additive mixed model was used with smoothing function of age and adjusted for race (Caucasian vs. other races). The within-individual correlation was accounted for by assuming random effects between individuals.
Given the limited number of death cases in the PHS II, we examined the divergence from BMI trajectory with the outcome “mortality” rather than “premature mortality.” Therefore, we conducted survival analysis in the PHS II and found that participants with least divergence from the BMI trajectory with age at death 75 years or more were associated with better overall survival (log-rank P < .001) and CVD-specific survival (log-rank P = .003) (Supplemental Fig. 1). As we chose 75 years as the cutoff point for premature mortality arbitrarily, we examined BMI trajectories with age at death less than 80 years and 80 years or more. The BMI was lower across adulthood among participants with age at death 80 years or more (Supplemental Fig. 2). As we excluded participants with CVD and cancer at baseline and censored participants who developed CVD or cancer during follow-up, we delineated BMI trajectories by including all of the available observations. The BMI trajectory with age at death less than 75 years was lower at 70–75 years and the two trajectories crossed over (Supplemental Fig. 3). In BMI trajectory development, we excluded 5021 participants whose age were less than 75 years at the end of follow-up in the PHS I. Given that the age at the end of follow-up of those participants varied from 69 to 74 years, we included those participants by assuming that all of them lived up to 75 years. The shape of the BMI trajectories appeared to be similar to the main results (Supplemental Fig. 4).
Discussion
Using the generalized additive mixed model, our study showed that an individual should maintain a normal BMI across adulthood to achieve longevity. Our results were consistent with findings from large collaborative studies, which showed that the baseline BMI range associated with the lowest mortality rate was 20.0 kg/m2 to 24.9 kg/m2 in whites [16–18].
There are still debates on the association between BMI and mortality. The majority of studies showed that normal weight was associated with lower risk of mortality in comparison to being overweight or obese [19–21]. However, in one study, among older participants that included those with baseline disease, those who were overweight had a lower risk of mortality compared with normal weight participants [22,23]. Moreover, in studies among participants with diabetes or CVD, when using concurrent BMI after disease diagnosis as the main exposure, the lowest risk of mortality was observed in overweight and/or obese participants [24,25].
This inconsistent association between BMI and mortality in different studies is called the obesity paradox. Reverse causation was proposed to explain this phenomenon, suggesting that the underlying disease might cause weight loss as well as mortality. However, some studies believed that there was a biological mechanism through which being overweight and/or obese led to better prognoses among participants with chronic disease [26]. The trajectories we developed in the PHS I showed that BMI remained lower in group with longer life expectancy in comparison to the group with shorter life expectancy across life span, and we found no obesity paradox in our study. When we included participants with CVD and cancer at baseline and did not censor BMI after the development of CVD and cancer during follow-up, the two BMI trajectories crossed over, indicating that the obesity paradox might be due to reverse causation of chronic diseases.
For BMI trajectory with age at death 75 years or more, BMI appeared to be lower at younger ages and higher at middle ages. Our results were still consistent with previous studies with long follow-up, which showed that comparing to those who gained weight (≥5 kg), participants with stable weight (±5 kg) in midlife from 18 to 20 years of age were associated with a lower risk of CHD [27], healthier survival after age 70 [28], and lower risk of colorectal cancer [29]. Although our results showed that the BMI was slightly higher at middle age comparing to younger age, it did not indicate that participants should purposely gain weight to achieve longevity. Short-term clinical trials showed that modest weight loss leads to significant improvements in cardiovascular risk factors, including blood pressure, and concentration of blood lipids and glucose [30]. A cohort study also showed that intentional weight loss was associated with a lower risk of CHD [31]. Therefore, participants are encouraged to maintain a healthy weight throughout adulthood, and the age-specific BMI we provided might be used as a reference.
To maintain a healthy BMI across adulthood as we recommended, we found that BMI was lowest throughout adulthood among participants who were never smoker, took higher amount of physical activity, and consumed lower red meat. Consistently, studies showed that a healthy lifestyle could be adopted to maintain healthy weight, which included higher amount of physical activity, regular sleep, less TV watching, and healthy dietary pattern featuring by higher consumption of vegetables, whole grains, fruits, nuts, and yogurt, and lower consumption of potato chips, potatoes, sugar-sweetened beverages, unprocessed red meats, and processed meats [32–34].
When validating the BMI trajectory in PHS II, participants following the BMI trajectory with age at death 75 years or more were associated with a lower risk of mortality due to CVD and were not associated with the risk of mortality due to cancer. The result was consistent with previous studies that positive association of baseline BMI with risk of mortality due to CVD was more pronounced than the risk of mortality due to cancer [18,35–37]. The reason was that BMI was a stronger risk factor of CVD than cancer. Each 5-kg/m2 increase of BMI was associated with 27% higher risk of CHD and 18% higher risk of stroke [38,39]. However, each 5-kg/m2 increase of BMI was not associated with risk of overall cancer and was only associated with higher risks of certain types of cancer with relatively low prevalence, including uterus, gallbladder, kidney, and liver cancer [40].
Our study has several advantages. First, we have large sample sizes in the PHS I and multiple repeated measures of BMI at ages ranging from 40 to 75 years, which provided sufficient power for the BMI trajectory development. Second, we used a novel statistical method to use the repeated measures of BMI. Furthermore, with smoothing function of age, we were able to obtain a complete trajectory even if the second BMI was measured in the eighth year of follow-up in the PHS I. The GAMM also allows adjust for multiple covariates when developing the trajectories. Third, we validated the developed BMI trajectories in an independent cohort and showed that the trajectory with age at death 75 years or more could predict the lowest risk of mortality. Fourth, we dealt with reverse causation by excluding participants with CVD or cancer and censoring BMI after the development of CVD or cancer.
Our study also has several limitations. First, BMI was self-reported in all of the three cohorts. Although self-reported weight was shown to be highly correlated to measured weight in validation study [14], measurement errors were possible. Second, we only delineated BMI trajectory in U.S. men, and the generalizability of the BMI trajectories we developed might be limited. Given that the life span of women is longer than men, BMI trajectories in U.S. women warrant further investigation.
In conclusion, using a generalized additive mixed model, our study showed that individual should maintain a normal BMI (≤25 kg/m2) throughout adulthood to have greater longevity.
Supplementary Material
Acknowledgments
The physicians’ Health Study was supported by the National Institutes of Health (CA42182, CA58684, CA90598, CA141298, HL35464, CA167552, CA34944, CA40360, HL26490, HL34595).
References
- [1].Rhoads GG, Kagan A. The relation of coronary disease, stroke, and mortality to weight in youth and in middle age. Lancet 1983;1(8323):492–5. [DOI] [PubMed] [Google Scholar]
- [2].Vandenbroucke JP, Mauritz BJ, de Bruin A, Verheesen JH, van der Heide-Wessel C, van der Heide RM. Weight, smoking, and mortality. JAMA 1984;252(20):2859–60. [PubMed] [Google Scholar]
- [3].Lee IM, Manson JE, Hennekens CH, Paffenbarger RS Jr. Body weight and mortality. A 27-year follow-up of middle-aged men. JAMA 1993;270(23):2823–8. [DOI] [PubMed] [Google Scholar]
- [4].Manson JE, Willett WC, Stampfer MJ, Colditz GA, Hunter DJ, Hankinson SE, et al. Body weight and mortality among women. N Engl J Med 1995;333(11):677–85. [DOI] [PubMed] [Google Scholar]
- [5].Calle EE, Thun MJ, Petrelli JM, Rodriguez C, Heath CW Jr. Body-mass index and mortality in a prospective cohort of U.S. adults. N Engl J Med 1999; 341(15):1097–105. [DOI] [PubMed] [Google Scholar]
- [6].Gu D, He J, Duan X, Reynolds K, Wu X, Chen J, et al. Body weight and mortality among men and women in China. JAMA 2006;295(7):776–83. [DOI] [PubMed] [Google Scholar]
- [7].Stokes A. Using maximum weight to redefine body mass index categories in studies of the mortality risks of obesity. Popul Health Metr 2014;12(1):6. [DOI] [PMC free article] [PubMed] [Google Scholar]
- [8].Myrskyla M, Chang VW. Weight change, initial BMI, and mortality among middle- and older-aged adults. Epidemiology 2009;20(6):840–8. [DOI] [PMC free article] [PubMed] [Google Scholar]
- [9].Murayama H, Liang J, Bennett JM, Shaw BA, Botoseneanu A, Kobayashi E, et al. Trajectories of body mass index and their associations with mortality among older Japanese: do they differ from those of western populations? Am J Epidemiol 2015;182(7):597–605. [DOI] [PMC free article] [PubMed] [Google Scholar]
- [10].von Bonsdorff MB, Tormakangas T, Rantanen T, Salonen MK, Osmond C, Kajantie E, et al. Early life body mass trajectories and mortality in older age: findings from the Helsinki Birth Cohort Study. Ann Med 2015;47(1):34–9. [DOI] [PubMed] [Google Scholar]
- [11].Nagin DS. Analyzing developmental trajectories: a semiparametric, group-based approach. Psychol Methods 1999;4(2):139–57. [DOI] [PubMed] [Google Scholar]
- [12].Jones BL, Nagin DS, Roeder K. A SAS procedure based on mixture models for estimating developmental trajectories. Sociol Methods Res 2001;29(3):374–93. [Google Scholar]
- [13].Lin X, Zhang D. Inference in generalized additive mixed models by using smoothing splines. J R Stat Soc Series B Stat Methodol 1999;61:381–400. [Google Scholar]
- [14].Rimm EB, Stampfer MJ, Colditz GA, Chute CG, Litin LB, Willett WC. Validity of self-reported waist and hip circumferences in men and women. Epidemiology 1990;1(6):466–73. [DOI] [PubMed] [Google Scholar]
- [15].Rich-Edwards JW, Corsano KA, Stampfer MJ. Test of the National Death Index and Equifax Nationwide Death Search. Am J Epidemiol 1994;140(11):1016–9. [DOI] [PubMed] [Google Scholar]
- [16].Pischon T, Boeing H, Hoffmann K, Bergmann M, Schulze MB, Overvad K, et al. General and abdominal adiposity and risk of death in Europe. N Engl J Med 2008;359(20):2105–20. [DOI] [PubMed] [Google Scholar]
- [17].Berrington de Gonzalez A, Hartge P, Cerhan JR, Flint AJ, Hannan L, MacInnis RJ, et al. Body-mass index and mortality among 1.46 million white adults. N Engl J Med 2010;363(23):2211–9. [DOI] [PMC free article] [PubMed] [Google Scholar]
- [18].Whitlock G, Lewington S, Sherliker P, Clarke R, Emberson J, Halsey J, et al. Body-mass index and cause-specific mortality in 900 000 adults: collaborative analyses of 57 prospective studies. Lancet 2009;373(9669):1083–96. [DOI] [PMC free article] [PubMed] [Google Scholar]
- [19].Harris T, Cook EF, Garrison R, Higgins M, Kannel W, Goldman L. Body mass index and mortality among nonsmoking older persons. The Framingham Heart Study. JAMA 1988;259(10):1520–4. [PubMed] [Google Scholar]
- [20].Must A, Jacques PF, Dallal GE, Bajema CJ, Dietz WH. Long-term morbidity and mortality of overweight adolescents. A follow-up of the Harvard Growth Study of 1922 to 1935. N Engl J Med 1992;327(19):1350–5. [DOI] [PubMed] [Google Scholar]
- [21].Tobias DK, Pan A, Jackson CL, O’Reilly EJ, Ding EL, Willett WC, et al. Body-mass index and mortality among adults with incident type 2 diabetes. N Engl J Med 2014;370(3):233–44. [DOI] [PMC free article] [PubMed] [Google Scholar]
- [22].Flegal KM, Kit BK, Orpana H, Graubard BI. Association of all-cause mortality with overweight and obesity using standard body mass index categories: a systematic review and meta-analysis. JAMA 2013;309(1):71–82. [DOI] [PMC free article] [PubMed] [Google Scholar]
- [23].Flegal KM, Graubard BI, Williamson DF, Gail MH. Excess deaths associated with underweight, overweight, and obesity. JAMA 2005;293(15):1861–7. [DOI] [PubMed] [Google Scholar]
- [24].Carnethon MR, De Chavez PJ, Biggs ML, Lewis CE, Pankow JS, Bertoni AG, et al. Association of weight status with mortality in adults with incident diabetes. JAMA 2012;308(6):581–90. [DOI] [PMC free article] [PubMed] [Google Scholar]
- [25].Romero-Corral A, Montori VM, Somers VK, Korinek J, Thomas RJ, Allison TG, et al. Association of bodyweight with total mortality and with cardiovascular events in coronary artery disease: a systematic review of cohort studies. Lancet 2006;368(9536):666–78. [DOI] [PubMed] [Google Scholar]
- [26].Lavie CJ, McAuley PA, Church TS, Milani RV, Blair SN. Obesity and cardiovascular diseases: implications regarding fitness, fatness, and severity in the obesity paradox. J Am Coll Cardiol 2014;63(14):1345–54. [DOI] [PubMed] [Google Scholar]
- [27].Willett WC, Manson JE, Stampfer MJ, Colditz GA, Rosner B, Speizer FE, et al. Weight, weight change, and coronary heart disease in women. Risk within the ‘normal’ weight range. JAMA 1995;273(6):461–5. [DOI] [PubMed] [Google Scholar]
- [28].Sun Q, Townsend MK, Okereke OI, Franco OH, Hu FB, Grodstein F. Adiposity and weight change in mid-life in relation to healthy survival after age 70 in women: prospective cohort study. BMJ 2009;339:b3796. [DOI] [PMC free article] [PubMed] [Google Scholar]
- [29].Song M, Hu FB, Spiegelman D, Chan AT, Wu K, Ogino S, et al. Adulthood weight change and risk of colorectal cancer in the Nurses’ Health Study and Health Professionals Follow-up Study. Cancer Prev Res (Phila) 2015;8(7):620–7. [DOI] [PMC free article] [PubMed] [Google Scholar]
- [30].Clinical guidelines on the identification, evaluation, and treatment of overweight and obesity in adultsdthe evidence report. National Institutes of Health. Obes Res 1998;6(Suppl 2):51S–209S. [PubMed] [Google Scholar]
- [31].Eilat-Adar S, Eldar M, Goldbourt U. Association of intentional changes in body weight with coronary heart disease event rates in overweight subjects who have an additional coronary risk factor. Am J Epidemiol 2005;161(4):352–8. [DOI] [PubMed] [Google Scholar]
- [32].Mozaffarian D, Hao T, Rimm EB, Willett WC, Hu FB. Changes in diet and lifestyle and long-term weight gain in women and men. N Engl J Med 2011;364(25):2392–404. [DOI] [PMC free article] [PubMed] [Google Scholar]
- [33].Bertoia ML, Mukamal KJ, Cahill LE, Hou T, Ludwig DS, Mozaffarian D, et al. Changes in intake of fruits and vegetables and weight change in United States men and women followed for up to 24 years: analysis from three prospective cohort studies. PLoS Med 2015;12(9):e1001878. [DOI] [PMC free article] [PubMed] [Google Scholar]
- [34].Fung TT, Pan A, Hou T, Chiuve SE, Tobias DK, Mozaffarian D, et al. Long-term change in diet quality is associated with body weight change in men and women. J Nutr 2015;145(8):1850–6. [DOI] [PMC free article] [PubMed] [Google Scholar]
- [35].Calle EE, Rodriguez C, Walker-Thurmond K, Thun MJ. Overweight, obesity, and mortality from cancer in a prospectively studied cohort of U.S. adults. N Engl J Med 2003;348(17):1625–38. [DOI] [PubMed] [Google Scholar]
- [36].Adams KF, Schatzkin A, Harris TB, Kipnis V, Mouw T, Ballard-Barbash R, et al. Overweight, obesity, and mortality in a large prospective cohort of persons 50 to 71 years old. N Engl J Med 2006;355(8):763–78. [DOI] [PubMed] [Google Scholar]
- [37].Parr CL, Batty GD, Lam TH, Barzi F, Fang X, Ho SC, et al. Body-mass index and cancer mortality in the Asia-Pacific Cohort Studies Collaboration: pooled analyses of 424,519 participants. Lancet Oncol 2010;11(8):741–52. [DOI] [PMC free article] [PubMed] [Google Scholar]
- [38].Ni Mhurchu C, Rodgers A, Pan WH, Gu DF, Woodward M. Body mass index and cardiovascular disease in the Asia-Pacific Region: an overview of 33 cohorts involving 310 000 participants. Int J Epidemiol 2004;33(4):751–8. [DOI] [PubMed] [Google Scholar]
- [39].Lu Y, Hajifathalian K, Ezzati M, Woodward M, Rimm EB, Danaei G. Metabolic mediators of the effects of body-mass index, overweight, and obesity on coronary heart disease and stroke: a pooled analysis of 97 prospective cohorts with 1.8 million participants. Lancet 2014;383(9921):970–83. [DOI] [PMC free article] [PubMed] [Google Scholar]
- [40].Bhaskaran K, Douglas I, Forbes H, dos-Santos-Silva I, Leon DA, Smeeth L. Body-mass index and risk of 22 specific cancers: a population-based cohort study of 5.24 million UK adults. Lancet 2014;384(9945):755–65. [DOI] [PMC free article] [PubMed] [Google Scholar]
Associated Data
This section collects any data citations, data availability statements, or supplementary materials included in this article.