

Key Words: clinical symptom severity, functional dependence, intracerebral hemorrhage, leukoaraiosis, modified Rankin scale, National Institute Health of Stroke Scale, prognosis, stroke recurrence, white matter hyperintensities
Abstract
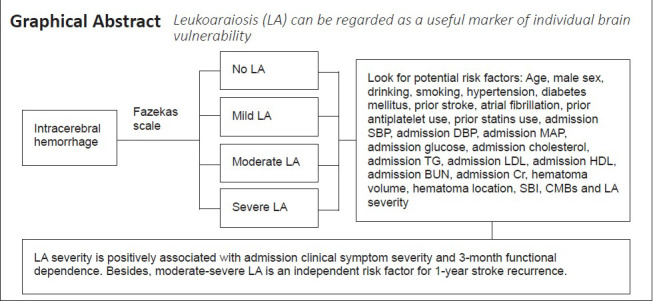
Leukoaraiosis (LA) results from ischemic injury in small cerebral vessels, which may be attributable to decreased vascular density, reduced cerebrovascular angiogenesis, decreased cerebral blood flow, or microcirculatory dysfunction in the brain. In this study, we enrolled 357 patients with mild intracerebral hemorrhage (ICH) from five hospitals in China and analyzed the relationships between LA and clinical symptom severity at admission, neurological function prognosis at 3 months, and 1-year stroke recurrence. Patients were divided into groups based on Fazekas scale scores: no LA (n = 83), mild LA (n = 64), moderate LA (n = 98) and severe LA (n = 112). More severe LA, larger hematoma volume, and higher blood glucose level at admission were associated with more severe neurological deficit. More severe LA, older age and larger hematoma volume were associated with worse neurological function prognosis at 3 months. In addition, moderate-to-severe LA, admission glucose and symptom-free cerebral infarction were associated with 1-year stroke recurrence. These findings suggest that LA severity may be a potential marker of individual ICH vulnerability, which can be characterized by poor tolerance to intracerebral attack or poor recovery ability after ICH. Evaluating LA severity in patients with mild ICH may help neurologists to optimize treatment protocols. This study was approved by the Ethics Committee of Ruijin Hospital Affiliated to Shanghai Jiao Tong University (approval No. 12) on March 10, 2011.
Chinese Library Classification No. R446; R741; R449
Introduction
Spontaneous intracerebral hemorrhage (ICH) refers to the non-traumatic rupture of cerebral vessels. The global lifetime risk of ICH after the age of 25 years is estimated as 8.2% (GBD 2016 Lifetime Risk of Stroke Collaborators et al., 2018). ICH is a severe disease with high rates of functional dependence and stroke recurrence, causing heavy burdens on societies and families (Yan et al., 2018). Previous studies have reported that damage to small cerebral vessels is closely related to the course of ICH (Boulouis et al., 2016; Debette et al., 2019).
Leukoaraiosis (LA) is a common white matter lesion seen in neuroimaging of older adult individuals (Lin et al., 2015), and is equivalent to what the neuroimaging field typically calls white matter hyperintensities (Zhu et al., 2020). LA is thought to be the result of ischemic injury in small cerebral vessels, which may be attributable to decreased vascular density, blood-brain barrier dysfunction, decreased cerebral blood flow, or impaired cerebral microcirculation (Debette and Markus, 2010; Hall et al., 2014; Hainsworth et al., 2017; Moroni et al., 2020). We hypothesized that LA severity may be a potential marker of individual ICH vulnerability, which can be characterized by poor tolerance to ICH attack or poor recovery ability after ICH.
A previous study reported that larger LA volume was associated with higher National Institute of Health Stroke Scale (NIHSS) score at admission, independent of age and infarct size, in small vessel occlusion stroke (Ryu et al., 2017). Their findings indicate that there may be a relationship between LA severity and clinical symptom severity at the time of admission in stroke patients. Inspired by this research, we wondered if LA severity is also associated with the severity of neurological impairment in ICH patients at admission. Because severe ICH patients often present with large hematomas in locations that cause severe disability, we aimed to recruit conscious ICH patients who had relatively mild symptoms and did not require surgery. Additionally, although previous studies have found an association between poor neurological functional outcome and LA in ICH patients (Caprio et al., 2013; Yu et al., 2019), it was unclear whether LA affects functional outcome in mild ICH patients. Furthermore, the relationship between LA and stroke recurrence in ICH patients was unknown. In this study, we aimed to explore the relationships between LA severity and clinical symptom severity at admission, functional dependence and stroke recurrence in mild ICH patients.
Subjects and Methods
Study population
The sample size was calculated based on a significant difference test for the incidence of adverse clinical outcome (α = 0.05, 1 – β = 0.8, power = 0.8) via PASS 15 software (NCSS LLC., Kaysville, UT, USA). Additionally, logistic and Cox regression analyses indicated that the sample size should be 10 times greater than the number of independent variables included in the models (Cesana and Antonelli, 2016; Tripathi et al., 2020). Conscious ICH patients in the prospective cohort study who had relatively mild symptoms and did not require surgery were recruited from the neurology wards from August 2012 to April 2019 at five independent general hospitals: Ruijin Hospital Affiliated to Shanghai Jiao Tong University, Minhang Hospital Affiliated to Fudan University, Zhongshan Hospital Qingpu Branch Affiliated to Fudan University, The First Hospital of Jiaxing and Ruijin North Hospital. The inclusion criteria were as follows: age ≥ 18 years; diagnosed with acute mild ICH with computed tomography (CT) scan; and complete clinical and imaging data were obtained. The exclusion criteria were as follows: secondary ICH; CT scan performed over 3 days after onset; incomplete clinical or imaging data; no follow-up data; coma; required craniocerebral surgery; and co-occurrence of severe systemic disease that may affect the prognosis. We followed up with the enrolled ICH patients for 1 year.
This study was approved by the Ethics Committee of Ruijin Hospital Affiliated to Shanghai Jiao Tong University (approval No. 12) on May 10, 2011 (Additional file 1 (1.9MB, pdf) ). We obtained the written informed consent form (Additional file 2 (121.1KB, pdf) ) from enrolled patients or legally authorized representatives to collect clinical data and process follow-ups. This study follows the Strengthening the Reporting of Observational Studies in Epidemiology (STROBE) guidance for protocol reporting (Additional file 3).
STROBE Statement—Checklist of items that should be included in reports of observational studies
| Item | No | Recommendation | Page |
|---|---|---|---|
| Title and abstract | 1 | (a) Indicate the study’s design with a commonly used term in the title or the abstract | 1-2 |
|
| |||
| (b) Provide in the abstract an informative and balanced summary of what was done and what was found | 1-2 | ||
|
| |||
| Introduction | |||
|
| |||
| Background/rationale | 2 | Explain the scientific background and rationale for the investigation being reported | 2-3 |
|
| |||
| Objectives | 3 | State specific objectives, including any prespecified hypotheses | 3 |
|
| |||
| Methods | |||
|
| |||
| Study design | 4 | Present key elements of study design early in the paper | 3 |
|
| |||
| Setting | 5 | Describe the setting, locations, and relevant dates, including periods of recruitment, exposure, follow-up, and data collection | 3 |
|
| |||
| Participants | 6 | (a) Give the eligibility criteria, and the sources and methods of selection of participants. Describe methods of follow-up | 3 |
|
| |||
| (b) For matched studies, give matching criteria and number of exposed and unexposed | - | ||
|
| |||
| Variables | 7 | Clearly define all outcomes, exposures, predictors, potential confounders, and effect modifiers. Give diagnostic criteria, if applicable | 4-5 |
|
| |||
| Data sources/ measurement | 8* | For each variable of interest, give sources of data and details of methods of assessment (measurement). Describe comparability of assessment methods if there is more than one group | 4-5 |
|
| |||
| Bias | 9 | Describe any efforts to address potential sources of bias | - |
|
| |||
| Study size | 10 | Explain how the study size was arrived at | 3 |
|
| |||
| Quantitative variables | 11 | Explain how quantitative variables were handled in the analyses. If applicable, describe which groupings were chosen and why | 4-5 |
| Statistical methods | 12 | (a) Describe all statistical methods, including those used to control for confounding | 4-5 |
|
| |||
| (b) Describe any methods used to examine subgroups and interactions | 4-5 | ||
|
| |||
| (c) Explain how missing data were addressed | - | ||
|
| |||
| (d) If applicable, explain how loss to follow-up was addressed | - | ||
|
| |||
| (e) Describe any sensitivity analyses | - | ||
|
| |||
| Results | |||
|
| |||
| Participants | 13* | (a) Report numbers of individuals at each stage of study—eg numbers potentially eligible, examined for eligibility, confirmed eligible, included in the study, completing follow-up, and analysed | 5 |
|
| |||
| (b) Give reasons for non-participation at each stage | - | ||
|
| |||
| (c) Consider use of a flow diagram | Figure 1 |
||
|
| |||
| Descriptive data | 14* | (a) Give characteristics of study participants (eg demographic, clinical, social) and information on exposures and potential confounders | 5 |
|
| |||
| (b) Indicate number of participants with missing data for each variable of interest | 5 | ||
|
| |||
| (c) Summarise follow-up time (eg, average and total amount) | - | ||
|
| |||
| Outcome data | 15* | Report numbers of outcome events or summary measures over time | 5-6 |
|
| |||
| Main results | 16 | (a) Give unadjusted estimates and, if applicable, confounder-adjusted estimates and their precision (eg, 95% confidence interval). Make clear which confounders were adjusted for and why they were included | 5-6 |
|
| |||
| (b) Report category boundaries when continuous variables were categorized | - | ||
|
| |||
| (c) If relevant, consider translating estimates of relative risk into absolute risk for a meaningful time period | - | ||
|
| |||
| Other analyses | 17 | Report other analyses done—eg analyses of subgroups and interactions, and sensitivity analyses | - |
|
| |||
| Discussion | |||
|
| |||
| Key results | 18 | Summarise key results with reference to study objectives | 6-7 |
|
| |||
| Limitations | 19 | Discuss limitations of the study, taking into account sources of potential bias or imprecision. Discuss both direction and magnitude of any potential bias | 7 |
|
| |||
| Interpretation | 20 | Give a cautious overall interpretation of results considering objectives, limitations, multiplicity of analyses, results from similar studies, and other relevant evidence | 7 |
|
| |||
| Generalisability | 21 | Discuss the generalisability (external validity) of the study results | 7 |
|
| |||
| Other information | |||
|
| |||
| Funding | 22 | Give the source of funding and the role of the funders for the present study and, if applicable, for the original study on which the present article is based | 2 |
*Give information separately for exposed and unexposed groups. Note: An Explanation and Elaboration article discusses each checklist item and gives methodological background and published examples of transparent reporting. The STROBE checklist is best used in conjunction with this article (freely available on the Web sites of PLoS Medicine at http://www.plosmedicine.org/, Annals of Internal Medicine at http://www.annals.org/, and Epidemiology at http://www.epidem.com/). Information on the STROBE Initiative is available at http://www.strobe-statement.org.
Imaging data
All enrolled patients were examined with cranial CT scans. Magnetic resonance imaging examinations were performed with a GE Signa HDxT 3.0 T Superconducting magnetic resonance imaging system (Boston, MA, USA). Relevant imaging parameters were reported in our previous study (Yang et al., 2017). The susceptibility weighted imaging parameters were as follows: time of repetition/time of echo = 36/45 ms; flip angle = 20°; contiguous slice thickness = 2 mm; matrix, 448 × 384; number of excitations = 0.75. Hematoma location was divided into lobar hematoma and non-lobar hematoma (Samarasekera et al., 2015). Cerebral hematoma volume was calculated by the formula 1/2ABC, where A was the longest diameter of the hematoma on axial CT, B was the diameter that was perpendicular to the longest diameter, and C was the product of the thickness of each layer and the thickness of adjacent layers (Boulouis et al., 2016).
LA was identified as white matter hyperintensities in the fluid attenuated inversion recovery sequence. According to the Fazekas scale (0–6), ICH patients were divided into four groups: no LA (0), mild LA (1–2), moderate LA (3–4) and severe LA (5–6) (Fazekas et al., 1987; Patti et al., 2016). LA severity was regarded as an ordinal categorical variable. Two different radiologists agreed on the assessment of the Fazekas scale (weighted kappa = 0.92; P < 0.001). Cerebral microbleeds (CMBs) were defined as round or oval lesions with a low signal intensity or loss of signal on susceptibility weighted imaging sequence. CMB diameters generally ranged from 2–5 mm, with the maximum reaching 10 mm. CMBs were divided according to severity into: mild (n = 1), moderate (n = 2–4) and severe (n ≥ 5) (Wilson et al., 2019). Silent brain infarction was defined as a round or oval lesion of cerebral spinal fluid signal with a diameter of 3 to 20 mm. Hyperintensities were shown on the T2-weighted sequence and hypointensities with a hyperintense rim were shown on fluid attenuated inversion recovery sequence. Patients with silent brain infarction should not have definite stroke history or neurological function impairments (Gupta et al., 2016).
Neurological function
The National Institute of Health Stroke Scale score (0–42) was evaluated for each ICH patient at admission to assess clinical symptom severity (Kwah and Diong, 2014). This scale consisted of 11 items of neurologic examination, including consciousness, visual fields, eye movements, facial movements, upper limb movements, lower limb movements, ataxia, sensation, language, dysarthria, and hemispatial neglect. Higher NIHSS scores indicate more severe clinical symptoms (Demchuk et al., 2012). After discharge, phone call follow-ups were implemented by the neurologists every 3 months for 1 year.
There were two prognostic endpoints: functional dependence at 3 months after onset and stroke recurrence within 1 year after onset. Functional dependence was defined as modified Rankin Scale (mRS) score > 2 (Delcourt et al., 2017). Stroke recurrence was defined as readmission to a hospital with a definite diagnosis of stroke.
Statistical analysis
SPSS 19.0 (IBM, Armonk, NY, USA) was used for linear regression analysis, logistic regression analysis and Cox regression analysis. Clinical data were compared between ICH patients with different LA levels (no vs. mild vs. moderate vs. severe). Kolmogorov-Smirnov normal test was first performed on continuous variables. If the data fit the normal distribution in the form of mean ± standard deviation (SD), one-way analysis of variance test was used. For non-normal continuous variables, the Kruskal-Wallis test was applied for comparisons of median (interquartile range). For categorical variables, the Chi-squared test or Fisher’s exact test was used for comparisons of frequency (percentage).
We used linear regression analysis to explore the effect of LA severity on admission NIHSS. Logistic regression analysis was used to investigate the relationship between LA severity and 3-month functional dependence. Cox regression analysis was used to explore the effect of LA severity on 1-year stroke recurrence. We first performed univariate regression analysis to assess for potential risk factors. And then we conducted the backward stepwise multivariate regression analysis. Age, sex and baseline clinical factors associated with dependent variables in the univariate analysis (P-value < 0.1) were included in the multivariate regression models. We also assessed ICH patients with no LA as a reference to explore the effects of mild and moderate-to-severe LA on admission NIHSS, functional dependence and stroke recurrence.
Results
Baseline data of spontaneous ICH patients
Of the 400 spontaneous ICH patients recruited for the study, 20 patients did not have completed clinical or radiological data, 18 patients did not have prognostic data, and 5 patients refused to participate in the study. Therefore, 43 ICH patients were excluded. Of the 357 included ICH patients, 83 patients did not have LA, 64 patients had mild LA, 98 patients had moderate LA and 112 patients had severe LA (Figure 1). During the 1-year follow-up, 7 patients died because of stroke recurrences, 1 patient died due to lung infection and 1 patient died because of heart disease. The mean age of the final cohort was 63 ± 13 years. Two hundred and seventy-three patients (66.4%) were male. The median hematoma volume was 5.5 mL (interquartile range, 2.0–12.8 mL), the median score of admission NIHSS was 3 (interquartile range, 2–6), and the median score of admission Glasgow coma scale (GCS) was 15 (interquartile range, 15–15). When the baseline characteristics of the study population were divided by LA severity, we found that age, hypertension, prior stroke, admission NIHSS, admission glucose, CMBs, functional dependence and stroke recurrence differed between LA severity groups (Table 1).
Figure 1.

Flow chart of patient assignment.
ICH: Intracerebral hemorrhage; LA: leukoaraiosis.
Table 1.
Baseline characteristics of the study population divided by LA severity
| No LA (n = 83) | Mild LA (n = 64) | Moderate LA (n = 98) | Severe LA (n = 112) | P-value | |
|---|---|---|---|---|---|
| Age (yr) | 56.7±14.4 | 59.1±11.8 | 62.8±12.0 | 69.5±11.0 | < 0.001 |
| Male | 60 (72.3) | 46 (71.9) | 63 (64.3) | 68 (60.7) | 0.266 |
| Drinking | 26 (31.3) | 19 (29.7) | 22 (22.4) | 25 (22.3) | 0.379 |
| Smoking | 29 (34.9) | 26 (40.6) | 31 (31.6) | 31 (27.7) | 0.345 |
| Hypertension | 59 (74.7) | 57 (91.9) | 75 (80.6) | 91 (88.3) | 0.017 |
| Diabetes mellitus | 8 (8.4) | 5 (7.8) | 18 (18.4) | 17 (15.2) | 0.115 |
| Prior stroke | 7 (8.4) | 10 (15.6) | 16 (16.3) | 37 (33.0) | < 0.001 |
| Atrial fibrillation | 1 (1.2) | 4 (6.3) | 6 (6.1) | 6 (5.4) | 0.375 |
| Antiplatelet use | 9 (11.0) | 9 (14.1) | 10 (10.2) | 20 (17.9) | 0.368 |
| Statins use | 6 (7.2) | 3 (4.7) | 4 (4.1) | 12 (10.2) | 0.239 |
| NIHSS | 2 (1–5) | 2 (1–6) | 4 (2–6) | 3 (2–7) | 0.009 |
| GCS | 15 (15–15) | 15 (14–15) | 15 (14–15) | 15 (15–15) | 0.373 |
| SBP (mmHg) | 150.5±24.2 | 152.4±25.1 | 155.4±24.2 | 158.1±22.4 | 0.138 |
| DBP (mmHg) | 86.8±14.7 | 88.0±13.4 | 88.9±14.9 | 88.6±14.7 | 0.77 |
| MAP (mmHg) | 108.1±16.4 | 109.4±15.4 | 111.1±16.4 | 111.8±15.6 | 0.379 |
| Glucose (mM) | 6.2±2.1 | 5.6±1.5 | 6.6±2.9 | 5.8±1.6 | 0.025 |
| Cholesterol (mM) | 4.7±1.1 | 4.6±1.3 | 4.7±1.1 | 4.7±1.0 | 0.766 |
| TG (mM) | 1.7±1.2 | 1.8±1.3 | 1.8±1.5 | 1.6±1.1 | 0.853 |
| LDL (mM) | 3.1±1.0 | 3.0±1.0 | 2.9±0.9 | 2.9±0.9 | 0.385 |
| HDL (mM) | 1.2±0.3 | 1.2±0.5 | 1.3±0.7 | 1.3±1.0 | 0.507 |
| BUN (mM) | 6.0±4.6 | 5.6±4.0 | 5.2±1.6 | 5.4±1.9 | 0.376 |
| Cr (μM) | 71.5 (58.3–86.0) | 70.5 (62–81.0) | 72.0 (61.5–82.0) | 72.0 (57.5–91.5) | 0.942 |
| Imaging characteristics | |||||
| Hematoma volume (cm3) | 7.0 (3.1–13.5) | 6.0 (1.9–16.2) | 5.1 (2.1–12.0) | 4.8 (1.7–10.4) | 0.354 |
| Hematoma location (lobar/non-lobar) | 17 (20.5) | 15 (23.4) | 18 (18.4) | 35 (31.3) | 0.137 |
| SBI | 12 (14.5) | 9 (14.1) | 13 (13.3) | 22 (19.6) | 0.584 |
| CMBs | 1 (0–4) | 1 (0–3) | 2 (0–5) | 5 (1–12) | < 0.001 |
| Prognosis | |||||
| Functional dependence | 6 (7.2) | 8 (12.5) | 25 (25.5) | 23 (20.5) | 0.006 |
| Stroke recurrence | 5 (6.0) | 4 (6.3) | 16 (16.3) | 18 (16.1) | 0.039 |
Data are expressed as number (percentage), mean ± SD or median (interquartile range) as appropriate. For continuous variables, if the data fit the normal distribution, one-way analysis of variance test was used. For non-normal continuous variables, the Kruskal-Wallis test was applied. For categorical variables, the Chi-squared test or Fisher’s exact test was used. BUN: Blood urea nitrogen; CMBs: cerebral microbleeds; Cr: creatinine; DBP: diastolic blood pressure; GCS: Glasgow Coma Scale; HDL: high density lipoprotein; LA: leukoaraiosis; LDL: low density lipoprotein; MAP: mean arterial pressure; NIHSS: National Institutes of Health Stroke Scale; SBI: silent brain infarction; SBP: systolic blood pressure; TG: triglyceride.
LA severity is associated with admission NIHSS in linear regression analysis
The severity of clinical symptoms at admission was measured by NIHSS (0–42). We first performed univariate regression analysis to identify risk factors that might be associated with admission NIHSS (Additional Table 1). Then, variables with a P value < 0.1 in the univariate analysis were included in the regression model for multivariate analysis. We found that LA severity, hematoma volume and admission glucose were positively correlated with admission NIHSS in ICH patients. Additionally, the clinical symptoms of patients with lobar ICH were milder than those of patients with non-lobar ICH (Table 2).
Additional Table 1.
LA severity is associated with admission NIHSS score in univariate linear regression analysis
| B | Beta | t | P | |
|---|---|---|---|---|
| Age | -0.001 | -0.003 | -0.065 | 0.949 |
| Male | 0.225 | 0.026 | 0.491 | 0.624 |
| Drinking | 1.114 | 0.120 | 2.270 | 0.024 |
| Smoking | 0.231 | 0.027 | 0.503 | 0.616 |
| Hypertension | -0.586 | -0.055 | -1.002 | 0.317 |
| Diabetes mellitus | -0.770 | -0.064 | -1.206 | 0.229 |
| Prior stroke | 0.224 | 0.022 | 0.412 | 0.681 |
| Atrial fibrillation | -0.209 | -0.011 | -0.206 | 0.837 |
| Prior antiplatelet use | -0.393 | -0.033 | -0.620 | 0.536 |
| Prior statins use | -0.381 | -0.024 | -0.450 | 0.653 |
| Admission SBP | 0.024 | 0.140 | 2.656 | 0.008 |
| Admission DBP | 0.026 | 0.094 | 1.777 | 0.076 |
| Admission MAP | 0.032 | 0.126 | 2.401 | 0.017 |
| Admission glucose | 0.315 | 0.167 | 3.183 | 0.002 |
| Admission cholesterol | 0.138 | 0.037 | 0.686 | 0.493 |
| Admission TG | 0.171 | 0.051 | 0.956 | 0.340 |
| Admission LDL | 0.138 | 0.030 | 0.569 | 0.569 |
| Admission HDL | 0.562 | 0.097 | 1.819 | 0.070 |
| Admission BUN | -0.003 | -0.002 | -0.039 | 0.969 |
| Admission Cr | -0.001 | -0.013 | -0.253 | 0.800 |
| Hematoma volume | 0.189 | 0.432 | 8.899 | <0.001 |
| Hematoma location (lobar/non-lobar) | -1.481 | -0.155 | -2.954 | 0.003 |
| SBI | 1.201 | 0.107 | 2.032 | 0.043 |
| CMBs | 0.026 | 0.044 | 0.821 | 0.412 |
| LA severity | 0.374 | 0.105 | 1.992 | 0.047 |
LA severity was entered as an ordinal categorical variable (no vs. mild vs. moderate vs. severe). BUN: blood urea nitrogen; CMBs: cerebral microbleeds; Cr: creatinine; DBP: diastolic blood pressure; HDL: high density lipoprotein; LA: leukoaraiosis; LDL: low density lipoprotein; MAP: mean arterial pressure; SBI: silent brain infarction; SBP: systolic blood pressure; TG: triglyceride.
Table 2.
LA severity is associated with admission NIHSS score in multivariate linear regression analysis
| B | Beta | t-value | P-value | |
|---|---|---|---|---|
| Age | 0.003 | 0.009 | 0.186 | 0.852 |
| Drinking | 0.419 | 0.045 | 0.968 | 0.334 |
| Admission SBP | 0.006 | 0.037 | 0.795 | 0.427 |
| Admission glucose | 0.350 | 0.187 | 4.167 | < 0.001 |
| Admission HDL | 0.343 | 0.060 | 1.321 | 0.188 |
| Hematoma volume | 0.233 | 0.532 | 11.316 | < 0.001 |
| Hematoma location (lobar/non-lobar) | –3.056 | –0.314 | –6.682 | < 0.001 |
| SBI | 0.630 | 0.057 | 1.262 | 0.208 |
| LA severity | 0.554 | 0.154 | 3.390 | 0.001 |
| Mild | 0.246 | 0.029 | 0.440 | 0.661 |
| Moderate to severe | 1.162 | 0.127 | 2.468 | 0.014 |
LA severity was entered as an ordinal categorical variable (no vs. mild vs. moderate vs. severe). HDL: High density lipoprotein; LA: leukoaraiosis; SBI: silent brain infarction; SBP: systolic blood pressure.
LA severity is associated with 3-month functional dependence in logistic regression analysis
During the follow-up period, 62 patients (17.4%) experienced functional dependence at 3 months from onset; of those, 6 (7.2%) had no LA, 8 (12.5%) had mild LA and 48 (22.9%) had moderate-to-severe LA. We first performed univariate regression analysis (Additional Table 2), followed by multivariate regression analysis. LA severity, age, hematoma volume and hematoma location were associated with 3-month functional dependence in ICH patients (Table 3).
Additional Table 2.
LA severity is associated with 3-month functional dependence in univariate logistic regression analysis
| OR (95%CI) | P value | |
|---|---|---|
| Age | 1.038 (1.015-1.061) | 0.001 |
| Male | 1.309 (0.743-2.306) | 0.351 |
| Drinking | 0.904 (0.478-1.708) | 0.755 |
| Smoking | 0.888 (0.491-1.605) | 0.695 |
| Hypertension | 0.735 (0.361-1.497) | 0.396 |
| Diabetes mellitus | 0.811 (0.345-1.906) | 0.631 |
| Prior stroke | 1.245 (0.642-2.415) | 0.517 |
| Atrial fibrillation | 2.069 (0.702-6.100) | 0.188 |
| Antiplatelet use | 0.512 (0.194-1.350) | 0.176 |
| Statins use | 0.631 (0.183-2.177) | 0.466 |
| Admission SBP | 0.999 (0.988-1.011) | 0.901 |
| Admission DBP | 0.987 (0.967-1.006) | 0.178 |
| Admission MAP | 0.992 (0.975-1.010) | 0.381 |
| Admission glucose | 1.074 (0.961-1.201) | 0.210 |
| Admission cholesterol | 0.976 (0.757-1.259) | 0.853 |
| Admission TG | 0.986 (0.784-1.240) | 0.903 |
| Admission LDL | 0.959 (0.707-1.301) | 0.788 |
| Admission HDL | 0.228 (0.894-1.687) | 0.205 |
| Admission BUN | 0.995 (0.908-1.090) | 0.910 |
| Admission Cr | 1.000 (0.996-1.003) | 0.881 |
| Hematoma volume | 1.060 (1.032-1.088) | <0.001 |
| Hematoma location (lobar/non-lobar) | 0.644 (0.319-1.301) | 0.220 |
| SBI | 1.369 (0.675-2.776) | 0.384 |
| CMBs | 1.020 (0.983-1.057) | 0.296 |
| LA severity | 1.452 (0.120-1.883) | 0.005 |
LA severity was entered as an ordinal categorical variable (no vs. mild vs. moderate vs. severe). Functional dependence was defined as modified Rankin Scale score >2. BUN: blood urea nitrogen; CMBs: cerebral microbleeds; Cr: creatinine; DBP: diastolic blood pressure; HDL: high density lipoprotein; LA: leukoaraiosis; LDL: low density lipoprotein; MAP: mean arterial pressure; SBI: silent brain infarction; SBP: systolic blood pressure; TG: triglyceride.
Table 3.
LA severity is associated with 3-month functional dependence in multivariate logistic regression analysis
| OR (95% CI) | P-value | |
|---|---|---|
| Age | 1.045 (1.016–1.074) | 0.002 |
| Hematoma volume | 1.093 (1.058–1.129) | < 0.001 |
| Hematoma location (lobar/non-lobar) | 0.234 (0.096–0.572) | 0.001 |
| LA severity | 1.403 (1.030–1.910) | 0.032 |
| Mild | 1.644 (0.506–5.342) | 0.409 |
| Moderate to severe | 3.043 (1.164–7.953) | 0.023 |
LA severity was entered as an ordinal categorical variable (no vs. mild vs. moderate vs. severe). Functional dependence was defined as modified Rankin Scale score > 2. LA: Leukoaraiosis.
Moderate-to-severe LA is associated with 1-year stroke recurrence in Cox regression analysis
Forty-three patients (11.7%) suffered stroke recurrences within 1 year from onset; of those, 30 patients suffered from cerebral infarction, 12 suffered from ICH and one suffered from mixed stroke. In patients with no LA, five people (7.8%) were diagnosed with recurrent stroke, four with cerebral infarction and one with ICH. In mild LA patients, four people (6.3%) were diagnosed with recurrent stroke, three with cerebral infarction and one with ICH. In moderate-to-severe LA patients, 34 people (16.2%) were diagnosed with recurrent stroke, 23 with cerebral infarction, 10 with ICH and one with mixed stroke. Univariate analysis was first performed to identify risk factors associated with stroke recurrence (Additional Table 3). A multivariate binary stepwise Cox regression analysis indicated that moderate-to-severe LA, admission triglyceride and silent brain infarction were related to 1-year stroke recurrence in ICH patients (Table 4).
Additional Table 3.
LA severity is associated with 1-year stroke recurrence in univariate Cox regression analysis
| HR (95%CI) | P value | |
|---|---|---|
| Age | 1.034 (1.009-1.059) | 0.007 |
| Male | 1.803 (0.990-3.282) | 0.054 |
| Drinking | 0.730 (0.350-1.521) | 0.401 |
| Smoking | 0.970 (0.512-1.835) | 0.925 |
| Hypertension | 0.812 (0.376-1.754) | 0.596 |
| Diabetes mellitus | 1.792 (0.859-3.736) | 0.120 |
| Prior stroke | 0.646 (0.273-1.531) | 0.321 |
| Atrial fibrillation | 1.512 (0.468-4.888) | 0.490 |
| Antiplatelet use | 0.633 (0.226-1.771) | 0.384 |
| Statins use | 0.960 (0.297-3.104) | 0.946 |
| Admission SBP | 0.995 (0.983-1.008) | 0.475 |
| Admission DBP | 0.982 (0.961-1.004) | 0.101 |
| Admission MAP | 0.987 (0.968-1.006) | 0.178 |
| Admission Glucose | 1.035 (0.920-1.166) | 0.566 |
| Admission Cholesterol | 1.016 (0.769-1.344) | 0.910 |
| Admission TG | 1.182 (0.985-1.420) | 0.072 |
| Admission LDL | 0.961 (0.687-1.344) | 0.815 |
| Admission HDL | 1.054 (0.740-1.502) | 0.770 |
| Admission BUN | 1.044 (0.980-1.112) | 0.178 |
| Admission Cr | 1.001 (0.998-1.003) | 0.530 |
| Hematoma volume | 1.018 (0.990-1.047) | 0.205 |
| Hematoma location (lobar/non-lobar) | 0.969 (0.478-1.969) | 0.931 |
| SBI | 3.039 (1.623-5.692) | <0.001 |
| CMBs | 1.026 (0.990-1.063) | 0.159 |
| LA severity | 1.195 (1.036-1.378) | 0.014 |
LA severity was entered as an ordinal categorical variable (no vs. mild vs. moderate vs. severe). Stroke recurrence was defined as readmission to hospital with a definite diagnosis of stroke. BUN: blood urea nitrogen; CMBs: cerebral microbleeds; Cr: creatinine; DBP: diastolic blood pressure; HDL: high density lipoprotein; LA: leukoaraiosis; LDL: low density lipoprotein; MAP: mean arterial pressure; SBI: silent brain infarction; SBP: systolic blood pressure; TG: triglyceride.
Table 4.
Moderate-to-severe LA is associated with 1-year stroke recurrence in multivariate Cox regression analysis
| HR (95% CI) | P-value | |
|---|---|---|
| Age | 1.025 (0.999–1.053) | 0.063 |
| Male | 1.256 (0.664–2.379) | 0.483 |
| Admission TG | 1.198 (1.015–1.413) | 0.033 |
| Hematoma location (lobar/non-lobar) | 0.759 (0.360–1.600) | 0.468 |
| SBI | 2.965 (1.571–5.597) | 0.001 |
| LA severity | 1.300 (0.959–1.762) | 0.091 |
| Mild | 1.359 (0.332–5.567) | 0.670 |
| Moderate to severe | 2.712 (1.058–6.948) | 0.038 |
LA severity was entered as an ordinal categorical variable (no vs. mild vs. moderate vs. severe). Stroke recurrence was defined as readmission to hospital with a definite diagnosis of stroke. LA: Leukoaraiosis; SBI: silent brain infarction; TG: triglyceride.
Discussion
In the present study, we investigated the relationships between LA severity and clinical symptom severity at admission, functional dependence and stroke recurrence in mild ICH patients. We found that LA severity was positively associated with admission clinical symptom severity and 3-month functional dependence. In addition, moderate-to-severe LA was an independent predictor for 1-year stroke recurrence.
Our data showed that LA severity was positively associated with admission NIHSS score in mild ICH patients. LA severity was also positively associated with hematoma volume and location. These results suggest that LA severity may influence the early clinical manifestation. The ability to withstand acute hemorrhagic injury may be partly dependent on good cerebral blood flow and collateral flow and the integrity of white matter tracts connecting different parts of the brain. However, severe LA destroys white matter fiber integrity and reduces vascular density. It has been reported that reduced vascular density and microcirculatory dysfunction are associated with the aggravation of LA (Wardlaw et al., 2013). This may explain why LA severity was associated with admission NIHSS score in ICH patients in the present study. A previous study reported that in patients with small vessel occlusion stroke, higher LA volume was related to higher admission NIHSS score (Ryu et al., 2017), which is consistent with our findings in mild ICH patients. Our findings suggest that in mild ICH patients, it is necessary to consider the potential influence of LA severity on admission NIHSS score, in addition to hematoma volume and location.
In addition, we found that ICH patients with severe LA were more likely to experience poor functional outcome and recurrent stroke. A previous study reported that moderate-to-severe LA was related to 3-month functional dependence for ICH patients; the study used the visual rating scale (0–4) to assess the extent of LA (Uniken Venema et al., 2019). In our study, the Fazekas scale was adopted to grade the severity of LA, and also demonstrated that LA severity was associated with functional outcomes in ICH patients. Furthermore, Kumral et al. (2015) reported that mild stroke patients with LA had a higher recurrent stroke risk within 5 years. Our study adds to these findings by showing that in ICH patients, moderate-to-severe LA was associated with 1-year stroke recurrence. LA can lead to the destruction of myelin and proliferation of glial cells, and subsequently slow down neural network reorganization (Joutel and Chabriat, 2017; Shaaban et al., 2017). These findings might explain the role of LA on worsening functional outcome. Microcirculatory dysfunction and decline in cerebrovascular angiogenesis were found to be related to the aggravation of LA (Yang et al., 2018). The influence of LA on the blood–brain barrier, cerebral blood flow, and cerebrovascular angiogenesis may contribute to the worse outcome and higher recurrence in ICH patients.
To the best of our knowledge, this is the first study to explore the relationship between LA and clinical symptom severity at admission in mild ICH patients. There were some limitations that should be addressed. First, the number of patients with recurrent cerebral infarction was insufficient, which made effective logistic regression analysis impossible, as was the number of patients with recurrent ICH. Therefore, we had to combine recurrent cerebral infarction cases and recurrent ICH cases as recurrent stroke. Second, our results showed that mild LA had no effect on stroke recurrence, which might be due to the relatively small sample sizes or short follow-up periods. Finally, we recruited conscious ICH patients who had relatively mild symptoms and did not require surgery from neurology wards. The median hematoma volume (5.5 mL, interquartile range: 2.0–12.8 mL) of the enrolled patients was smaller than what has been reported in other studies (Boulouis et al., 2016), which may contribute to the lack of association between LA and hematoma volume in this study.
In conclusion, we found that LA severity was positively associated with clinical symptom severity at the time of admission, 3-month functional dependence and 1-year stroke recurrence in mild ICH patients. These findings suggest that LA may be a useful marker of individual brain ICH vulnerability, which can be characterized by poor ICH tolerance and recovery ability. Assessment of LA severity in mild ICH patients may help neurologists optimize therapeutic decisions.
Additional files:
Additional file 1 (1.9MB, pdf) : Hospital ethics approval (Chinese).
Additional file 2 (121.1KB, pdf) : Informed consent form (Chinese).
Additional file 3: STROBE checklist.
Additional file 4: Open peer review report 1 (88.4KB, pdf) .
Additional Table 1: LA severity is associated with admission NIHSS score in univariate linear regression analysis.
Additional Table 2: LA severity is associated with 3-month functional dependence in univariate logistic regression analysis.
Additional Table 3: LA severity is associated with 1-year stroke recurrence in univariate Cox regression analysis.
Footnotes
P-Reviewer: Davenpor ND; C-Editor: Zhao M; S-Editors: Yu J, Li CH; L-Editors: McCollum L, Yu J, Song LP; T-Editor: Jia Y
Conflicts of interest: The authors declare no conflicts of interest.
Financial support: The study was supported by the National Natural Science Foundation of China, Nos. 81771281 (to FXS), 81471177 (to FXS); and the Natural Science Foundation of Shanghai of China, No. 20ZR1434200 (to YF). The funding bodies played no role in the study design, collection, analysis and interpretation of data, in the writing of the report, or in the decision to submit the paper for publication.
Institutional review board statement: This study was approved by the Ethics Committee of Ruijin Hospital, which is affiliated with Shanghai Jiao Tong University School of Medicine (approval No. 12) on March 10, 2011.
Declaration of patient consent: The authors certify that they have obtained all appropriate patient consent forms from the patients. In the forms, the patients have given their consent for their images and other clinical information to be reported in the journal. The patients understand that their names and initials will not be published and due efforts will be made to conceal the patients’ identity.
Reporting statement: This study followed the Strengthening the Reporting of Observational Studies in Epidemiology (STROBE) guidance for protocol reporting.
Biostatistics statement: The statistical methods of this study were reviewed by the Department of Epidemiology and Biostatistician, School of public health, Shanghai Jiao Tong University.
Copyright license agreement: The Copyright License Agreement has been signed by all authors before publication.
Data sharing statement: Patient-related data will be shared upon request by the corresponding author or any qualified investigator.
Plagiarism check: Checked twice by iThenticate.
Peer review: Externally peer reviewed.
Open peer reviewer: Nicholas D. Davenport, Minneapolis Veterans Affairs Health Care System, USA.
Funding: The study was supported by the National Natural Science Foundation of China, Nos. 81771281 (to FXS), 81471177 (to FXS); and the Natural Science Foundation of Shanghai of China, No. 20ZR1434200 (to YF).
References
- 1.Boulouis G, van Etten ES, Charidimou A, Auriel E, Morotti A, Pasi M, Haley KE, Brouwers HB, Ayres AM, Vashkevich A, Jessel MJ, Schwab KM, Viswanathan A, Greenberg SM, Rosand J, Goldstein JN, Gurol ME. Association of key magnetic resonance imaging markers of cerebral small vessel disease with hematoma volume and expansion in patients with lobar and deep intracerebral hemorrhage. JAMA Neurol. 2016;73:1440–1447. doi: 10.1001/jamaneurol.2016.2619. [DOI] [PMC free article] [PubMed] [Google Scholar]
- 2.Caprio FZ, Maas MB, Rosenberg NF, Kosteva AR, Bernstein RA, Alberts MJ, Prabhakaran S, Naidech AM. Leukoaraiosis on magnetic resonance imaging correlates with worse outcomes after spontaneous intracerebral hemorrhage. Stroke. 2013;44:642–646. doi: 10.1161/STROKEAHA.112.676890. [DOI] [PubMed] [Google Scholar]
- 3.Cesana BM, Antonelli P. Sample size calculations in clinical research should also be based on ethical principles. Trials. 2016;17:149. doi: 10.1186/s13063-016-1277-5. [DOI] [PMC free article] [PubMed] [Google Scholar]
- 4.Debette S, Markus HS. The clinical importance of white matter hyperintensities on brain magnetic resonance imaging: systematic review and meta-analysis. BMJ. 2010;341:c3666. doi: 10.1136/bmj.c3666. [DOI] [PMC free article] [PubMed] [Google Scholar]
- 5.Debette S, Schilling S, Duperron MG, Larsson SC, Markus HS. Clinical significance of magnetic resonance imaging markers of vascular brain injury: a systematic review and meta-analysis. JAMA Neurol. 2019;76:81–94. doi: 10.1001/jamaneurol.2018.3122. [DOI] [PMC free article] [PubMed] [Google Scholar]
- 6.Delcourt C, Sato S, Zhang S, Sandset EC, Zheng D, Chen X, Hackett ML, Arima H, Hata J, Heeley E, Al-Shahi Salman R, Robinson T, Davies L, Lavados PM, Lindley RI, Stapf C, Chalmers J, Anderson CS INTERACT2 Investigators. Intracerebral hemorrhage location and outcome among INTERACT2 participants. Neurology. 2017;88:1408–1414. doi: 10.1212/WNL.0000000000003771. [DOI] [PMC free article] [PubMed] [Google Scholar]
- 7.Demchuk AM, Dowlatshahi D, Rodriguez-Luna D, Molina CA, Blas YS, Dzialowski I, Kobayashi A, Boulanger JM, Lum C, Gubitz G, Padma V, Roy J, Kase CS, Kosior J, Bhatia R, Tymchuk S, Subramaniam S, Gladstone DJ, Hill MD, Aviv RI, et al. Prediction of haematoma growth and outcome in patients with intracerebral haemorrhage using the CT-angiography spot sign (PREDICT): a prospective observational study. Lancet Neurol. 2012;11:307–314. doi: 10.1016/S1474-4422(12)70038-8. [DOI] [PubMed] [Google Scholar]
- 8.Fazekas F, Chawluk JB, Alavi A, Hurtig HI, Zimmerman RA. MR signal abnormalities at 1. 5 T in Alzheimer’s dementia and normal aging. AJR Am J Roentgenol. 1987;149:351–356. doi: 10.2214/ajr.149.2.351. [DOI] [PubMed] [Google Scholar]
- 9.Feigin VL, Nguyen G, Cercy K, Johnson CO, Alam T, Parmar PG, Abajobir AA, Abate KH, Abd-Allah F, Abejie AN, Abyu GY, Ademi Z, Agarwal G, Ahmed MB, Akinyemi RO, Al-Raddadi R, Aminde LN, Amlie-Lefond C, Ansari H, et al. GBD 2016 Lifetime Risk of Stroke Collaborators. Global, regional, and country-specific lifetime risks of stroke, 1990 and 2016. N Engl J Med. 2018;379:2429–2437. doi: 10.1056/NEJMoa1804492. [DOI] [PMC free article] [PubMed] [Google Scholar]
- 10.Gupta A, Giambrone AE, Gialdini G, Finn C, Delgado D, Gutierrez J, Wright C, Beiser AS, Seshadri S, Pandya A, Kamel H. Silent brain infarction and risk of future stroke: a systematic review and meta-analysis. Stroke. 2016;47:719–725. doi: 10.1161/STROKEAHA.115.011889. [DOI] [PMC free article] [PubMed] [Google Scholar]
- 11.Hainsworth AH, Minett T, Andoh J, Forster G, Bhide I, Barrick TR, Elderfield K, Jeevahan J, Markus HS, Bridges LR. Neuropathology of white matter lesions, blood-brain barrier dysfunction, and dementia. Stroke. 2017;48:2799–2804. doi: 10.1161/STROKEAHA.117.018101. [DOI] [PMC free article] [PubMed] [Google Scholar]
- 12.Hall CN, Reynell C, Gesslein B, Hamilton NB, Mishra A, Sutherland BA, O’Farrell FM, Buchan AM, Lauritzen M, Attwell D. Capillary pericytes regulate cerebral blood flow in health and disease. Nature. 2014;508:55–60. doi: 10.1038/nature13165. [DOI] [PMC free article] [PubMed] [Google Scholar]
- 13.Joutel A, Chabriat H. Pathogenesis of white matter changes in cerebral small vessel diseases: beyond vessel-intrinsic mechanisms. Clin Sci (Lond) 2017;131:635–651. doi: 10.1042/CS20160380. [DOI] [PubMed] [Google Scholar]
- 14.Kumral E, Güllüoğlu H, Alakbarova N, Karaman B, Deveci EE, Bayramov A, Evyapan D, Gökçay F, Orman M. Association of leukoaraiosis with stroke recurrence within 5 years after initial stroke. J Stroke Cerebrovasc Dis. 2015;24:573–582. doi: 10.1016/j.jstrokecerebrovasdis.2014.10.002. [DOI] [PubMed] [Google Scholar]
- 15.Kwah LK, Diong J. National Institutes of Health Stroke Scale (NIHSS) J Physiother. 2014;60:61. doi: 10.1016/j.jphys.2013.12.012. [DOI] [PubMed] [Google Scholar]
- 16.Lin Q, Huang WQ, Tzeng CM. Genetic associations of leukoaraiosis indicate pathophysiological mechanisms in white matter lesions etiology. Rev Neurosci. 2015;26:343–358. doi: 10.1515/revneuro-2014-0082. [DOI] [PubMed] [Google Scholar]
- 17.Moroni F, Ammirati E, Hainsworth AH, Camici PG. Association of white matter hyperintensities and cardiovascular disease: the importance of microcirculatory disease. Circ Cardiovasc Imaging. 2020;13:e010460. doi: 10.1161/CIRCIMAGING.120.010460. [DOI] [PubMed] [Google Scholar]
- 18.Patti J, Helenius J, Puri AS, Henninger N. White matter hyperintensity-adjusted critical infarct thresholds to predict a favorable 90-day outcome. Stroke. 2016;47:2526–2533. doi: 10.1161/STROKEAHA.116.013982. [DOI] [PMC free article] [PubMed] [Google Scholar]
- 19.Ryu WS, Woo SH, Schellingerhout D, Jang MU, Park KJ, Hong KS, Jeong SW, Na JY, Cho KH, Kim JT, Kim BJ, Han MK, Lee J, Cha JK, Kim DH, Lee SJ, Ko Y, Cho YJ, Lee BC, Yu KH, et al. Stroke outcomes are worse with larger leukoaraiosis volumes. Brain. 2017;140:158–170. doi: 10.1093/brain/aww259. [DOI] [PMC free article] [PubMed] [Google Scholar]
- 20.Samarasekera N, Fonville A, Lerpiniere C, Farrall AJ, Wardlaw JM, White PM, Smith C, Al-Shahi Salman R. Influence of intracerebral hemorrhage location on incidence, characteristics, and outcome: population-based study. Stroke. 2015;46:361–368. doi: 10.1161/STROKEAHA.114.007953. [DOI] [PubMed] [Google Scholar]
- 21.Shaaban CE, Aizenstein HJ, Jorgensen DR, MacCloud RL, Meckes NA, Erickson KI, Glynn NW, Mettenburg J, Guralnik J, Newman AB, Ibrahim TS, Laurienti PJ, Vallejo AN, Rosano C LIFE Study Group. In vivo imaging of venous side cerebral small-vessel disease in older adults: an MRI method at 7T. AJNR Am J Neuroradiol. 2017;38:1923–1928. doi: 10.3174/ajnr.A5327. [DOI] [PMC free article] [PubMed] [Google Scholar]
- 22.Tripathi R, Khatri N, Mamde A. Sample size and sampling considerations in published clinical research articles. J Assoc Physicians India. 2020;68:14–18. [PubMed] [Google Scholar]
- 23.Uniken Venema SM, Marini S, Lena UK, Morotti A, Jessel M, Moomaw CJ, Kourkoulis C, Testai FD, Kittner SJ, Brouwers HB, James ML, Woo D, Anderson CD, Rosand J. Impact of cerebral small vessel disease on functional recovery after intracerebral hemorrhage. Stroke. 2019;50:2722–2728. doi: 10.1161/STROKEAHA.119.025061. [DOI] [PMC free article] [PubMed] [Google Scholar]
- 24.Wardlaw JM, Smith C, Dichgans M. Mechanisms of sporadic cerebral small vessel disease: insights from neuroimaging. Lancet Neurol. 2013;12:483–497. doi: 10.1016/S1474-4422(13)70060-7. [DOI] [PMC free article] [PubMed] [Google Scholar]
- 25.Wilson D, Ambler G, Lee KJ, Lim JS, Shiozawa M, Koga M, Li L, Lovelock C, Chabriat H, Hennerici M, Wong YK, Mak HKF, Prats-Sánchez L, Martínez-Domeño A, Inamura S, Yoshifuji K, Arsava EM, Horstmann S, Purrucker J, Lam BYK, et al. Cerebral microbleeds and stroke risk after ischaemic stroke or transient ischaemic attack: a pooled analysis of individual patient data from cohort studies. Lancet Neurol. 2019;18:653–665. doi: 10.1016/S1474-4422(19)30197-8. [DOI] [PMC free article] [PubMed] [Google Scholar]
- 26.Yan F, Yi Z, Hua Y, Shen Y, Li M, Ding Y, Chandra A, Ji X, Yue W. Predictors of mortality and recurrent stroke within five years of intracerebral hemorrhage. Neurol Res. 2018;40:466–472. doi: 10.1080/01616412.2018.1451266. [DOI] [PubMed] [Google Scholar]
- 27.Yang K, Feng Y, Mu J, Fu N, Chen S, Fu Y. The presence of previous cerebral microbleeds has a negative effect on hypertensive intracerebral hemorrhage recovery. Front Aging Neurosci. 2017;9:49. doi: 10.3389/fnagi.2017.00049. [DOI] [PMC free article] [PubMed] [Google Scholar]
- 28.Yang Y, Cai Y, Zhang Y, Liu J, Xu Z. Exosomes secreted by adipose-derived stem cells contribute to angiogenesis of brain microvascular endothelial cells following oxygen-glucose deprivation in vitro through microRNA-181b/TRPM7 axis. J Mol Neurosci. 2018;65:74–83. doi: 10.1007/s12031-018-1071-9. [DOI] [PubMed] [Google Scholar]
- 29.Yu Z, Zheng J, Guo R, Ma L, You C, Li H. Prognostic significance of leukoaraiosis in intracerebral hemorrhage: A meta-analysis. J Neurol Sci. 2019;397:34–41. doi: 10.1016/j.jns.2018.12.022. [DOI] [PubMed] [Google Scholar]
- 30.Zhu S, Qian S, Xu T, Peng H, Dong R, Wang D, Yuan X, Guo L, Zhang Y, Geng D, Zhong C. White matter hyperintensity, immediate antihypertensive treatment, and functional outcome after acute ischemic stroke. Stroke. 2020;51:1608–1612. doi: 10.1161/STROKEAHA.119.028841. [DOI] [PubMed] [Google Scholar]
Associated Data
This section collects any data citations, data availability statements, or supplementary materials included in this article.