

Abstract
Different proteoform products of the same gene can exhibit differing associations with health and disease, and their patterns of modifications may offer more precise markers of phenotypic differences between individuals. However, currently employed protein-biomarker discovery and quantification tools, such as bottom-up proteomics and ELISAs, are mostly proteoform-unaware. Moreover, the current throughput for proteoform-level analyses by liquid chromatography mass spectrometry (LCMS) for quantitative top-down proteomics is incompatible with population-level biomarker surveys requiring robust, faster proteoform analysis. To this end, we developed immunoprecipitation coupled to SampleStream mass spectrometry (IP-SampleStream-MS) as a high-throughput, automated technique for the targeted quantification of proteoforms. We applied IP-SampleStream-MS to serum samples of 25 individuals to assess the proteoform abundances of apolipoproteins A-I (ApoA-I) and C-III (ApoC-III). The results for ApoA-I were compared to those of LCMS for these individuals, with IP-SampleStream-MS showing a >7-fold higher throughput with >50% better analytical variation. Proteoform abundances measured by IP-SampleStream-MS correlated strongly to LCMS-based values (R2 = 0.6–0.9) and produced convergent proteoform-to-phenotype associations, namely, the abundance of canonical ApoA-I was associated with lower HDL-C (R = 0.5) and glycated ApoA-I with higher fasting glucose (R = 0.6). We also observed proteoform-to-phenotype associations for ApoC-III, 22 glycoproteoforms of which were characterized in this study. The abundance of ApoC-III modified by a single N-acetyl hexosamine (HexNAc) was associated with indices of obesity, such as BMI, weight, and waist circumference (R ~ 0.7). These data show IP-SampleStream-MS to be a robust, scalable workflow for high-throughput associations of proteoforms to phenotypes.
Graphical Abstract

INTRODUCTION
Protein products of the same gene can be widely heterogeneous.1 Chemical modifications to the wild-type primary structure of proteins can range from genetic and translational variation, as in the case of allelic and splicing variants, to post-translational modifications, such as backbone truncations or side-chain modifications.2 These sources of variation create a host of chemically distinct gene products (different proteoforms), which may interact differently with other biomolecules, participate in different biochemical pathways, and carry out different functions.
Proteomic reports and recent work from our group have proposed that the different proteoforms of a given gene can be differentially associated with a phenotype.3,4 Indeed, if reproduced in larger, population-representative studies, these results suggest that, when used as quantitative markers of phenotype, not only can some proteoforms be more useful than others (i.e., more strongly associated with the phenotype) but also specific proteoforms can be better markers than the proteoform-unaware total protein marker concentration. This would suggest that proteoform-resolved measurements, which account for the different chemical variants of their protein analytes, can lead to the discovery of better biomarkers.
Nevertheless, the currently most-used protein biomarker discovery and quantification technologies, such as bottom-up proteomics and ELISA, are incapable of streamlined proteoform-stratified quantification. Specifically, the preanalytical digestion used in bottom-up proteomics destroys the information necessary for the reconstruction of all proteoformspecies in a sample.5,6 Moreover, for immunoassays such as ELISA, different antibodies need to be developed for each proteoform (which requires prior knowledge of the different species)7 and cross-reactivity between the proteoforms of the same gene may happen, depending on the target epitope. On the contrary, top-down proteomics, powered by recent developments in high-resolution mass spectrometry and high-pressure liquid chromatography,8 has allowed for the establishment of relatively straightforward workflows for the full chemical characterization of gene products and subsequent quantification of the discovered proteoforms.9,10
However, the current throughput of proteoform profiling by top-down proteomics is incompatible with the large sampling necessary for population-representative biomarker development. Unlike radiation-based technologies such as ELISA, measurements by mass spectrometry are not easily parallelized. Moreover, while parallel measurements can be achieved by chemical labeling in bottom-up mass spectrometry, these techniques are largely incompatible with top-down proteomics, which mostly uses label-free quantification,9,11 resulting in one sample being analyzed per each measurement. Finally, reliance on liquid chromatography for online separations of complex samples increases the time necessary for each measurement. Liquid chromatography mass spectrometry (LCMS) is especially inefficient in targeted analyses, where the focus is in the proteoforms of a single gene. In that case, it is likely that a small portion of the run time of each measurement—the window of retention time at which proteoforms of the target gene elute—is actually of interest.
The recent evidence of value in proteoform-resolved measurements and the aforementioned shortcomings of LCMS call for the development of a higher throughput proteoform profiling technique, which quickly generates and injects MS-compatible and concentrated samples of the protein products from a human gene of interest, forgoing the need for upstream liquid chromatography. Such a methodology would ideally reduce per-measurement time and thus increase the efficiency of MS instrument time usage.
To that end, we bring forth immunoprecipitation coupled to SampleStream mass spectrometry (IP-SampleStream-MS) as a streamlined and high-throughput workflow for gene-targeted proteoform profiling. In this workflow, offline, multiplexed immunoprecipitation is used for targeted protein separations. Then, samples are directly ported into a SampleStream platform,12 where each sample is quickly picked up, concentrated, buffer-exchanged, and injected into the MS. Different intact masses, corresponding to the profile of proteoforms of the target protein that were captured by the antibodies used, are then observed and quantified. Herein, we analyze the usefulness of this workflow for high-throughput proteoform profiling and compare it to previous results from LCMS-based studies (Figure 1).
Figure 1.

General study design comparing two approaches for profiling of apolipoprotein proteoforms. Serum samples of 25 well-phenotyped CARDIA participants were submitted to either reverse-phase LCMS (top)—the traditional top-down-proteomic technique for proteoform quantification9—or IP-SampleStream-MS. The IP-SampleStream-MS approach to proteoform profiling starts from a targeted immunoprecipitation (left). Using magnetic beads and an automated sample-handling platform (Thermo KingFisher), immunoprecipitation is parallelized and automated. Then, samples are transferred to SampleStream for buffer-exchange, concentration, and course filtering based on molecular weight. Each sample is then automatically injected into the MS, allowing for targeted observation of the proteoform profile of different samples in quick succession. Herein, we compared the efficacy and throughput of these two approaches toward characterizing associations between proteoform abundance and phenotype.
We employed IP-SampleStream-MS to analyze two target proteins: apolipoprotein A-I (ApoA-I) and C-III (ApoC-III). Both these proteins have been previously shown to be markers of different cardiometabolic characteristics. ApoA-I is the major structural protein of high-density lipoprotein (HDL) particles and a mediator of reverse cholesterol transport.10,13,14 Higher serum ApoA-I concentrations are associated with higher HDL cholesterol (HDL-C), HDL efflux, and lower indices of obesity.15 Moreover, previous work from our group suggests different proteoforms of ApoA-I are differentially associated with metabolic characteristics.10 Concurrently, serum ApoC-III is associated with higher triglycerides, low-density lipoprotein cholesterol (LDL-C), and lower HDL cholesterol.16–19 While some proteoforms of ApoC-III have been previously described20,21 and previous work has suggested specific glycoforms to be associated with disease,22,23 no extensive study has been done to characterize the association of different proteoforms of ApoC-III to cardiometabolic phenotype.
METHODS
Study Cohort.
Samples were obtained from the CARDIA study. Details of the CARDIA cohort have been described elsewhere.24 Briefly, CARDIA is a community-based cohort, designed to study the development of cardiovascular disease risk factors and their clinical sequelae in white and black young adults in the US. Between 1985 and 1986, 5115 participants between the ages of 18 and 30 years old, 51.5% black, and 54.5% women were enrolled. At baseline and at each subsequent examination, participants underwent extensive in-person measurement of CVD risk factors. Participants returned for examination at years 2, 5, 7, 10, 15, 20, 25, and 30, with 70% of the surviving cohort examined at Year 30. Risk factors were measured, and samples were stored for all follow-up examinations.
Race, sex, medication use, tobacco use, alcohol use, and prevalent CVD status were assessed via self-report. Blood was obtained via venipuncture of the antecubital vein from participants in the fasting state, and serum was sent for lipid subfraction analysis as well as fasting glucose. Samples were frozen at −80 °C indefinitely.
Sample Selection.
For a previous study, 150 participant serum samples of CARDIA Year 20 collections were selected on the basis of carotid artery calcification (CAC) status and HDL-C. These were oversampled for HDL-C outliers to maximize the probability of detection of low-frequency proteoforms. A “2 × 3” sampling approach was used on the basis of prevalent CAC and HDL-C values at Year 20. The cohort was stratified into each of 6 categories: [(CAC = 0, CAC > 0) by (HDL-C > 60 mg/dL, HDL-C 40–60 mg/dL, HDL-C < 40 mg/dL)], and then, a random sample of 25 participants was selected from each CAC/HDL-C subgroup, for a total of 150.
For this study, we selected a random subset of 25 serum samples from the previous 150 and used this same subset for LCMS and IP-SampleStream-MS. This allowed for a direct comparison of ApoA-I proteoform profiling between a single LCMS block and IP-SampleStream-MS of the same 25 individuals. The aggregate characteristics of the individuals used in this study are shown in Table 1.
Table 1.
Characteristics of the 25 CARDIA Participants Used in This Studya
| characteristic | value |
|---|---|
| female | 40% |
| age (y) | 46 (4) |
| education | 16 (3) |
| BMI(kg/m2) | 28.9 (5.7) |
| height (in) | 172 (10) |
| weight (lb) | 190 (48) |
| waist circumference (cm) | 95 (18) |
| smoker | 20% |
| SBP (mmHg) | 114 (11) |
| DBP (mmHg) | 71 (7) |
| Rx for blood pressure | 10% |
| total cholesterol (mg/dl) | 190 (44) |
| HDL-C (mg/dl) | 51 (21) |
| LDL-C (mg/dl) | 110 (36) |
| triglycerides (mg/dl) | 146 (122) |
| Rx for triglycerides | 20% |
| Rx for diabetes | 10% |
| fasting glucose (mg/dl) | 110 (49) |
| diabetes | 20% |
| CAC presence | 50% |
| total CAC | 29 (59) |
| HDL efflux | 1.1 (0.2) |
BMI: body mass index; SBP/DBP: systolic/diastolic blood pressure; “Rx for”: using drug treatment for. Binary characteristics are shown in percentage points, and continuous values are shown as means with the standard deviation shown in parentheses.
Immunoprecipitation.
Immunoprecipitation was performed on a KingFisher Flex Purification System (Thermo Fisher, Waltham, MA). For all experiments, a 1:1 antibody-bead solution was prepared prior to the immunoprecipitation assay, using either goat polyclonal anti-ApoA-I or goat polyclonal anti-ApoC-III antibody (A03 and A12, respectively, Academy Bio-Medical Company, Houston, TX) and Pierce protein A/G magnetic beads (Thermo Fisher, Waltham, MA), and this was dissolved 10× in ammonium bicarbonate buffer (100 mM, pH 7.4). Enough volume was made to account for all reactions in each experiment, and the solution was left incubating overnight at 4 °C with gentle shaking. A method was generated in the KingFisher platform to automate the next steps of the immunoprecipitation. Briefly, 500 μL of the bead/antibody solution was aliquoted per well of a 96-well plate, beads were picked up by a magnetic comb and incubated with a solution of 7 μL of serum and 493 μL of ammonium bicarbonate buffer for 2 h at room temperature, and then the immunocomplexed beads were submitted to wash steps followed by an elution step. For ApoA-I precipitation, three wash steps of 10 min each were employed, using 1 mL of ammonium bicarbonate buffer each at room temperature, followed by a 10 min elution step in 5% acetonitrile and 1% formic acid in water at 90 °C. For ApoC-III, five wash steps were done all at room temperature and for 10 min: first, the beads were washed in 1 mL of ammonium bicarbonate buffer three times and then washed twice in Wash Buffer B (Pierce MS-compatible Magnetic IP Kit, Thermo Fisher, Waltham, MA). Finally, ApoC-III was eluted at 90 °C for 10 min in 30% acetonitrile and 1% formic acid in water.
Western Blotting.
Immunoprecipitated samples were submitted to SDS-PAGE analysis, using Mini-Protean TGX gels (BioRad, Hercules, CA). Then, gels were transferred using iBlot dry transfer (Thermo Fisher Scientific, Waltham, MA) at 25 V for 6 min. The membranes were then incubated in water at 4 °C until ready to block. Blocking was done using a solution of 5% powder milk (Nestle, Vevey, Switzerland) in 0.1% Tween 20 tris-buffered saline (TBS-T) for 1 h at room temperature. Goat anti-ApoA-I (RRID-AB_1238779, Academy Biomedical Company, Houston, TX) and goat anti-ApoC-III (RRID-AB_1238917, Academy Biomedical Company, Houston, TX) were used as the respective primary antibodies for each Western blot and were added to fresh 5% milk solution at a dilution of 1/5000; the membrane was left to incubate with the primary antibody overnight at 4 °C. Following primary incubation, the membranes were washed with TBS-T three times for 5 min each. The membranes were then blocked with a secondary anti-goat antibody at 1/5000 for 1 h at room temperature. Following secondary incubation, the membranes were again washed with TBS-T three times for 5 min. Luminata Forte HRP (Merk, Burlington, MA) substrate was then used to incubate the membrane for ~30 s, and the membrane was then analyzed using an iBrightCL1000 Imager (Invitrogen, Carlsbad, CA). The membrane was analyzed with the “Chemi Blot” protocol, with imaging done using the “smart exposure” feature.
SampleStream Online Sample Preparation and Injection.
Samples eluted from multiplexed immunoprecipitation were transferred to a SampleStream platform (Integrated Protein Technologies, Evanston, IL). SampleStream functioning and method development was previously described elsewhere.12 For ApoA-I proteoform profiling, a method was generated to pick up 40 μL of sample, focus onto a 5 kDa MWCO membrane (Millipore, Burlington, MA) with 187.5 μL of MS buffer (30% acetonitrile and 0.2% acetic acid in water) at a focus flow rate of 120 μL/min, and then elute online with the mass spectrometer with 87.5 μL of MS buffer at 60 μL/min, to a method total of 3.25 min. A blank (of 5% acetonitrile and 1% formic acid in water) was run after each sample. For ApoC-III, a similar method was employed, using a 3 kDa MWCO membrane and MS buffer blanks.
Sample Preparation for ApoC-III Proteoform Discovery.
For the targeted discovery of ApoC-III proteoforms, apolipoprotein pulldown was performed with PHM-L LIP-OSORB resin (Millipore, Burlington, MA). Briefly, 7 mg of resin was dissolved in 100 μL of ammonium bicarbonate buffer (see above) and left swelling for 15 min under gentle shaking. Then, 20 μL of a pooled serum sample was added to the slurry, and the mixture was incubated for 10 min. Following centrifugation for 10 min at 3000 rpm, the precipitated resin was washed twice for 10 min with 1 mL of ammonium bicarbonate buffer, and proteins were eluted by a 10 min, 95 °C incubation in 100 μL of 10% SDS in ammonium bicarbonate buffer. Finally, SDS was removed following a previously published methanol/chloroform/water precipitation protocol.25 The apolipoprotein precipitate was then re-eluted in 60 μL of 5% acetonitrile and 0.2% formic acid in water and submitted to LCMS.
Liquid Chromatography.
For samples submitted to LCMS, the following setup was used: a 100 μm internal diameter (ID), 2 cm-long “trap” column was packed with PLRP-S resin (Agilent, Santa Clara, CA) and set in-line with a 75 μm ID, 15 cm-long “analytical” column packed with the same resin. An aliquot of 6 μL of each sample was picked up, loaded, and washed at the trap column for 10 min with 5% acetonitrile and 0.2% formic acid (solution A). Then, loaded proteins were submitted to the following gradient for separation at the analytical column: an initial ramp from 95% solution A and 5% solution B (95% acetonitrile and 0.2% formic acid in water) to 20% solution B in 5 min, and then a 30 min ramp from 20% to 50% solution B, a 5 min wash with 90% solution B, and 10 min re-equilibration in 95% solution A, to a gradient total of 50 min. Liquid chromatography was performed online with nano-ESI mass spectrometry.
Mass Spectrometry.
For proteoform discovery and characterization, samples were analyzed on a Fusion Lumos Orbitrap (Thermo Fisher, San Jose, CA). We followed a previously published top-down-proteomic protocol for comprehensive characterization of apolipoprotein proteoforms.10 Briefly, an initial run was done to discover likely ApoC-III proteoform candidates. For this run, the instrument alternated between two modes: a “Full MS” scan from 500 to 2000 m/z and a select-ion-monitoring (SIM) scan at 1177.8–1346.2 m/z, set between two charge states of the most abundant proteoform of ApoC-III. Then, a list of observed masses consistent with small modifications to a canonical ApoC-III backbone was generated manually to be targeted for characterization. For characterization runs, the instrument operated in the previous two modes and a third, “targeted MS2” mode, at which a set of the previously identified masses was targeted for isolation and fragmentation by either high-collision dissociation (HCD) or high-collision-assisted electron-transfer dissociation (EThcD). For all scan types, quadrupolar isolation was used, AGC targets were set to 1E6, HCD pressure was set to 2 mTorr, and four microscans were collected. HCD and EThcD reaction times and collision energies were varied to optimize fragmentation-based characterization. Full MS and SIM were acquired at 120 000 resolution at 200 m/z, and MS2 was acquired at 60 000.
For IP-SampleStream quantification runs, an Orbitrap Elite (Thermo Fisher, San Jose, CA) was used. For ApoA-I proteoform profiling, the instrument cycled between Full MS mode and a SIM scan at 958–996 m/z. For ApoC-III, Full MS, a 1170–1360 m/z SIM, and a 1040–1190 m/z SIM were used. For all scan types, AGC targets were set to 1E6, the resolution was 120 000 at 200 m/z, the ultrahigh vacuum pressure was set to 0.8, and four microscans were collected.
Proteoform Characterization.
For ApoC-III proteoform characterization and post-translational modification (PTM) mapping, intact mass spectra were recorded and fragmentation data was acquired. Then, ion masses deconvoluted from the fragmentation and intact mass spectra were analyzed with the freeware ProSight Lite (http://prosightlite.northwestern.edu/)26 against ApoC-III sequence and modification variants found in the UNIMOD database (http://www.unimod.org/) and the biochemical and clinical literature on ApoC-III. Proteoforms were characterized with a classic top-down proteomics approach for proteoform discovery. Briefly, the highly resolved intact mass difference (Δm) of a proteoform to the canonical form was used to narrow the list of possible chemical modifications to the proteoform, and the presence and location of each modification was tested by fragmentation coverage of the modification site. The generated fragmentation maps were assigned P-scores for proteoform identification confidence. All graphical fragmentation maps used in this analysis, as well as proteoform identification parameters and the respective raw files have been deposited to the MassIVE database (http://massive.ucsd.edu) for this project, with the data set identifier MSV000086450. Proteoforms were also uploaded to the top-down proteomics proteoform repository (http://repository.topdownproteomics.org/).
Proteoform Quantification.
A custom R script was used to identify peaks and quantify proteoform intensities from IP-SampleStream-MS raw files. Briefly, package “mzr” was used to open raw files and search for isotopic peaks of a list of target ApoA-I or ApoC-III proteoforms. Observed isotopic distributions were compared to expected distributions, calculated using package “envipat”. Scan by scan, a correlation coefficient (Pearson’s R) of expected isotopic data and observed was generated. Proteoform intensities were quantified in scans passing R > 0.4. The intensity of each proteoform was then divided by the sum intensity of all proteoforms in each sample, to generate percent proteoform abundances. Data on proteoform percent abundance profiles for each individual was compared to phenotypic data from CARDIA, and a linear regression Pearson’s R and P-value were generated.
RESULTS AND DISCUSSION
ApoA-I Proteoforms in 25 CARDIA Participants.
We developed an immunoprecipitation method to enrich for ApoA-I from serum samples and tested by Western blot (Figure S1). This method was then used to inquire on the performance of an IP-SampleStream-MS workflow to recapitulate results from traditional, LCMS-based label-free proteoform profiling,9 a workflow previously applied to ApoA-I in a pilot study of eight participants in 2018.10 Figure 2 shows a comparison of ApoA-I proteoform results acquired by the two methodologies. Notably, ApoA-I proteoform profiling runs were performed in 6 min by SampleStream-MS, in comparison to the 35 min runs of serum samples by LCMS. Moreover, SampleStream runs included a blank, while for LCMS, a blank was run every four samples. In aggregate, this suggests a >7-fold gain in throughput with IP-SampleStream-MS.
Figure 2.

Comparison of ApoA-I proteoforms observed by LCMS (left) and IP-SampleStream-MS (right); the top two panels contrast a typical chromatogram versus a “flowgram” analyzed by LCMS and IP-SS-MS, respectively. (A) LCMS results. Different peaks correspond to the elution times of different proteins and molecules (e.g., immunoglobulin G, IgG; phospholipids, PL). Proteoforms of ApoA-I elute at three different retention times. At the middle, the Full MS scan at the main retention time of ApoA-I proteoforms (RT2). At the bottom, SIM scans set between two charge states of canonical ApoA-I, at the different retention times. Notably, a different profile of proteoforms of ApoA-I is observable at the different retention times. At RT3, ApoA-I modified by different fatty acids (from left to right: palmitic, oleic, arachidonic, and docohexaenoic acylations) can be observed. (B) IP-SampleStream-MS results. At the top, the flowgram (i.e., the elution profile of multiple samples, as analyzed by SampleStream-MS). A single peak—corresponding to one individual’s sample—is shown separately, underneath. All observed proteoforms of ApoA-I elute at the same time. At the middle, the Full MS scan at elution time. At the bottom, the SIM scan at elution time, where proteoforms of ApoA-I can be observed.
However, not all proteoforms were observable by both methods. Table 2 shows ApoA-I proteoform abundance of measurements with the different techniques. A noncovalent adduct of H3PO4, common in the ESI-MS of serum samples, which had been observed in LCMS runs, was not present in immunoprecipitated samples subjected to SampleStream-MS. Moreover, lowerabundant proteoforms such as ProApoA-I and fatty acylations (fatty-acid-modified forms) of ApoA-I, both of which eluted from the LC at different retention times (Figure 2A) than the abundant proteoforms of ApoA-I (such as canonical and truncated ApoA-I), were not observed in IP-SampleStream-MS. Importantly, however, fatty acylations were observed in the LCMS runs of immunoprecipitated ApoA-I (Figure S2), suggesting that proteoform differences between the methodologies are not fully explained by proteoform-preferential affinity at the immunoprecipitation step, and differences in dynamic range for proteoform detection likely arise at the analytical steps.
Table 2.
Average Abundance and Average Per-Sample Standard Deviation (SD) from the Abundance Mean of Different ApoA-I Proteoforms As Observed by LCMS and IP-SampleStream-MS
| proteoform | abundance LCMS | average SD LCMS | abundance IP-SampleStream-MS | average SD IP-SampleStream-MS |
|---|---|---|---|---|
| canonical | 0.812 | 0.017 | 0.604 | 0.013 |
| mono-oxidation | 0.071 | 0.007 | 0.100 | 0.006 |
| dehydration | 0.091 | 0.003 | ||
| truncation | 0.060 | 0.005 | 0.066 | 0.002 |
| di-oxidation | 0.016 | 0.005 | 0.065 | 0.005 |
| H3PO4 adduct | 0.013 | 0.004 | ||
| tri-oxidation | 0.010 | 0.004 | 0.051 | 0.005 |
| ProApoA1 | 0.010 | 0.004 | ||
| glycation | 0.009 | 0.002 | 0.022 | 0.003 |
| oleic acylation | 0.0041 | 0.0007 | ||
| palmitic acylation | 0.0018 | 0.0003 | ||
| arachidonic acylation | 0.0012 | 0.0002 | ||
| docohexaenoic acylation | 0.0006 | 0.0002 |
Figure 3 shows a comparison of the proteoform quantification from LCMS and IP-SampleStream-MS. We observed strong and significant correlation between the relative abundances of proteoforms for the same individuals as measured by the two different methods, with R2 values ranging from 0.62 to 0.91 (Figure 3A). Interestingly, the average coefficient of variation (CV = SD/mean) for the common proteoforms between techniques was higher at LCMS (Table 2, average CV = 8.7%) than IP-SampleStream-MS (average CV = 3.7%). Moreover, data from the IP-SampleStream-MS process had 40% higher levels of mono-oxidation on average than with LCMS, as well as higher levels of other oxidized states, and subsequently lower values of the canonical proteoform. Nevertheless, while the average levels of oxidation introduced by the two techniques was different, the relative, interindividual distribution of oxidized ApoA-I abundances was strongly correlated between experiments, suggesting that the differences in endogenous oxidation levels were observable by both techniques.
Figure 3.

Comparison of LCMS and IP-SampleStream-MS proteoform profiling for the same 25 individuals. (A) Correlation of percent proteoform abundances between IP-SampleStream-MS and LCMS. Bars represent standard deviation; an R2, a P-score, and a shaded confidence interval of the linear regression are shown. (B) Correlation coefficient heatmaps of proteoform abundance to phenotype. Only commonly observed proteoforms were used for this analysis. Colors represent different correlation strengths (Pearson’s R), as depicted in the color key. Asterisks represent the significance of the association at a 5% false discovery rate. (C) Example scatterplots of the significant associations observed by the two proteoform profiling methods. Bars represent standard deviation; a Pearson’s R, a P-score, and a shaded confidence interval of the linear regression are shown.
Oxidation may shine a light on the underpinnings of the ~2× lower analytical variation when using IP-SampleStream-MS. Notably, although samples showed higher oxidation states in IP-SampleStream-MS—likely due to increased sample handling for immunoprecipitation—ApoA-I oxidation abundance variation (CV) was lower in this experiment than that by LCMS (note error bars in Figure 3 and average standard deviations in Table 2). This likely suggests that the prolonged LCMS analysis time results in less precision in proteoform profiling due in part to sample degradation by oxidation. Conversely, the higher throughput allowed by IP-Sample-Stream-MS may reduce the analytical effects of instrument drift and sample degradation overtime.
Further, we calculated the association of ApoA-I proteoform abundances as measured by IP-SampleStream-MS and LCMS to individuals’ cardiometabolic phenotype and compared the results (Figure 3B,C). IP-SampleStream-MS closely reproduced aggregate results of proteoform association to phenotype observed with LCMS. Most notably, the percent glycation of ApoA-I as measured by IP-SampleStream-MS was positively associated with an individual’s fasting glucose levels, while canonical ApoA-I percent abundance was associated with lower HDL cholesterol.
ApoC-III Proteoform Discovery and Characterization.
Prior to proteoform quantification, we set out to better characterize the proteoform profile of ApoC-III in human serum. Figure 4 shows the observed LCMS data for proteoforms of ApoC-III in an apolipoprotein-specific pulldown of pooled serum. Using HCD and EThcD, we were able to confidently identify several observed masses as ApoC-III and characterize their mass shifts from unmodified ApoC-III as different glycosylation and oxidation patterns. Raw data, fragmentation maps, and proteoform identification parameters were uploaded to the MassIVE database (http://massive.ucsd.edu) for this project, with the data set identifier MSV000086450. In total, we observed 22 different glycosylation states of ApoC-III, many differing from one another by one or two glycans. Characterized modification masses matched glycan patterns containing hexoses (Hex), N-acetylhexosamines (HexNAc), desoxyhexoses (dHex, likely fucoses), a pentose (Pent, likely xylose), and sialic acids, such as neuraminic acid (NeuAc). Importantly, for most intact masses, fragments covering the different glycosylations were observed, and mapping data was consistent with modifications to the T74 residue, (e.g., in Figure 4B), as previously shown for ApoC-III.27
Figure 4.
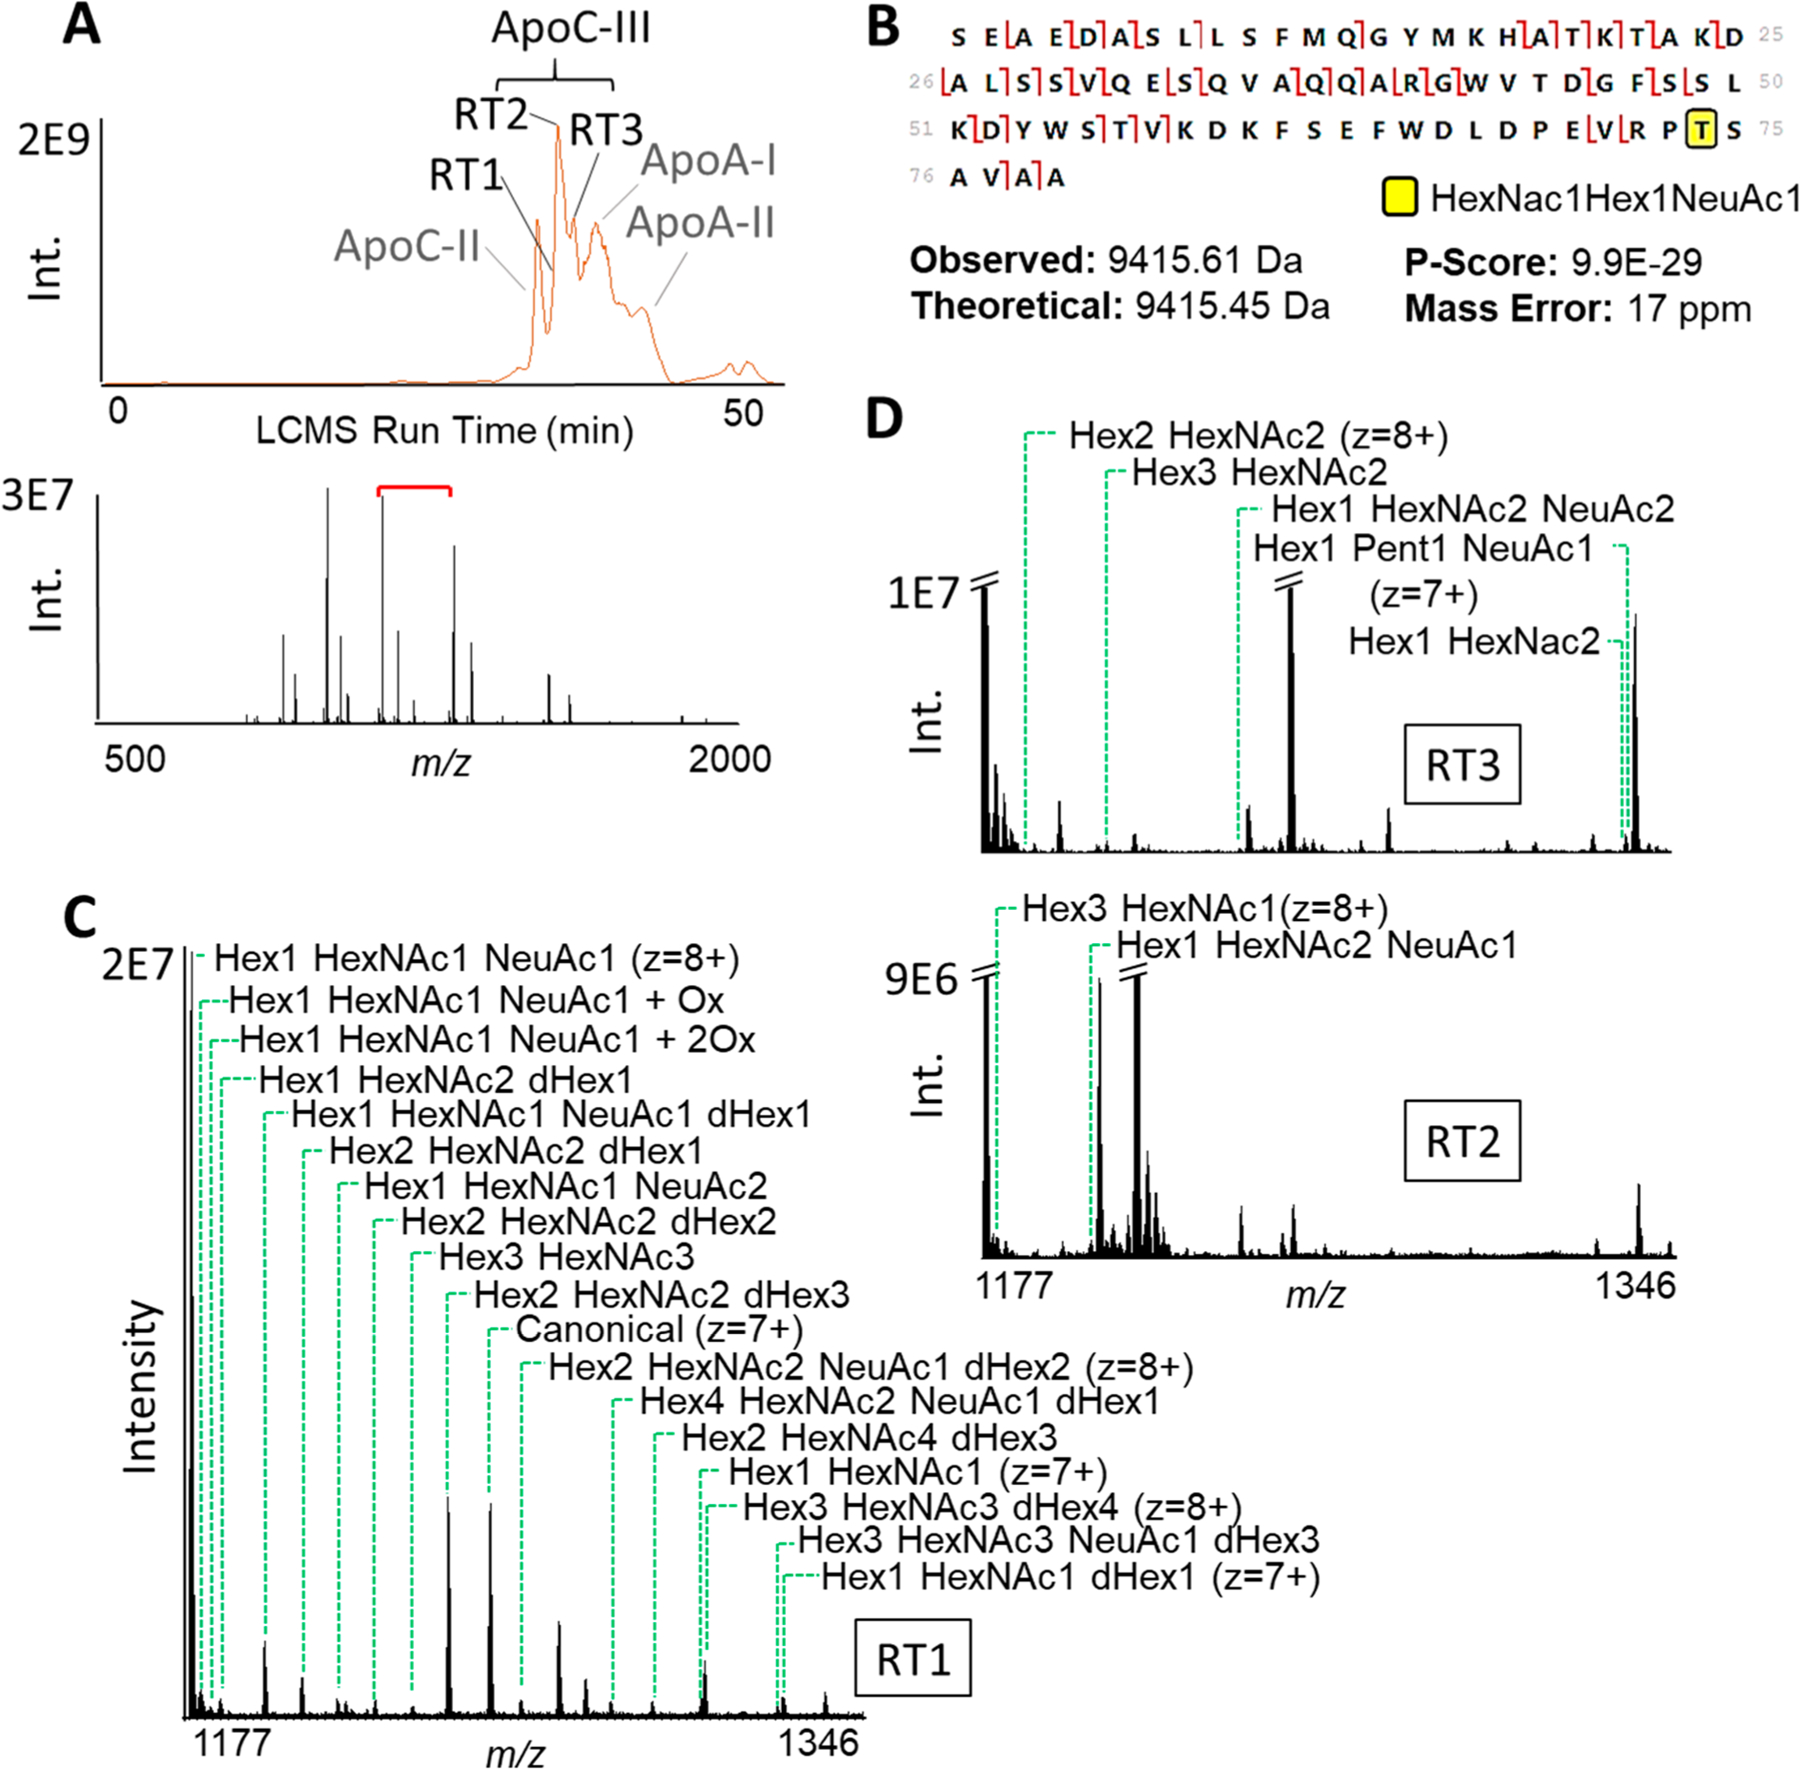
Proteoforms of ApoC-III observable by LCMS of an apolipoprotein-specific pulldown of human serum. (A) At the top, a typical chromatogram of this sample. Different peaks correspond to the elution times of different apolipoproteins. Proteoforms of ApoC-III elute at three different retention times. At the top, the Full MS scan at the main retention time of ApoC-III proteoforms (RT2); the red bracket shows the window used for SIM scans. (B) Characterization of an ApoC-III proteoform by EThcD. Fragments that cover T74, the previously reported glycosylation site of ApoC-III,27 carry a mass shift corresponding to the combination of Hex, HexNac, and NeuAc masses. Intact mass, overall fragmentation, and coverage of the modified site confidently identify this proteoform. P-score is reported for proteoform identification. (C and D) SIM scans set between two charge states of Hex1 HexNac1 NeuAc1 ApoC-III, at the different retention times. Notably, different proteoforms of ApoC-III are observable at different retention times.
Accounting for the dehydration and oxidations of the different glycoforms, a total of 30 ApoC-III proteoforms were identified by LCMS in this study (Table 3). While this is the most extensive attempt on ApoC-III proteoform characterization, several of these have previously been observed.21,23 Most notably, Nicolardi et al.21 described 10 glycoforms of ApoC-III (including the unmodified canonical) by high-resolution matrix-assisted laser desorption/ionization (MALDI)-MS, also observing several instances of multiply fucosylated and sialylated ApoC-III. Importantly, however, four proteoforms reported in Nicolardi et al. were not observed in the present study, all of which were reported not be present in all serum samples (n = 96) in that study. Moreover, unlike the present report, fragmentation-based characterization was not used in that work, and glycosylation masses were inferred only on the basis of intact mass shifts.
Table 3.
Average Abundance of ApoC-III Proteoforms in LCMS Runs of Pooled Serum and Across the 25 CARDIA Samples, by IP-SampleStream-MSa
| proteoform | abundance LCMS | abundance IP-SampleStream-MS |
|---|---|---|
| Hex1HexNAc1NeuAc1 + dehydration | 0.0014 | |
| Hex1 HexNAc1 NeuAc1 | 0.48 | 0.17 |
| Hex1HexNAc1NeuAc1 + mono-oxidation | 0.011 | 0.015 |
| Hex1HexNAc1NeuAc1 + di-oxidation | 0.008 | 0.012 |
| Hex1HexNAc1NeuAc1 + tri-oxidation | 0.003 | 0.012 |
| Hex1 HexNAc1 NeuAc2 | 0.333 | 0.047 |
| Hex1 HexNAc1 NeuAc2 + oxidation | 0.0025 | |
| Hex1 HexNAc1 NeuAc2 + di-oxidation | 0.00016 | |
| dehydration | 0.0013 | 0.0017 |
| canonical | 0.082 | 0.055 |
| mono-oxidation | 0.00019 | |
| Hex1 Pent1 NeuAc1 | 0.040 | |
| Hex2 HexNAc2 dHex1 | 0.030 | |
| Hex2 HexNAc2 dHex3 | 0.010 | 0.015 |
| Hex1 HexNAc1 NeuAc1 dHex1 | 0.0090 | 0.0054 |
| Hex1 HexNAc1 NeuAc1 dHex1 + oxidation | 0.00010 | |
| Hex1 HexNAc2 NeuAc2 | 0.0048 | |
| Hex1 HexNAc2 | 0.0040 | |
| Hex1 HexNAc1 dHex1 | 0.0038 | 0.015 |
| Hex3 HexNAc3 dHex4 | 0.0029 | |
| HexNAc1 + dehydration | 0.0087 | |
| HexNAc1 | 0.0022 | 0.045 |
| Hex2 HexNAc2 NeuAc1 dHex2 | 0.0022 | |
| Hex1 HexNAc1 + dehydration | 0.0058 | |
| Hex1 HexNAc1 | 0.00078 | 0.56 |
| Hex1 HexNAc1 + mono-oxidation | 0.036 | |
| Hex1 HexNAc1 + di-oxidation | 0.025 | |
| Hex1 HexNAc1 + tri-oxidation | 0.021 | |
| Hex4 HexNAc2 NeuAc1 dHex1 | 0.00060 | |
| Hex3 HexNAc2 | 0.00053 | |
| Hex2 HexNAc4 dHex3 | 0.00051 | |
| Hex2 HexNAc2 dHex2 | 0.00051 | |
| Hex1 HexNAc2 dHex1 | 0.00040 | |
| Hex3 HexNAc3 | 0.00025 | |
| Hex2 HexNAc2 | 0.00017 | |
| Hex3 HexNAc1 | 2.8 × 10⁻⁵ | |
| Hex3 HexNAc3 NeuAc1 dHex3 | 1.7 × 10⁻⁵ |
Proteoforms are ordered by decreasing abundance of the main glycoform by LCMS.
ApoC-III Proteoform Profiling by IP-SampleStream-MS.
We developed an immunoprecipitation protocol for the enrichment of ApoC-III from serum (Figure S3) and employed IP-SampleStream-MS for a comparison of ApoC-III proteoform profiles in different individuals. Figure 5 shows the proteoforms of ApoC-III observable by IP-SampleStream-MS. Also in this case, the run time for ApoC-III proteoform profiling was >10-fold shorter by SampleStream-MS than that by LCMS (5.5 for sample and blank versus 60 min per LCMS run). However, similar to ApoA-I results, we observed a reduced number of proteoforms after IP-SampleStream-MS in comparison to those of LCMS (Table 3). Notably, only 8 of the 22 ApoC-III glycoforms observed by LCMS were observed, and most of the lower abundance proteoforms were not observed by IP-SampleStream-MS. Importantly, a number of the low-abundance proteoforms unobserved by IP-SampleStream-MS were present in LCMS runs of immunoprecipitated ApoC-III (Figure S4), further suggesting that differences in proteoform dynamic range arise at the analytical level rather than during immunoprecipitation. Furthermore, as with ApoA-I, higher levels of oxidation and dehydration of ApoC-III glycoforms were also observed in IP-SampleStream-MS.
Figure 5.

Observation of ApoC-III proteoforms by IP-SampleStream-MS. (A) SampleStream-MS flowgram of ApoC-III samples for proteoform profiling. (B) Elution peak for a single sample. (C) Full MS scan at elution time. The red bracket shows the window used for SIM scans. (D) SIM scan at elution time, where the proteoforms of ApoC-III could be observed.
We quantified the percent abundance of the observable ApoC-III proteoforms in the same 25 individuals from the CARDIA study.24 Figure 6 shows proteoform-profile-to phenotype association results for the some of the commonly observed ApoC-III glycoforms across individuals. While different glycoforms showed different association patterns with phenotype, only associations of one proteoform were significant, namely, a higher percent abundance of HexNAc1 ApoC-III was associated with higher indices of obesity in these individuals. Interestingly, this proteoform was also strongly negatively associated with HDL-C. However, the confidence in this association did not pass a 5% false discovery rate.
Figure 6.

Association of ApoC-III glycoproteoform abundances and cardiometabolic phenotype. (A) Correlation coefficient heatmaps of glycoform abundance to phenotype. Only proteoforms commonly observed across all 25 individuals were used for this analysis. Colors represent different correlation strengths (Pearson’s R), as depicted in the key. Asterisks represent the significance of the association at a 5% false discovery rate. (B) Example scatterplot of a significant association. Bars represent standard deviation; a Pearson’s R, a P-score, and a shaded confidence interval of the linear regression are shown.
While this is the first report of such an association, other associations of glycosylation of ApoC-III and metabolic phenotype have been reported before.22,23,28,29 In several reports, the sialylation of ApoC-III (ApoC-III containing NeuAc) was associated with higher LDL-C and triglycerides,28 metabolic syndrome,23 or diabetes.22,29 Interestingly, we observed positive associations of a sialylated proteoform (Hex1 HexNac1 NeuAc1) with triglycerides, fasting glucose, and, to a lower extent, LDL-C; however, these associations were not significant above a 5% false discovery rate in the 25 individuals studied here.
Strengths and Limitations.
The current results serve as proof-of-concept and provide benchmarks for proteoform profiling by the IP-SampleStream-MS method. This approach takes advantage of the ability to parallelize immunoprecipitation reactions offline and then concentrate, buffer-exchange, and inject relatively pure protein samples quickly for MS analysis. The IP-SampleStream-MS method was able to greatly reduce per-sample instrument time usage when compared to that of the LCMS methods previously optimized for ApoA-I and ApoC-III. While LCMS requires column equilibration and the separation of contaminants and coelutants in the retention-time dimension, SampleStream can quickly prepare IP samples for MS and proteoform profiling can be done in few scans per sample. Furthermore, in our results, the increase in sample throughput was associated with lower analytical variation.
Overall, these data suggest that IP-SampleStream-MS has the potential to greatly increase proteoform profiling throughput and thus increase feasible sample sizes in proteoform-biomarker discovery studies. Importantly, we were able to recapitulate ApoA-I proteoform-to-phenotype associations previously discovered with LCMS by IP-Sample-Stream-MS. Moreover, when applying this method to novel targets, such as ApoC-III glycoforms, we were able to discover new associations to phenotype.
The main shortcoming of SampleStream-MS derives from the lack of separations and manifests as a loss in ability to detect low-abundance proteoforms. Reverse-phase liquid chromatography separates proteoforms by hydrophobicity in the retention time dimension, which reduces the proteoform complexity in each scan and thus allows for higher dynamic ranges in proteoform abundance. Nevertheless, immunoprecipitation processes and MS methods can be further optimized to ensure that proteoforms of interest are observed at quantitative intensities. For example, the use of FAIMS or ion mobility on the millisecond time scales can be readily combined with the IP-SampleStream-MS workflow to target lower abundance species. Moreover, the dependency on immunoprecipitation may also reduce the number of proteoforms observed, depending on the proteoform biases of the antibody used. Importantly, while antibody binding biases may change the absolute proteoform abundances from the endogenous ones, sample-to-sample relative differences in proteoform abundance are likely to be maintained, allowing for the characterization of proteoform-to-phenotype associations.
CONCLUSIONS
We bring forth IP-SampleStream-MS as a new methodology for gene-targeted proteoform profiling. Once proteoforms have been systematically discovered, this technology is compatible with population-scale studies involving thousands of samples in a tractable time scale. The IP-SampleStream-MS approach recapitulated proteoform associations on the basis of LCMS at >7-fold the sample processing rate and utilizing far faster per-sample run times. Moreover, using IP-SampleStream-MS, we showed novel ApoC-III proteoform associations to markers of cardiometabolic phenotype. Our results indicate that IP-SampleStream-MS will be a useful workflow in validating the proteoform markers of cardiovascular health and disease.
Supplementary Material
ACKNOWLEDGMENTS
Work performed for this study was funded by the National Institutes of Health under grant UH3 CA246635-02 (N.L.K.), K23 HL133601-03 (J.T.W.), the American Heart Association, under grant SDG 27250022 (J.T.W.), and the National Institute of General Medical Sciences, under grant P41 GM108569 (N.L.K.). The content is solely the responsibility of the authors and does not necessarily represent the official views of the National Institutes of Health. The Coronary Artery Risk Development in Young Adults Study (CARDIA) is conducted and supported by the National Heart, Lung, and Blood Institute (NHLBI) in collaboration with the University of Alabama at Birmingham (HHSN268201800005I & HHSN268201800007I), Northwestern University (HHSN268201800003I), University of Minnesota (HHSN268201800006I), and Kaiser Foundation Research Institute (HHSN268201800004I). This manuscript has been reviewed by CARDIA for scientific content. The authors would like to thank Dr. Allan Sniderman and Dr. Donald Lloyd-Jones for reviews and comments that helped to further this article.
Footnotes
Supporting Information
The Supporting Information is available free of charge at https://pubs.acs.org/doi/10.1021/jasms.1c00026.
Figures of Western blots and LCMS data (PDF)
Complete contact information is available at: https://pubs.acs.org/10.1021/jasms.1c00026
The authors declare the following competing financial interest(s): Authors N.L.K. and P.D.C. report a conflict of interest with Integrated Protein Technologies, the supplier of the SampleStream system used in this work.
Contributor Information
Henrique dos Santos Seckler, Department of Chemistry, Chemistry of Life Processes Institute and Proteomics Center of Excellence, Northwestern University, Evanston, Illinois 60208, United States;.
Hae-Min Park, Department of Chemical Engineering and Applied Chemistry, Chungnam National University, Daejeon 34134, South Korea.
Cameron M. Lloyd-Jones, Department of Chemistry, Chemistry of Life Processes Institute and Proteomics Center of Excellence, Northwestern University, Evanston, Illinois 60208, United States
Rafael D. Melani, Department of Chemistry, Chemistry of Life Processes Institute and Proteomics Center of Excellence, Northwestern University, Evanston, Illinois 60208, United States
Jeannie M Camarillo, Department of Chemistry, Chemistry of Life Processes Institute and Proteomics Center of Excellence, Northwestern University, Evanston, Illinois 60208, United States.
John T. Wilkins, Department of Preventive Medicine, Feinberg School of Medicine, Northwestern University, Chicago, Illinois 60611, United States;.
Philip D. Compton, Department of Chemistry, Chemistry of Life Processes Institute and Proteomics Center of Excellence, Northwestern University, Evanston, Illinois 60208, United States; Integrated Protein Technologies, Inc., Evanston, Illinois 60646, United States;.
Neil L. Kelleher, Department of Chemistry, Chemistry of Life Processes Institute and Proteomics Center of Excellence, Northwestern University, Evanston, Illinois 60208, United States;.
REFERENCES
- (1).Schluter H; Apweiler R; Holzhutter HG; Jungblut PR Finding one’s way in proteomics: a protein species nomenclature. Chem. Cent. J 2009, 3 (1), 1–10. [DOI] [PMC free article] [PubMed] [Google Scholar]
- (2).Smith LM; Kelleher NL Proteoform : a single term describing protein complexity. Nat. Methods 2013, 10 (3), 186–187. [DOI] [PMC free article] [PubMed] [Google Scholar]
- (3).Seckler HDS; Fornelli L; Mutharasan RK; Thaxton CS; Fellers R; Daviglus M; Sniderman A; Rader D; Kelleher NL; Lloyd-Jones DM; Compton PD; Wilkins JT A Targeted, Differential Top-Down Proteomic Methodology for Comparison of ApoA-I Proteoforms in Individuals with High and Low HDL Efflux Capacity. J. Proteome Res 2018, 17 (6), 2156–2164. [DOI] [PMC free article] [PubMed] [Google Scholar]
- (4).Tucholski T; Cai W; Gregorich ZR; Bayne EF; Mitchell SD; McIlwain SJ; de Lange WJ; Wrobbel M; Karp H; Hite Z; Vikhorev PG; Marston SB; Lal S; Li A; Dos Remedios C; Kohmoto T; Hermsen J; Ralphe JC; Kamp TJ; Moss RL; Ge Y Distinct hypertrophic cardiomyopathy genotypes result in convergent sarcomeric proteoform profiles revealed by top-down proteomics. Proc. Natl. Acad. Sci. U. S. A 2020, 117 (40), 24691–24700. [DOI] [PMC free article] [PubMed] [Google Scholar]
- (5).Ntai I; LeDuc RD; Fellers RT; Erdmann-Gilmore P; Davies SR; Rumsey J; Early BP; Thomas PM; Li S; Compton PD; Ellis MJ; Ruggles KV; Fenyo D; Boja ES; Rodriguez H; Townsend RR; Kelleher NL Integrated Bottom-Up and Top-Down Proteomics of Patient-Derived Breast Tumor Xenografts. Mol. Cell Proteomics 2016, 15 (1), 45–56. [DOI] [PMC free article] [PubMed] [Google Scholar]
- (6).Smith LM; Kelleher NL Proteoform : a single term describing protein complexity. Nat. Methods 2013, 10 (3), 186–187. [DOI] [PMC free article] [PubMed] [Google Scholar]
- (7).Honda K; Srivastava S Potential usefulness of apolipoprotein A2 isoforms for screening and risk stratification of pancreatic cancer. Biomarkers Med. 2016, 10 (11), 1197–1207. [DOI] [PMC free article] [PubMed] [Google Scholar]
- (8).Toby TK; Fornelli L; Kelleher NL Progress in Top-Down Proteomics and the Analysis of Proteoforms. Annu. Rev. Anal. Chem 2016, 9, 499–519. [DOI] [PMC free article] [PubMed] [Google Scholar]
- (9).Ntai I; Kim K; Fellers RT; Skinner OS; Smith A. D. t.; Early BP; Savaryn JP; LeDuc RD; Thomas; Kelleher NL Applying label-free quantitation to top down proteomics. Anal. Chem 2014, 86 (10), 4961–4968. [DOI] [PMC free article] [PubMed] [Google Scholar]
- (10).Seckler H. d. S.; Fornelli L; Mutharasan RK; Thaxton CS; Fellers R; Daviglus M; Sniderman A; Rader D; Kelleher NL; Lloyd-Jones DM; et al. A Targeted, Differential Top-Down Proteomic Methodology for Comparison of ApoA-I Proteoforms in Individuals with High and Low HDL Efflux Capacity. J. Proteome Res 2018, 17 (6), 2156–2164. [DOI] [PMC free article] [PubMed] [Google Scholar]
- (11).Schaffer LV; Millikin RJ; Miller RM; Anderson LC; Fellers RT; Ge Y; Kelleher NL; LeDuc RD; Liu X; Payne SH; Sun L; Thomas PM; Tucholski T; Wang Z; Wu S; Wu Z; Yu D; Shortreed MR; Smith LM Identification and Quantification of Proteoforms by Mass Spectrometry. Proteomics 2019, 19 (10), No. 1970085. [DOI] [PMC free article] [PubMed] [Google Scholar]
- (12).Park HM; Winton VJ; Drader JJ; Manalili Wheeler S; Lazar GA; Kelleher NL; Liu Y; Tran JC; Compton PD Novel Interface for High-Throughput Analysis of Biotherapeutics by Electrospray Mass Spectrometry. Anal. Chem 2020, 92 (2), 2186–2193. [DOI] [PMC free article] [PubMed] [Google Scholar]
- (13).de la Llera-Moya M; Drazul-Schrader D; Asztalos BF; Cuchel M; Rader DJ; Rothblat GH The ability to promote efflux via ABCA1 determines the capacity of serum specimens with similar high-density lipoprotein cholesterol to remove cholesterol from macrophages. Arterioscler., Thromb., Vasc. Biol 2010, 30 (4), 796–801. [DOI] [PMC free article] [PubMed] [Google Scholar]
- (14).Rader DJ; Alexander ET; Weibel GL; Billheimer J; Rothblat GH The role of reverse cholesterol transport in animals and humans and relationship to atherosclerosis. J. Lipid Res 2009, 50, S189–S194. [DOI] [PMC free article] [PubMed] [Google Scholar]
- (15).Saleheen D; Scott R; Javad S; Zhao W; Rodrigues A; Picataggi A; Lukmanova D; Mucksavage ML; Luben R; Billheimer J; Kastelein JJ; Boekholdt SM; Khaw KT; Wareham N; Rader DJ Association of HDL cholesterol efflux capacity with incident coronary heart disease events: a prospective case-control study. Lancet Diabetes Endocrinol. 2015, 3 (7), 507–513. [DOI] [PMC free article] [PubMed] [Google Scholar]
- (16).Jensen MK; Aroner SA; Mukamal KJ; Furtado JD; Post WS; Tsai MY; Tjonneland A; Polak JF; Rimm EB; Overvad K; McClelland RL; Sacks FM High-Density Lipoprotein Subspecies Defined by Presence of Apolipoprotein C-III and Incident Coronary Heart Disease in Four Cohorts. Circulation 2018, 137 (13), 1364–1373. [DOI] [PMC free article] [PubMed] [Google Scholar]
- (17).Jensen MK; Rimm EB; Furtado JD; Sacks FM Apolipoprotein C-III as a Potential Modulator of the Association Between HDL-Cholesterol and Incident Coronary Heart Disease. J. Am. Heart Assoc 2012, 1 (2), No. e000232. [DOI] [PMC free article] [PubMed] [Google Scholar]
- (18).Koch M; Furtado JD; Jiang GZ; Gray BE; Cai T; Sacks F; Tjonneland A; Overvad K; Jensen MK Associations of anthropometry and lifestyle factors with HDL subspecies according to apolipoprotein C-III. J. Lipid Res 2017, 58 (6), 1196–1203. [DOI] [PMC free article] [PubMed] [Google Scholar]
- (19).Pollin TI; Damcott CM; Shen H; Ott SH; Shelton J; Horenstein RB; Post W; McLenithan JC; Bielak LF; Peyser PA; Mitchell BD; Miller M; O’Connell JR; Shuldiner AR A null mutation in human APOC3 confers a favorable plasma lipid profile and apparent cardioprotection. Science 2008, 322 (5908), 1702–1705. [DOI] [PMC free article] [PubMed] [Google Scholar]
- (20).Zhang Y; Sinaiko AR; Nelsestuen GL Glycoproteins and glycosylation: apolipoprotein c3 glycoforms by top-down maldi-tof mass spectrometry. Methods Mol. Biol 2012, 909, 141–150. [DOI] [PubMed] [Google Scholar]
- (21).Nicolardi S; van der Burgt YE; Dragan I; Hensbergen PJ; Deelder AM Identification of new apolipoprotein-CIII glycoforms with ultrahigh resolution MALDI-FTICR mass spectrometry of human sera. J. Proteome Res 2013, 12 (5), 2260–2268. [DOI] [PubMed] [Google Scholar]
- (22).Jian W; Edom RW; Wang D; Weng N; Zhang SW Relative quantitation of glycoisoforms of intact apolipoprotein C3 in human plasma by liquid chromatography-high-resolution mass spectrometry. Anal. Chem 2013, 85 (5), 2867–2874. [DOI] [PubMed] [Google Scholar]
- (23).Savinova OV; Fillaus K; Jing L; Harris WS; Shearer GC Reduced apolipoprotein glycosylation in patients with the metabolic syndrome. PLoS One 2014, 9 (8), No. e104833. [DOI] [PMC free article] [PubMed] [Google Scholar]
- (24).Friedman GD; Cutter GR; Donahue RP; Hughes GH; Hulley SB; Jacobs DR; Liu K; Savage PJ Cardia - Study Design, Recruitment, and Some Characteristics of the Examined Subjects. Journal of Clinical Epidemiology 1988, 41 (11), 1105–1116. [DOI] [PubMed] [Google Scholar]
- (25).Wessel D; Flugge UI A method for the quantitative recovery of protein in dilute solution in the presence of detergents and lipids. Anal. Biochem 1984, 138 (1), 141–143. [DOI] [PubMed] [Google Scholar]
- (26).Fellers RT; Greer JB; Early BP; Yu X; LeDuc RD; Kelleher NL; Thomas PM ProSight Lite: graphical software to analyze top-down mass spectrometry data. Proteomics 2015, 15 (7), 1235–8. [DOI] [PMC free article] [PubMed] [Google Scholar]
- (27).Nilsson J; Ruetschi U; Halim A; Hesse C; Carlsohn E; Brinkmalm G; Larson G Enrichment of glycopeptides for glycan structure and attachment site identification. Nat. Methods 2009, 6 (11), 809–811. [DOI] [PubMed] [Google Scholar]
- (28).Mauger JF; Couture P; Bergeron N; Lamarche B Apolipoprotein C-III isoforms: kinetics and relative implication in lipid metabolism. J. Lipid Res 2006, 47 (6), 1212–1208. [DOI] [PubMed] [Google Scholar]
- (29).Krishnan S; Shimoda M; Sacchi R; Kailemia MJ; Luxardi G; Kaysen GA; Parikh AN; Ngassam VN; Johansen K; Chertow GM; Grimes B; Smilowitz JT; Maverakis E; Lebrilla CB; Zivkovic AM HDL Glycoprotein Composition and Site-Specific Glycosylation Differentiates Between Clinical Groups and Affects IL-6 Secretion in Lipopolysaccharide-Stimulated Monocytes. Sci. Rep 2017, 7 (1), 1–15. [DOI] [PMC free article] [PubMed] [Google Scholar]
Associated Data
This section collects any data citations, data availability statements, or supplementary materials included in this article.